Zonal Isolation Market Size and Share
Market Overview
| Study Period | 2021 - 2031 |
|---|---|
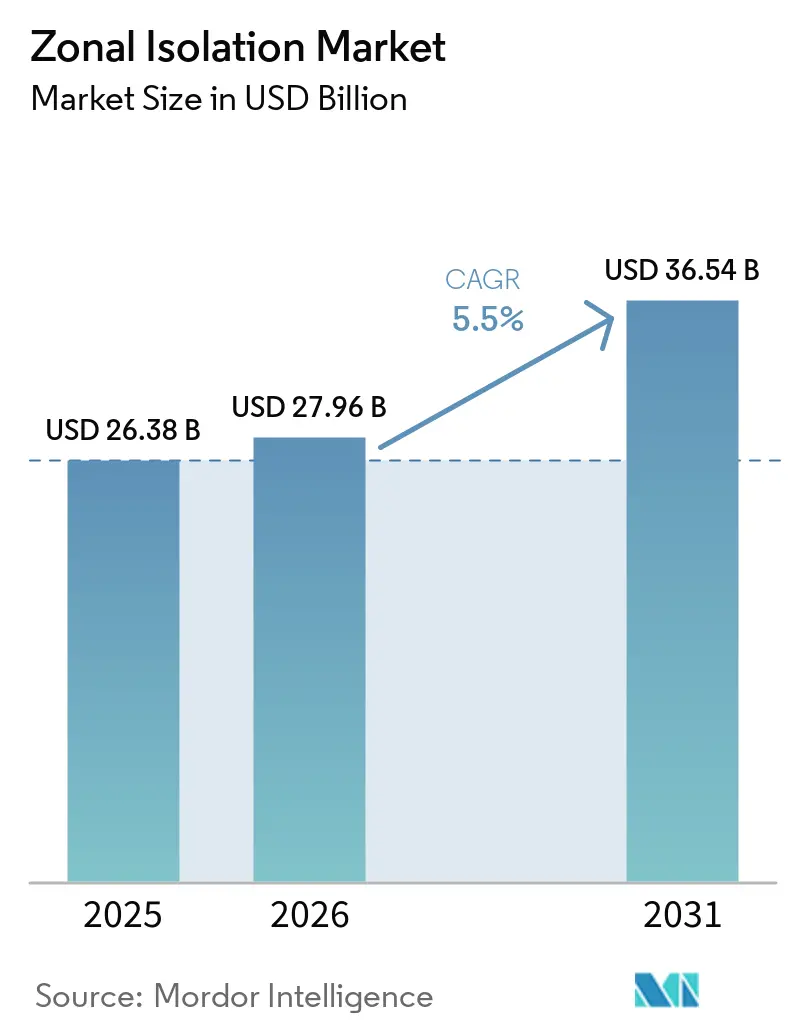
| Market Size (2026) | USD 27.96 Billion |
| Market Size (2031) | USD 36.54 Billion |
| Growth Rate (2026 - 2031) | 5.50% CAGR |
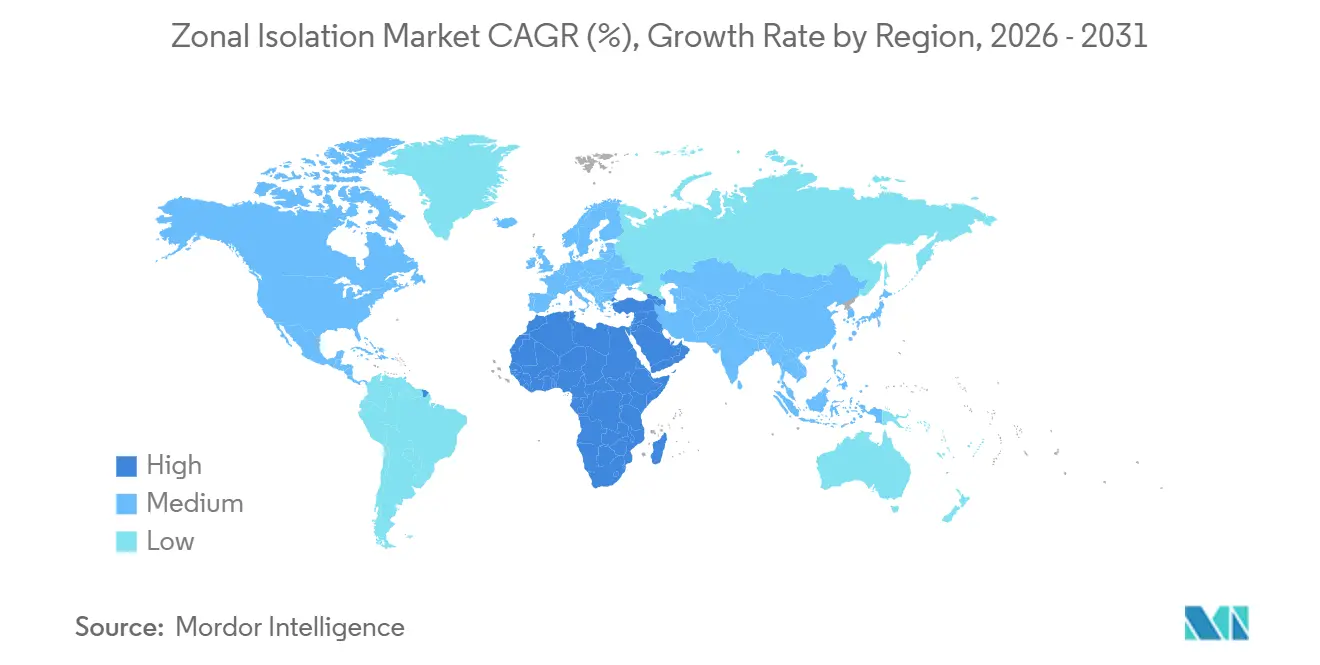
| Fastest Growing Market | Middle East and Africa |
| Largest Market | North America |
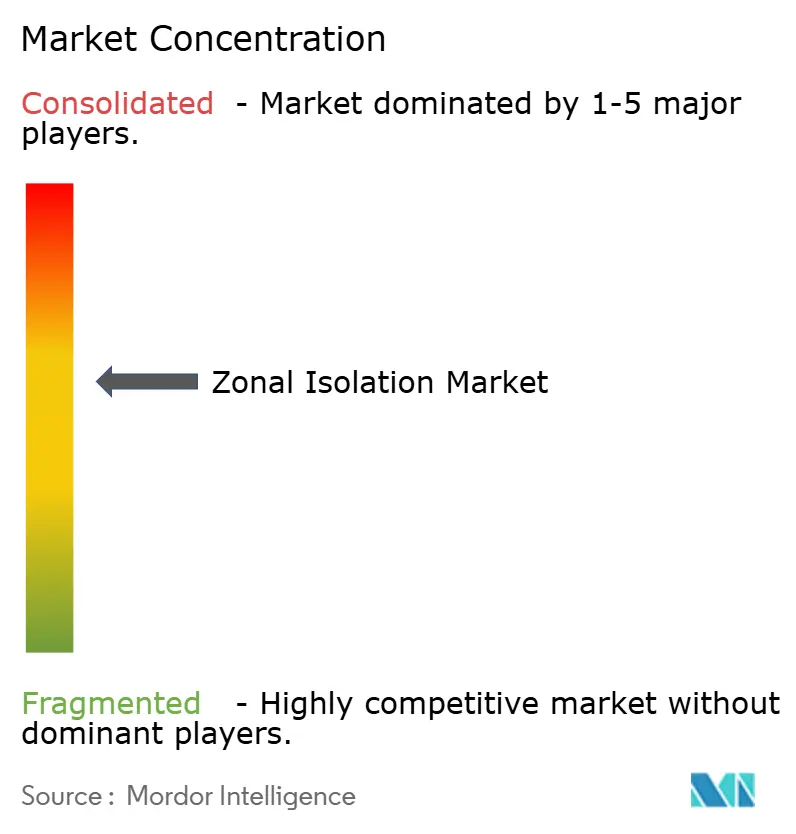
| Market Concentration | Medium |
Major Players *Disclaimer: Major Players sorted in no particular order Image © Mordor Intelligence. Reuse requires attribution under CC BY 4.0. | |
Zonal Isolation Market Analysis by Mordor Intelligence
The Zonal Isolation Market size is expected to increase from USD 26.38 billion in 2025 to USD 27.96 billion in 2026 and reach USD 36.54 billion by 2031, growing at a CAGR of 5.5% over 2026-2031. Demand is shifting from high-volume shale completions toward technically stringent projects such as carbon-capture storage (CCS) injection wells, enhanced geothermal systems operating beyond 225 °C, and ultra-deepwater wells where a single remediation can exceed USD 200 million.[1]Dev Chandrasekhar, “Ultra-Deepwater Crude Gamble,” thecore.in Mechanical tools continue to dominate because they are quick to deploy, and chemical solutions are gaining traction, driven by advancements in geopolymer and self-healing cements, which reduce CO₂ emissions while effectively sealing microannuli under extreme conditions.[2]Baker Hughes, “InvictaSet Technical Sheet,” bakerhughes.com Additionally, the increasing prevalence of unconventional reservoirs, horizontal well designs, and stricter integrity standards (such as API Std 65-3 and ISO 14310) is intensifying the demand for robust barriers, encouraging investments in premium packers and high-performance cements.[3]American Petroleum Institute, “Simul-Frac Evolution,” api.org Furthermore, the adoption of all-electric intelligent completions, currently being piloted in regions like Brazil and the Middle East, offers the potential for reduced hardware requirements. However, these systems also emphasize the importance of flawless primary cementing, as post-installation workovers are prohibitively expensive.[4]Schlumberger, “Brazil Pre-Salt Award,” slb.com
Key Report Takeaways
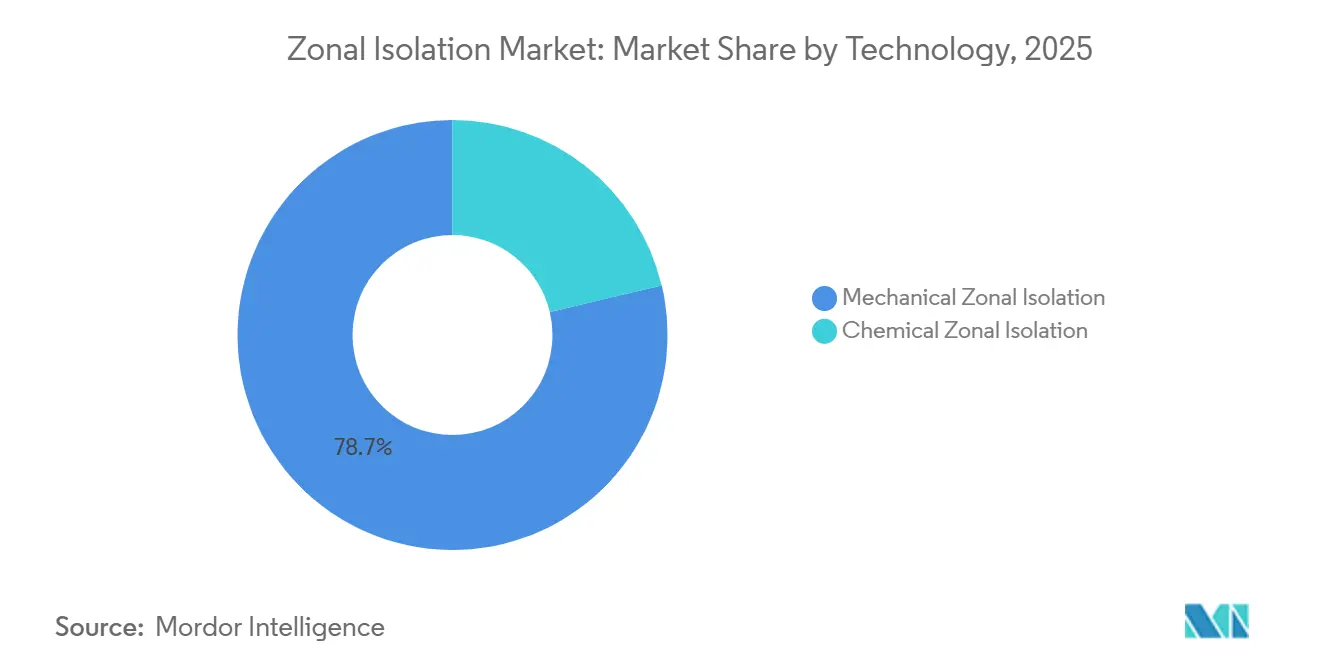
- By technology, mechanical isolation led with 78.7% of the zonal isolation market share in 2025, while chemical systems posted the fastest growth at a 6.2% CAGR through 2031.
- By well type, vertical wells led with 41.4% of the zonal isolation market share in 2025, while horizontal well posted the fastest growth at a 6.4% CAGR through 2031.
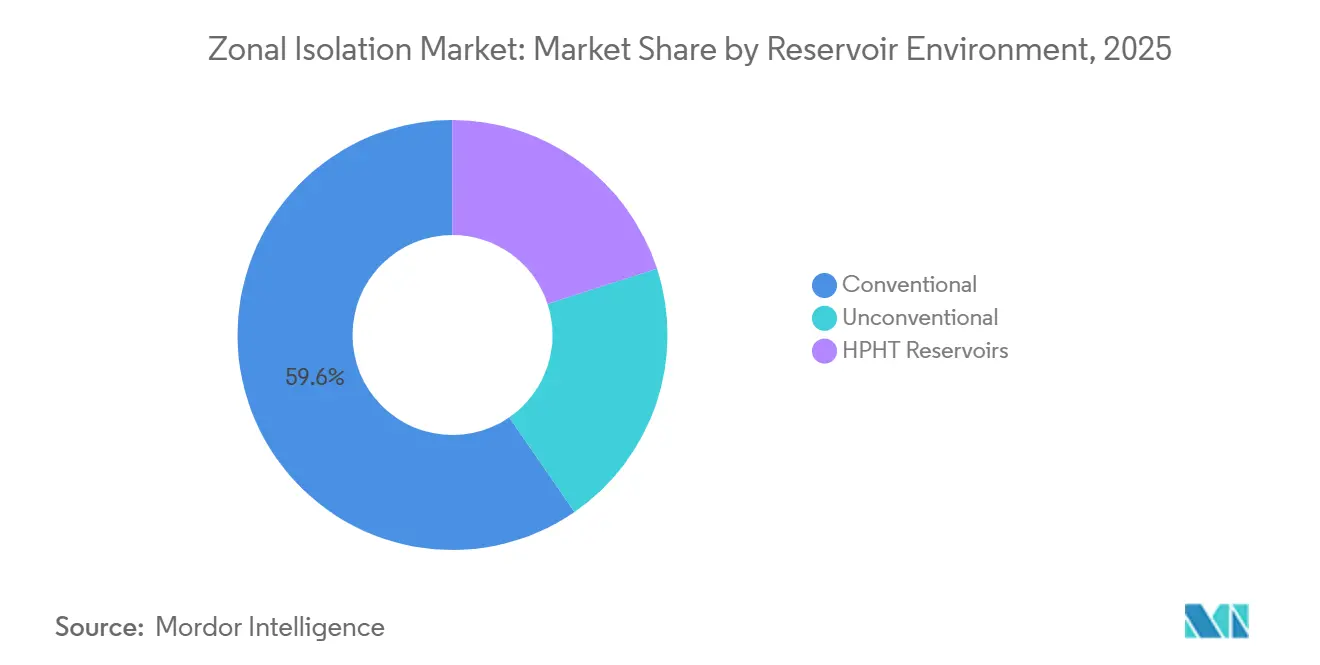
- By reservoir environment, conventional led with 59.6% of the zonal isolation market share in 2025, while unconventional posted the fastest growth at a 6.7% CAGR through 2031.
- By lifecycle stage, completion activities represented 47.2% of turnover in 2025, while production-stage work recorded the highest projected CAGR at 6.0% as mature wells require remediation and shutoff treatments.
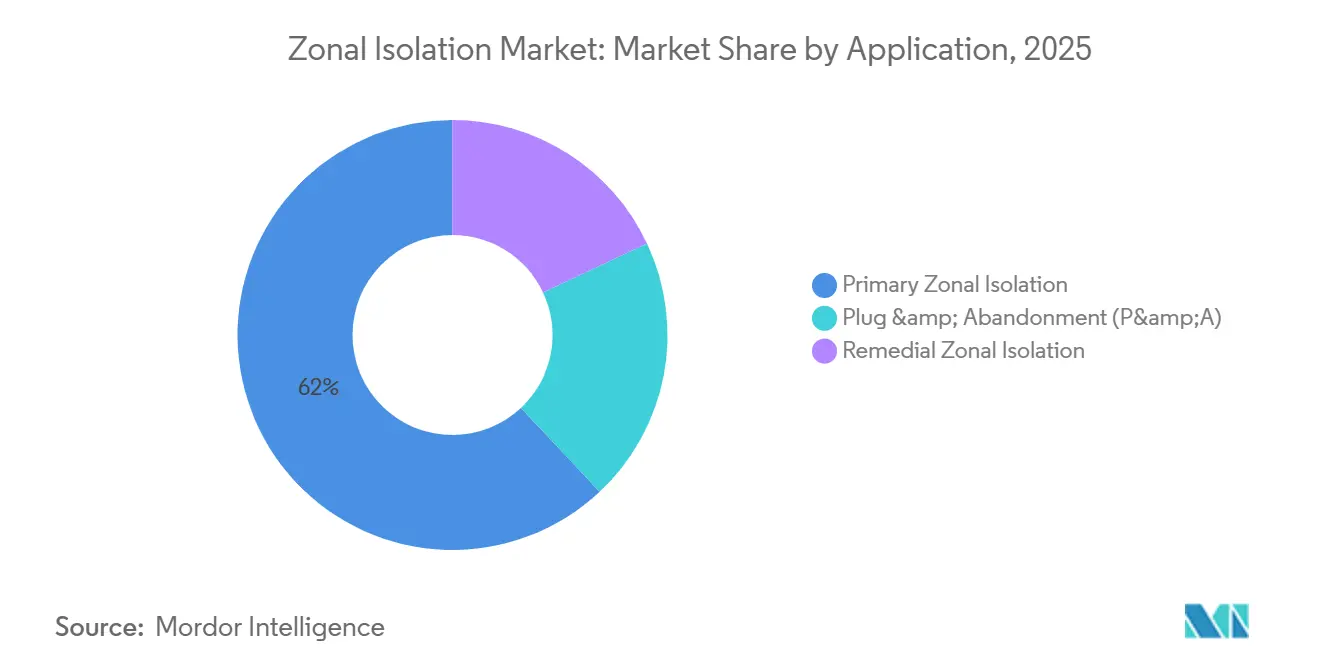
- By application, primary barriers accounted for 62.0% of value in 2025, but remedial isolation is forecast to outpace with a 6.3% CAGR, spurred by the North Sea’s sizable plug-and-abandonment backlog.
- By location, onshore wells delivered 71.3% of 2025 revenue; however, offshore services are advancing at a 6.6% CAGR as deepwater projects proliferate in Brazil, India, and Guyana.
- By geography, North America generated 39.1% of 2025 receipts, yet the Middle East & Africa region is projected to expand at 6.5% CAGR, the quickest pace worldwide, on the back of Saudi Arabia’s Jafurah development.
Note: Market size and forecast figures in this report are generated using Mordor Intelligence’s proprietary estimation framework, updated with the latest available data and insights as of January 2026.
Global Zonal Isolation Market Trends and Insights
Drivers Impact Analysis*
| Driver | (~) % Impact on CAGR Forecast | Geographic Relevance | Impact Timeline |
|---|---|---|---|
| Shale & tight-gas drilling boom | +1.2% | North America, Argentina, China | Medium term (2–4 years) |
| Deep- & ultra-deepwater development upsurge | +0.9% | Brazil, Guyana, India KG, West Africa | Long term (≥ 4 years) |
| Stricter well-integrity mandates | +0.7% | Global focus on North Sea, Gulf of Mexico, Canada | Short term (≤ 2 years) |
| Rising horizontal & multistage frac completions | +1.1% | Permian, Vaca Muerta, Jafurah | Medium term (2–4 years) |
| Geothermal heat-loop wells | +0.4% | Utah FORGE, Iceland, Indonesia | Long term (≥ 4 years) |
| CCS injection wells | +0.5% | United States, North Sea, GCC | Long term (≥ 4 years) |
| Source: Mordor Intelligence | |||
Shale and Tight-Gas Drilling Boom
Permian simul-frac programs now fracture up to eight horizontal wells simultaneously, reducing cycle times and increasing the demand for composite plugs that can be drilled out in under 15 minutes per stage. A single pad may require up to 300 plugs, driving higher volumes despite a lower cost per well. In Saudi Arabia's Jafurah carbonate formation, acid-resistant elastomers are needed to seal laterals exceeding 10,000 feet while withstanding CO₂-rich fluids. Argentina's Vaca Muerta is projected to complete 28,040 stages by 2026, necessitating the localization of a supply chain for bridge plugs and cement retainers. Similarly, China's Sichuan shale gas initiative plans for 6,000 new horizontal wells by 2030, each requiring 30-50 barriers.
Deep- and Ultra-Deepwater Development Upsurge
SLB's 35-well pre-salt contract in Brazil includes all-electric completions, which reduce the number of packers but require precise cement bonding at water depths of 2,000 meters. ONGC's USD 5.08 billion Cluster 2 project involves 35 wells reaching a total depth of 4,200 meters, with each injector requiring isolation rated above 5,000 psi. ExxonMobil's production in Guyana reached 900,000 barrels per day in 2026, with stacked turbidites necessitating the use of high-performance cements to mitigate water coning.
Stricter Well-Integrity Mandates
API Std 65-3 Part 3 and ISO 14310 now mandate validated pressure-temperature cycling for permanent barriers, requiring operators to phase out legacy plugs. The NSTA prohibits field cessations unless cement plugs pass updated durability tests, maintaining North Sea P&A expenditures. BSEE has reduced Gulf idle-well timelines from seven years to five, expediting abandonment activities.
Horizontal and Multistage Frac Completions
Average Permian laterals now exceed 15,000 feet with over 60 clusters, doubling the use of isolation hardware compared to 2020 wells. Vaca Muerta follows a similar trend with lateral lengths of 10,000 feet. Meanwhile, Canada’s Montney region is testing sliding-sleeve designs that reduce plug counts, enhance operational efficiency, and improve cement placement accuracy for better well integrity.
Restraints Impact Analysis*
| Restraint | (~) % Impact on CAGR Forecast | Geographic Relevance | Impact Timeline |
|---|---|---|---|
| Crude-price volatility curbing CAPEX cycles | -0.8% | Global, acute in North America shale & frontier deepwater | Short term (≤ 2 years) |
| Cement-sustainability & CO₂ scrutiny | –0.3% | Europe, North America, emerging in Asia-Pacific | Medium term (2–4 years) |
| Supply-chain pinch in specialty swell-elastomers | –0.2% | North America, Middle East unconventionals | Short term (≤ 2 years) |
| Rise of all-electric completions | –0.4% | Deepwater Brazil, Gulf of Mexico, Middle East | Long term (≥ 4 years) |
| Source: Mordor Intelligence | |||
Crude-Price Volatility Curbing CAPEX Cycles
Brent crude prices ranged between USD 75 - 85 per barrel in early 2026, leading Chevron to cap its 2026 spending at USD 19 billion and postpone exploratory deepwater drilling projects. An 8% decline in U.S. shale rigs during late 2025 resulted in reduced well completions and decreased plug consumption. Middle Eastern NOCs partially mitigated these reductions by maintaining their multi-billion-dollar programs, ensuring continued activity.
Cement Sustainability and CO₂ Footprint Scrutiny
The CBAM tariff will take effect in 2026, imposing penalties on high-carbon cements imported into the EU. In California and Norway, oil companies are requiring product-level carbon intensity disclosures, driving the adoption of low-clinker blends. For instance, Baker Hughes' InvictaSet reduces clinker content by 30% while maintaining compliance with ISO-14310 standards, supporting sustainability goals in the construction and energy sectors.
*Our forecasts treat driver/restraint impacts as directional, not additive. The impact forecasts reflect baseline growth, mix effects, and variable interactions.
Segment Analysis
By Technology: Chemical Adoption Accelerates as Cements Get Smarter
Mechanical tools accounted for the majority of revenue in 2025; however, chemical advancements, such as self-healing and geopolymer blends, are projected to grow at a 6.2% CAGR through 2031. Baker Hughes’ InvictaSet facilitates calcium carbonate precipitation in micro-cracks, enhancing the lifespan of CCS wells under super-critical CO₂ conditions. Similarly, SLB’s SqueezeCRETE penetrates 120-micron slots at temperatures ranging from 40 to 320 °F, providing a mid-life repair solution that surpasses traditional micro-cements. The zonal isolation market size for chemical systems is expected to expand, driven by low-carbon mandates in Europe and North America. Concurrently, mechanical innovations, such as Weatherford’s rotating liner hanger in Turkmenistan and Oilfield Service Professionals’ 34,000-foot cast-iron retainer in the Gulf, demonstrate ongoing advancements in hardware for extreme well conditions. Hybrid approaches, which involve setting a bridge plug followed by cement squeezing above it, combine the immediate isolation provided by mechanical tools with the durability of cured cement. Regulatory testing under ISO 14310 and API 65-3 ensures that both mechanical and chemical systems meet the same integrity standards, promoting coexistence rather than replacement.


By Well Type: Horizontal Wells Drive Completion Evolution
Vertical drilling is projected to account for 41.4% of the market value in 2025, while horizontal wells are growing at a compound annual growth rate (CAGR) of 6.4% as operators focus on maximizing reservoir contact. In the Permian Basin, lateral lengths now exceed 15,000 feet, with over 60 stages per well, effectively doubling the consumption of materials per well and driving growth in the zonal isolation market, even as well counts stabilize. Similarly, Vaca Muerta's 10,000-foot horizontal wells demonstrate comparable intensity, with operators such as GeoPark, YPF, Shell, and Chevron expected to complete 28,040 stages by 2026. Multilateral wells in regions like Kuwait and Oman highlight niche growth, where resin sealants are used to isolate branch junctions without requiring additional surface holes. Consequently, the market share for horizontal wells in zonal isolation is anticipated to continue increasing. However, sliding-sleeve completions in the Montney region indicate that tool intensity can decrease when sleeves replace plugs, shifting the focus back to cement quality.
By Reservoir Environment: Unconventionals Outpace Conventionals
Conventional fields accounted for 59.6% of revenue in 2025, while unconventional reservoirs demonstrated a growth rate of 6.7% CAGR. In 2025, oil production in the Permian Basin exceeded 6 million barrels per day (bpd), with each Delaware well requiring 40-60 plugs capable of withstanding pressures of up to 10,000 psi. Initiatives such as China’s 6,000-well Sichuan program and India’s HPHT Andaman exploration indicate that high-pressure and high-temperature (HPHT) conditions are becoming more common, driving advancements in elastomer chemistry, including FFKM, and the adoption of metal-to-metal seals. The zonal isolation market for HPHT wells is projected to grow steadily as operators target deeper and hotter reservoirs.
By Lifecycle Stage: Production & Abandonment Gather Steam
Completion work accounted for 47.2% of the projected 2025 turnover, while production-stage isolation is expected to grow at a CAGR of 6.0%, driven by the increasing need for water-shutoff squeezes, annular pressure remediation, and conformance control in mature wells. The 34-well North Sea plug and abandonment (P&A) contract by Helix and stricter idle-well regulations from the Bureau of Safety and Environmental Enforcement (BSEE) are contributing to higher abandonment expenditures, thereby expanding the zonal isolation market within late-life services. Managed-pressure squeezes and expandable liners are gaining traction as they help reduce rig days while meeting API 65-3 permanence standards. These technologies are becoming critical for operators seeking to optimize costs and comply with evolving regulatory and environmental requirements during the abandonment process.
By Application: Remedial Barriers Catch Up
Primary cementing and packer installation accounted for 62.0% of the projected 2025 market value, while remedial work is expected to grow at a compound annual growth rate (CAGR) of 6.3%. North Sea operators are anticipated to face plug and abandonment (P&A) costs of USD 55.23 billion for over 500 overdue wells, ensuring sustained demand for cement retainers and swell packers over the next decade. The increasing adoption of self-healing cements and metal-skin liners, which provide permanent solutions, highlights a shift from short-term cost-saving approaches, such as inexpensive squeezes, to a focus on long-term quality and reliability.
By Location: Offshore Growth Outstrips Onshore Volume
Onshore accounted for 71.3% of sales, driven by the extensive number of shale wells. However, offshore operations are growing at a compound annual growth rate (CAGR) of 6.6%, as each subsea well requires multi-million-dollar isolation budgets. Examples such as SLB's pre-salt all-electric completions and ONGC's 430-km KG-DWN flowline network underscore the substantial capital requirements of offshore activities. The repair cost for a single failed offshore barrier can reach up to USD 50 million, highlighting the critical need for premium materials, real-time quality control measures, and robust systems to mitigate risks, improve operational efficiency, and prevent costly failures in these high-stakes operations.
Geography Analysis
North America is projected to account for 39.1% of the 2025 revenue. The rise in Permian simul-frac programs has increased demand for plugs, while stricter idle-well regulations from the Bureau of Safety and Environmental Enforcement (BSEE) have accelerated spending on plug and abandonment (P&A) activities in the Gulf of Mexico. In Canada, the Montney formation is testing sliding-sleeve systems, which reduce hardware requirements but rely on precise cementing to prevent sleeve cross-talk. These developments underscore the region's focus on improving operational efficiency and adhering to regulatory requirements.
The Middle East & Africa is the fastest-growing region, with a compound annual growth rate (CAGR) of 6.5%. In Saudi Arabia, the Jafurah tight carbonate formations require acid-resistant elastomers to manage fluids containing 15% CO₂. Additionally, ADNOC Drilling's 10% improvement in well delivery times has enabled capital reallocation for expanding rig fleets in Oman and Kuwait, which together operate over 300 units. Growth in this region is driven by increased exploration and production activities, supported by advancements in drilling technologies.
Asia-Pacific and South America represent the next tier of growth. In China, the Sichuan Basin is expected to see the drilling of 6,000 new horizontal wells, each requiring 30-50 barriers. In South America, Brazil's pre-salt fields and Guyana's Stabroek block are contributing to the development of numerous subsea wells, necessitating high-specification cements capable of withstanding water depths of up to 2,000 meters. These regions are positioned for significant growth due to increasing investments in upstream activities and infrastructure development.
Europe is shifting its focus toward decommissioning activities. The backlog managed by the North Sea Transition Authority (NSTA) is driving a robust offshore plug and abandonment (P&A) services market. This trend reflects the region's priority on addressing aging infrastructure and meeting environmental compliance standards, ensuring sustained demand for decommissioning services.

Competitive Landscape
The market is moderately concentrated, with Schlumberger, Halliburton, and Baker Hughes collectively holding a significant share of global cementing and mechanical isolation revenues. Baker Hughes' InvictaSet regenerative cement is designed for CCS wells, addressing self-healing micro-cracks and securing long-term contracts. Weatherford's focus on liner-hanger systems has resulted in a multi-year North Sea contract with TotalEnergies, highlighting the demand for single-trip isolation solutions in brownfield projects.
Specialized suppliers are addressing niche market needs. Oilfield Service Professionals achieved a record-setting 34,000-foot cast-iron retainer, demonstrating expertise in ultra-deep high-pressure, high-temperature (HPHT) environments. TAM International has invested in elastomer compounding in the Middle East to mitigate supply chain bottlenecks.
Advancements in all-electric completions could alter the competitive landscape. Halliburton's SmartWell Turing system reduces the reliance on mechanical tools while increasing the complexity of cement services, creating opportunities for companies that excel in integrity-focused cementing for deepwater applications.
Zonal Isolation Industry Leaders
Schlumberger Ltd.
Halliburton Company
Baker Hughes Company
Weatherford International plc
NOV Inc.
- *Disclaimer: Major Players sorted in no particular order

Recent Industry Developments
- March 2026: GeoPark initiated drilling its first Vaca Muerta horizontal well, which is part of the planned 28,040 fracture stages, driving demand for composite plugs and retainers.
- February 2026: ADNOC Drilling announced plans for joint-venture expansion into Oman and Kuwait, aiming to operate rig fleets exceeding 300 units.
- February 2026: Weatherford has secured a completions contract for brownfield wells in the Danish North Sea, operated by TotalEnergies.
- November 2025: ExxonMobil's Guyana production reached 900,000 barrels per day (bpd), with the 18 subsea wells at Hammerhead requiring high-quality isolation solutions.


Global Zonal Isolation Market Report Scope
Zonal isolation involves establishing a permanent, impermeable barrier in the annulus between the casing and the borehole wall to prevent fluid migration, such as gas, oil, or water, between geological formations. This process ensures well integrity by sealing zones, preventing cross-flow, and blocking unwanted influx, typically achieved through the use of specialized cement or packers.
The Zonal Isolation Market is segmented into technology, well type, reservoir environment, lifecycle stage, application, location, and geography. By technology, the market is segmented into mechanical and chemical technologies. By well type, the market is segmented into vertical, deviated, horizontal, and multilateral wells. By reservoir environment, the market is segmented into conventional, unconventional, and HPHT reservoirs. By lifecycle stage, the market is segmented into drilling, completion, production, and abandonment stages. By application, the market is segmented into primary, remedial, and P&A applications. By location, the market is segmented into onshore and offshore. The report also covers the market size and forecasts for the zonal isolation market across major regions, including North America, Europe, Asia-Pacific, South America, and the Middle East and Africa. For each segment, the market sizing and forecasts have been done on the basis of value (USD).
| Mechanical Zonal Isolation |
| Chemical Zonal Isolation |
| Vertical Wells |
| Deviated Wells |
| Horizontal Wells |
| Multilateral Wells |
| Conventional |
| Unconventional |
| HPHT Reservoirs |
| Drilling |
| Completion |
| Production |
| Abandonment |
| Primary Zonal Isolation |
| Remedial Zonal Isolation |
| Plug and Abandonment (P&A) |
| Onshore |
| Offshore |
| North America | United States |
| Canada | |
| Mexico | |
| Europe | Germany |
| United Kingdom | |
| France | |
| Italy | |
| NORDIC Countries | |
| Russia | |
| Rest of Europe | |
| Asia-Pacific | China |
| India | |
| Japan | |
| South Korea | |
| ASEAN Countries | |
| Rest of Asia-Pacific | |
| South America | Brazil |
| Argentina | |
| Rest of South America | |
| Middle East and Africa | Saudi Arabia |
| United Arab Emirates | |
| South Africa | |
| Egypt | |
| Rest of Middle East and Africa |
| By Technology | Mechanical Zonal Isolation | |
| Chemical Zonal Isolation | ||
| By Well Type | Vertical Wells | |
| Deviated Wells | ||
| Horizontal Wells | ||
| Multilateral Wells | ||
| By Reservoir Environment | Conventional | |
| Unconventional | ||
| HPHT Reservoirs | ||
| By Lifecycle Stage | Drilling | |
| Completion | ||
| Production | ||
| Abandonment | ||
| By Application | Primary Zonal Isolation | |
| Remedial Zonal Isolation | ||
| Plug and Abandonment (P&A) | ||
| By Location | Onshore | |
| Offshore | ||
| By Geography | North America | United States |
| Canada | ||
| Mexico | ||
| Europe | Germany | |
| United Kingdom | ||
| France | ||
| Italy | ||
| NORDIC Countries | ||
| Russia | ||
| Rest of Europe | ||
| Asia-Pacific | China | |
| India | ||
| Japan | ||
| South Korea | ||
| ASEAN Countries | ||
| Rest of Asia-Pacific | ||
| South America | Brazil | |
| Argentina | ||
| Rest of South America | ||
| Middle East and Africa | Saudi Arabia | |
| United Arab Emirates | ||
| South Africa | ||
| Egypt | ||
| Rest of Middle East and Africa | ||


Key Questions Answered in the Report
How fast is the zonal isolation market expected to grow through 2031?
Revenue is projected to rise from USD 27.96 billion in 2026 to USD 36.54 billion by 2031, reflecting a 5.5% CAGR.
Which region offers the highest growth opportunity?
The Middle East & Africa is forecast to expand at about 6.5% CAGR, led by Saudi Arabia's Jafurah and UAE offshore programs.
Why are chemical isolation systems gaining traction?
Geopolymer and self-healing cements cut CO? intensity and repair micro-cracks autonomously, meeting stricter integrity rules without mechanical hardware.
What is driving offshore demand despite lower well counts?
Each deep-water well requires multi-million-dollar barrier systems; failures cost tens of millions, so operators invest heavily in premium packers and cements.
How could all-electric completions affect barrier consumption?
They remove mechanical packers but elevate the need for flawless primary cement, potentially shifting spend from hardware to high-end cementing services.
Page last updated on:


