
Wood Fiber Insulation Market Size and Share
Market Overview
| Study Period | 2021 - 2031 |
|---|---|
| Market Size (2026) | USD 0.99 Billion |
| Market Size (2031) | USD 1.34 Billion |
| Growth Rate (2026 - 2031) | 6.25 % |
| Fastest Growing Market | Asia Pacific |
| Largest Market | Asia Pacific |
| Market Concentration | Medium |
Major Players *Disclaimer: Major Players sorted in no particular order Image © Mordor Intelligence. Reuse requires attribution under CC BY 4.0. | |
Wood Fiber Insulation Market Analysis by Mordor Intelligence
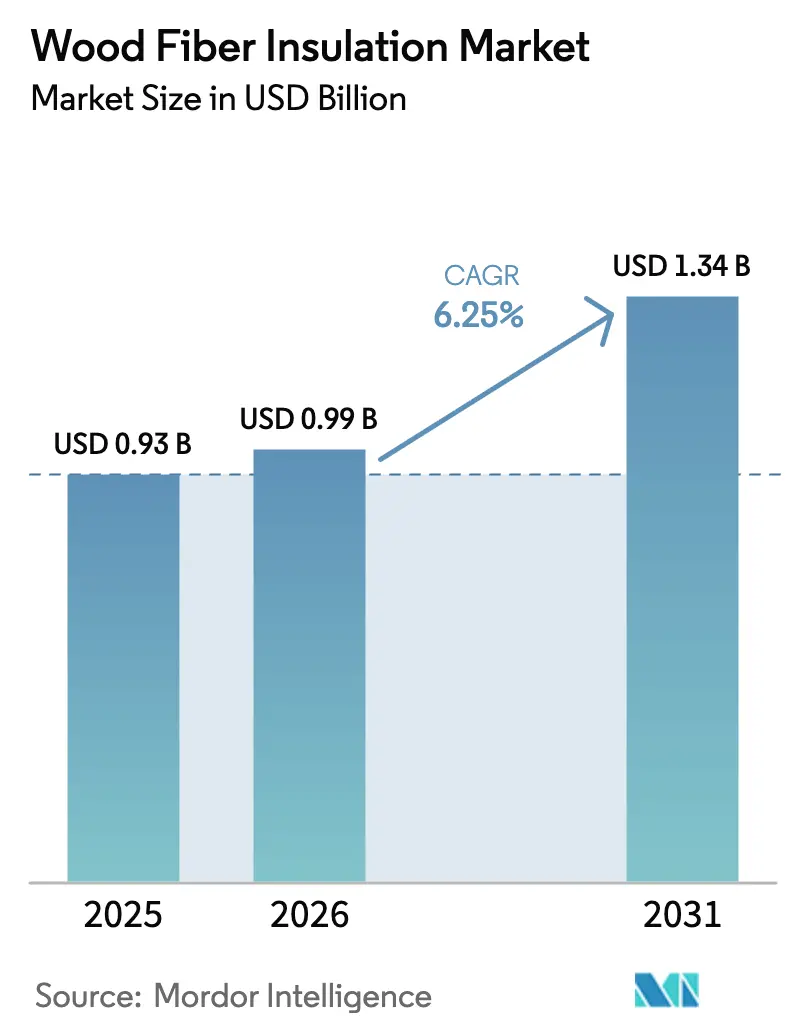
The Wood Fiber Insulation Market size is projected to be USD 0.93 billion in 2025, USD 0.99 billion in 2026, and reach USD 1.34 billion by 2031, growing at a CAGR of 6.25% from 2026 to 2031. Carbon-intensity limits written into building codes, coupled with mandatory whole-life carbon accounting in public procurement, are underpinning the expansion of the wood fiber insulation market. Retrofit subsidies in North America, notably New York’s USD 500 million allocation for envelope upgrades, are accelerating demand for vapor-open boards that mitigate thermal bridging. Europe continues to anchor volume on the back of decades-old installer training programs, yet North America is now the fastest-growing region as state and provincial incentives remove initial cost barriers. Corporate net-zero pledges are spilling into tenant-improvement specifications, lifting commercial uptake and signaling a structural shift away from petrochemical incumbents toward bio-based alternatives.
Key Report Takeaways
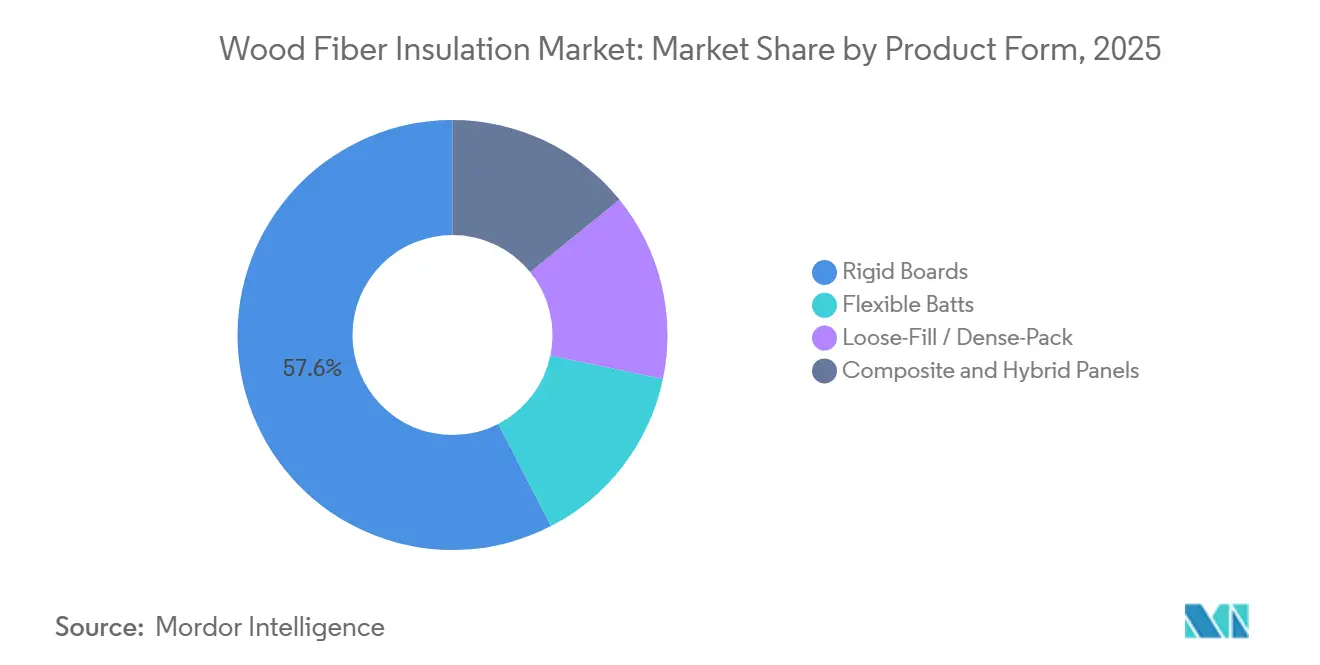
- By product form, rigid boards captured 57.57% of the wood fiber insulation market share in 2025, while loose-fill and dense-pack products are expanding at a 6.97% CAGR through 2031.
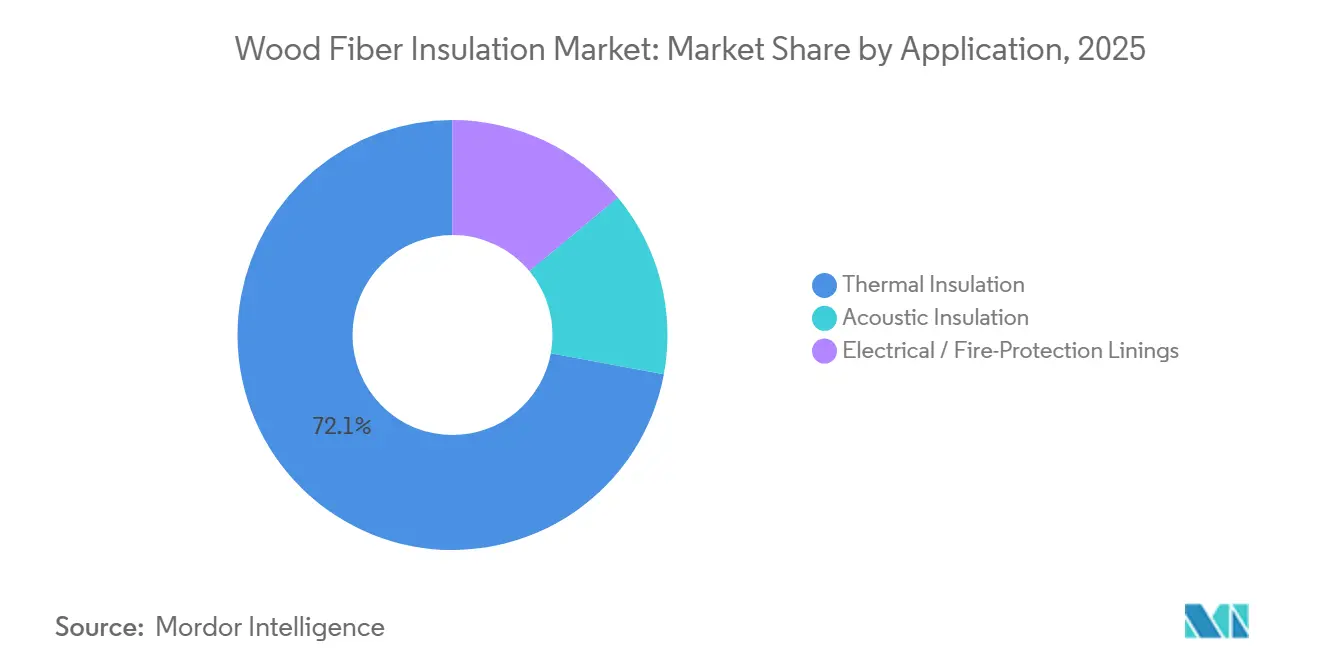
- By application, thermal insulation commanded 72.08% of the wood fiber insulation market size in 2025. However, acoustic insulation is advancing at the fastest 7.05% CAGR through 2031.
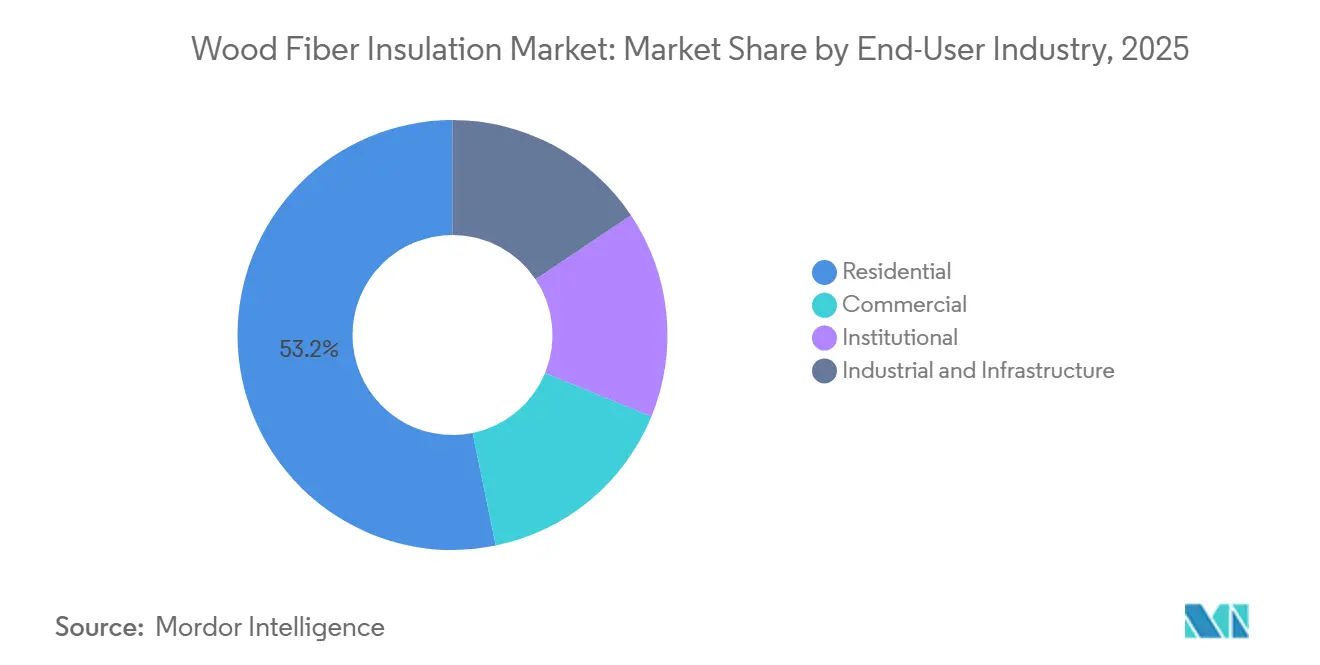
- By end-user industry, residential projects held 53.22% of 2025 demand while commercial construction is growing at a 6.86% CAGR through 2031.
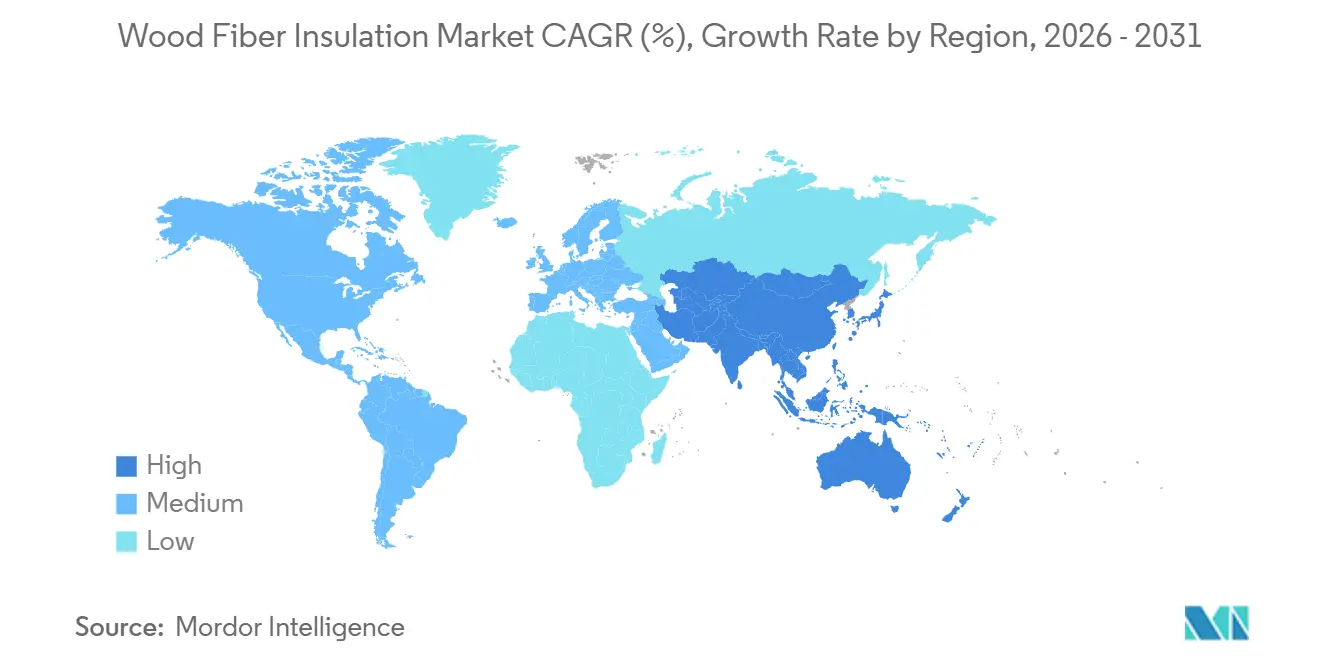
- By geography, Asia-Pacific retained the largest 51.19% revenue share in 2025, recording the fastest regional CAGR at 6.19% during 2026-2031.
Note: Market size and forecast figures in this report are generated using Mordor Intelligence’s proprietary estimation framework, updated with the latest available data and insights as of January 2026.
Market Trends and Insights
Drivers Impact Analysis of Wood Fiber Insulation Market*
| Drivers | (~) % Impact on CAGR Forecast | Geographic Relevance | Impact Timeline |
|---|---|---|---|
| Stricter net-zero building energy codes | +1.2% | North America and Europe, early adoption in select APAC cities | Medium term (2-4 years) |
| Surge in residential deep-retrofit programs | +1.5% | North America and Europe, with pilot programs in Australia and New Zealand | Short term (≤ 2 years) |
| Embodied-carbon rules in public procurement | +1.8% | Global, led by North America and Europe, gradual APAC uptake | Long term (≥ 4 years) |
| Off-site modular growth driving vapor-open materials | +0.9% | North America and Europe, emerging in Japan and South Korea | Medium term (2-4 years) |
| Supply-chain localization for circular-economy compliance | +0.7% | Europe and North America, with regional clusters in APAC | Long term (≥ 4 years) |
| Source: Mordor Intelligence | |||
Stricter Net-Zero Building Energy Codes
Mandatory upgrades to wall R-values and carbon-budget ceilings are compressing payback periods for bio-based insulation. California’s 2025 Title 24 amendments raised wall R-values by 15%, disqualifying single-layer fiberglass in climate zones 3–16 and steering architects toward continuous exterior wood fiber boards that satisfy vapor-open requirements[1]. Norway’s 2025 Technical Building Regulation capped operational plus embodied emissions at 8 kg CO₂-equivalent per m² annually, adding explicit carbon budgets to permit reviews. Irish and German net-zero standards likewise embed whole-life-carbon modules in compliance software, making the biogenic carbon of wood fiber visible at early design stages. As permit officers and energy-modeling consultants align on carbon ceilings, wood fiber moves from niche eco-choice to mainstream compliance route, especially in temperate and cold-climate envelopes. The driver’s influence is expected to intensify once U.S. states beyond California and New York harmonize codes with ASHRAE’s forthcoming CH-36 carbon appendix.
Surge in Residential Deep-Retrofit Programs
Public funding has reached record levels, unlocking latent demand for cavity-infilling materials that combine insulation and air-sealing in a single work step. New York’s EmPower+ weatherization mandate pegs blower-door performance at 0.25 cfm50 per ft², a threshold dense-pack wood fiber satisfies without formaldehyde-based binders. Canada’s Greener Homes Loan lifted its ceiling to CAD 40,000 (USD 29,600) in 2025, and application volume exceeded forecasts by 40% after homeowners paired heat pumps with attic re-insulation. Germany’s BEG grant now covers 45% of material costs for Efficiency House 55 retrofits, a target that vapor-open wood fiber helps achieve by preventing interstitial condensation. Funding milestones have forced contractors to invest in blower-door testing and thermal imaging, creating a feedback loop where verified air-sealing performance cements future wood fiber specifications. The retrofit surge is therefore both a volume catalyst and a skills-development accelerator.
Embodied-Carbon Rules in Public Procurement
Federal and state agencies are turning carbon intensity into a bid pass-fail criterion rather than a tiebreaker. The U.S. Environmental Protection Agency’s Buy Clean guidance prioritizes materials with cradle-to-gate Environmental Product Declarations, and wood fiber’s negative carbon footprint—minus 1.2 to minus 1.8 kg CO₂-e/kg—ranks it ahead of mineral wool and extruded polystyrene[2]. California’s 2025 Buy Clean Act now covers insulation packages in projects above USD 1 million, and early data show a 60% year-on-year rise in wood fiber specifications in state university dormitory renovations. New York Executive Order 22 demands whole-life-carbon assessment for state-funded buildings, normalizing the use of biogenic materials during tender evaluation. As ISO 14067 and EN 15804 become de facto gatekeepers, manufacturers lacking accredited EPDs face exclusion from institutional projects, reinforcing first-mover advantages for incumbent wood fiber producers.
Off-Site Modular Growth Driving Vapor-Open Materials
Modular factories value materials that can dry to both sides without additional membranes, and wood fiber boards meet that performance brief. Modular housing captured 6% of U.S. residential starts in 2025, and leading factories reported 40% fewer mold-related callbacks when switching from closed-cell spray foam to wood fiber sheathing. The 2025 International Residential Code Appendix AW legalized vapor-open assemblies in climate zones 4-8, directly validating wood fiber layers in panelized systems. Japanese prefab leader Sekisui House initiated pilot projects that embed European-made boards into steel frames, citing fire-class B-s1, d0 ratings under EN 13501-1. With factories retrofitting CNC lines for wood-fiber board machining, long-term material contracts lock in demand and limit spot-market volatility. The modular channel is therefore both a growth vector and a stabilization mechanism for production runs.
Restraints Impact Analysis of Wood Fiber Insulation Market*
| Restraints | (~) % Impact on CAGR Forecast | Geographic Relevance | Impact Timeline |
|---|---|---|---|
| Price competition vs. mineral wool and fiberglass | -0.8% | Global, most acute in cost-sensitive residential segments | Short term (≤ 2 years) |
| Limited installer familiarity outside Europe | -0.6% | North America, APAC, and emerging markets | Medium term (2-4 years) |
| High logistics cost from low bulk density | -0.4% | Long-haul markets in APAC, Middle East, and remote regions | Long term (≥ 4 years) |
| Source: Mordor Intelligence | |||
Price Competition vs. Mineral Wool and Fiberglass
Delivered cost remains 10-20% higher than commodity mineral wool in U.S. and APAC housing markets where embodied-carbon premiums have yet to translate into mandatory specifications. Fiberglass batts retailed at USD 0.45 per board-foot R-value in 2025 big-box channels, compared with USD 0.55 for rigid wood fiber boards. Mineral wool keeps share in fire-rated assemblies because its non-combustible ASTM E136 classification eliminates extra coatings, whereas wood fiber boards sometimes require hybrid constructs to meet the same rating. Although deep-retrofit labor synergies close part of the gap, rebate structures in many jurisdictions cap reimbursements at commodity pricing, leaving homeowners to self-fund the premium. Until subsidy frameworks reward low-carbon materials directly, price tension will cap penetration in budget-constrained projects.
Limited Installer Familiarity Outside Europe
A 2025 survey showed only 18% of U.S. insulation contractors had hands-on experience with wood fiber compared with 94% for fiberglass. Certification programs are sparse—fewer than 50 installers across Canada as of 2025—so distributors hesitate to stock products with limited labor capacity. European manufacturers are funding mobile training units, yet ramp-up timelines extend into 2027, risking missed windows as retrofit grants sunset. The learning curve also includes unfamiliar fastener patterns and thicker wall sections, elements that slow jobsite productivity until crews gain repetition. Knowledge gaps, therefore, restrain volume, particularly in regions where retrofit backlogs already outstrip qualified labor pools.
*Our forecasts treat driver/restraint impacts as directional, not additive. The impact forecasts reflect baseline growth, mix effects, and variable interactions.
Wood Fiber Insulation Market Segment Analysis
By Product Form:
Rigid Boards Anchor Share, Loose-Fill Gains in RetrofitRigid boards commanded 57.57% of 2025 revenue, underscoring their fit with rain-screen and continuous-insulation assemblies that require dimensional stability. Prefab plants value boards that double as structural sheathing, trimming SKUs, and installation steps. Flexible batts remain niche where stud cavities vary, but mineral wool still dominates that channel, keeping batt uptake modest. Loose-fill and dense-pack products, however, are growing at a 6.97% CAGR because retrofit contractors blow material into irregular bays without settling risk, a durability edge verified in Canadian field studies. Composite panels pairing wood fiber facings with mineral wool or PIR cores are the fastest-evolving line, allowing EN 13501-2 fire ratings without intumescent sprays. As Kingspan’s 2025 vacuum-panel joint venture with Gutex matures, hybrid solutions will erode rigid-board share in passive-house retrofits, though single-material boards will stay dominant in code-minimum residential builds.
Second-generation wet-process lines reduce embodied energy by 18% versus legacy systems, enabling price cuts that buttress rigid-board market position. Meanwhile, loose-fill producers are investing in fiber-conditioning mills that raise bulk density by 12%, paring freight cost and smoothing blown coverage. The product-form landscape is therefore bifurcating: high-performance composite offerings target commercial retrofits where wall thickness is at a premium, while streamlined rigid boards defend core residential volume. Across both channels, digital modeling tools now include hygrothermal modules that highlight wood fiber’s buffering advantage, nudging architects to specify vapor-open layers early in schematic design.

By Application:
Thermal Dominates, Acoustic Surges in Multi-FamilyThermal insulation held 72.08% of the 2025 value because building codes universally dictate minimum R-values, and wood fiber boards fit continuous exterior applications without separate weather-resistive barriers. Acoustic usage is expanding at a 7.05% CAGR as mixed-use urban buildings chase 50-dB party-wall and 60-IIC floor-ceiling thresholds. Lab tests record a 52-dB weighted sound-reduction index for 100-mm wood fiber batts, outperforming closed-cell foams that peak in high frequencies but trail in mid-band attenuation. Developers now specify wood fiber in office fit-outs where open-plan acoustics drive tenant satisfaction metrics. Electrical and fire-protection linings remain small but strategic, with ammonium-polyphosphate-treated boards maintaining integrity for 90 minutes at 800 °C, three times longer than conventional OSB. Uptake depends on harmonizing ASTM and EN fire-test protocols, a work-in-progress for multinational data-center projects.
On the thermal front, updated software such as PHPP 10 now models dynamic vapor transport, revealing that wood fiber boards eliminate dew-point risks in climate zones 5-8 when combined with smart-vapor retarder membranes. As codes add hygrothermal checks to compliance paths, wood fiber’s ability to buffer humidity becomes a quantifiable asset. This technical edge offsets partial price premiums, sustaining thermal-segment dominance while acoustic and specialty niches provide margin diversification.
By End-User Industry:
Residential Leads, Commercial AcceleratesResidential accounted for 53.22% of 2025 revenue, buoyed by deep-retrofit grants and stricter prescriptive codes in single-family construction. Homebuilders in California, New York, and British Columbia now use software that integrates whole-life carbon into Title 24 and Step-Code workflows, making wood fiber a default selection in high-performance subdivisions. Commercial demand is growing at 6.86% as landlords pursue LEED v4.1 and WELL credits; wood fiber’s zero VOC emissions and moisture buffering score points across multiple categories. An East Coast study of LEED projects showed that swapping spray foam for wood fiber adds four certification points at negligible cost, tilting default specifications in Class A refurbishments.
Institutional buildings—schools, hospitals, government offices—are pivoting as procurement officers adopt embodied-carbon thresholds. Germany now requires life-cycle carbon accounting on public projects above EUR 2 million, and municipal planners report lower compliance costs when they specify wood fiber rather than purchase offsets. Cold-storage operators are piloting the material in high-humidity warehouses, leveraging its hygroscopic properties to curb condensation. Fast-growing commercial and institutional uptake signals a power shift from facilities managers to sustainability officers who rank carbon metrics alongside cost and schedule, sustaining above-trend growth relative to the still-dominant residential segment.
Geography Analysis
APAC Wood Fiber Insulation Market
Asia-Pacific retained the largest revenue share at 51.19% of the global wood fiber insulation market in 2025, and is also estimated to be the fastest-growing region with a CAGR of 6.19% from 2026-2031. Wood fiber insulation adoption in the region is still developing in many markets due to sparse installer training and freight cost penalties. Japan’s 2025 Building Standard Law now caps embodied carbon in public buildings above 2,000 m², and Sekisui House is testing European-sourced boards in modular steel frames. Australia’s National Construction Code 2025 tightened R-values in alpine zones, creating niche demand in Tasmania and high-altitude New South Wales. Freight costs add USD 0.10-0.12 per board-foot, limiting wood fiber to premium green-build projects until regional plants emerge.
Europe Wood Fiber Insulation Market
Europe accounted for a significant regional share in 2025, underpinned by Germany, France, and the United Kingdom. The United Kingdom’s Future Homes Standard, effective 2026, requires 75% operational-carbon reductions; passive-house architects wield continuous wood fiber layers to eliminate thermal bridges. Although Europe’s penetration rate nears 40% in Alpine and Nordic new-builds, retrofit programs sustain modest growth even as new-construction upside narrows.
North America Wood Fiber Insulation Market
In North America, California, Oregon, and Washington integrate embodied-carbon tables into energy-code compliance, while New York funds deep-energy retrofits that pair heat pumps with continuous exterior insulation. Canada’s Greener Homes loan boost to CAD 40,000 (USD 29,600) sparked provincial bulk-purchase programs that shaved 12-15% off wood fiber board pricing. Mexico’s NOM-020-ENER update set envelope requirements that wood fiber fulfills, birthing an early-adopter cluster in Monterrey and Guadalajara luxury projects.
MEA and South America Wood Fiber Insulation Market
South America and the Middle East and Africa trail, though Dubai’s Al Sa’fat rating system grants low-carbon credits that tilt high-end hospitality projects toward wood fiber.
Regulatory Landscape
Wood fiber insulation access to the EU market is anchored in the Construction Products Regulation (Regulation (EU) No 305/2011) and product conformity routes such as European Technical Assessments (ETAs) issued by bodies including Deutsches Institut fuer Bautechnik (DIBt). For example, DIBt-issued ETAs for wood fiber insulation products reference EAD 040138-01-1201 for loose-fill insulation, which helps manufacturers document declared performance for CE-marking and for acceptance by specifiers and building control in Europe.
Carbon and documentation requirements are increasingly layered alongside classic thermal and fire performance. Public procurement and building programs are pushing Environmental Product Declarations (EPDs) into bid compliance, but an industry-wide EPD for standalone wood fiber insulation is not broadly available across North America or Europe. That gap elevates the role of product-specific, independently verified EPDs and system-level model EPDs, for example, for ETICS. In Canada, the May 2026 Wood Fibre Insulation in Ontario Roadmap highlighted that limited explicit recognition in the Ontario Building Code can force alternative compliance pathways, adding time and cost to approvals and slowing broader adoption beyond the most experienced installer and design networks.
Value Chain Analysis
The value chain starts with forestry and sawmilling operations that generate residual softwood chips and other wood residues, followed by fiber preparation (defibration) and board or batt/loose-fill manufacturing using wet-process or dry-process lines with binders and additives. Producers commonly regionalize manufacturing and co-locate near sawmills to reduce inbound feedstock logistics, a key consideration given the low bulk density of insulation products and the freight penalty on long-haul routes.
Downstream, distribution moves through building-material distributors, specialist insulation channels, and increasingly through retrofit and modular construction contractors that prioritize vapor-open assemblies. Documentation and compliance assets (ETAs/EPDs, fire and hygrothermal data, and code-approval dossiers) then become enabling links between production and specification and procurement. Operational updates from major producers also point to sensitivity to volatility across the chain, including weather-driven swings in construction activity and cost pressure transmission (energy and transport), which affect inventory planning, production scheduling, and the attractiveness of localized supply clusters.
Competitive Landscape
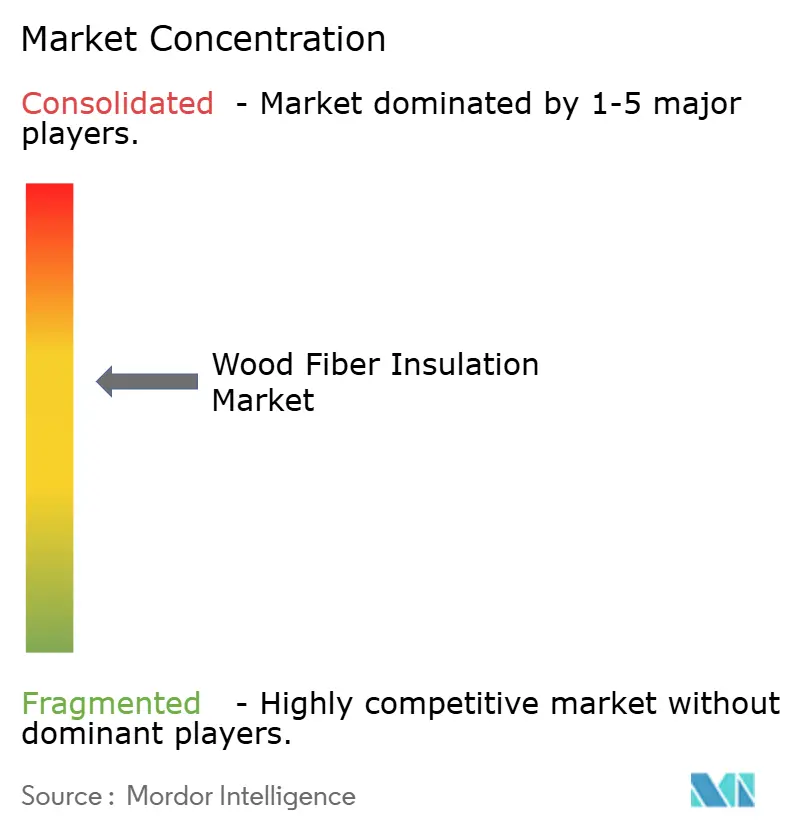
The wood fiber insulation market is moderately consolidated. Barriers include integrated forestry assets, specialized defibration lines, and code-approval dossiers. STEICO’s vertical supply chain, from sawmill residuals to finished boards, insulated margins during 2025 resin-price spikes. The 30,000-m³ expansion at its Polish plant targets Central European tenders that now require carbon disclosure on public projects above EUR 5 million.
White-space lies in hybrid laminates that marry fire-resistant cores with vapor-open facings. Patent filings for composite panels climbed 40% year-on-year, centered on structural load-bearing and fire-resistant designs. Agricultural-residue challengers (hemp, straw) test the waters but still lack the code acceptance and long-term durability data amassed by wood fiber over three decades of European field performance. Mergers and acquisitions momentum is likely to intensify as adjacent insulation majors license technology rather than commit to greenfield mills, consolidating know-how and accelerating product approvals in new geographies.
Wood Fiber Insulation Industry Leaders
-
STEICO SE
-
Gutex Holzfaserplattenwerk H. Henselmann GmbH + Co. KG
-
TimberHP
-
Knauf Insulation
-
Soprema
- *Disclaimer: Major Players sorted in no particular order
Wood Fiber Insulation Market Companies Covered in this Report
- Beltermo
- BISCHOFF SCHAFER Holz GmbH
- DIEFFENBACHER GmbH
- EWI Pro Insulation Systems Ltd
- Gutex Holzfaserplattenwerk H. Henselmann GmbH + Co. KG
- ISOCELL GmbH & Co KG
- Kingspan Group
- Knauf Insulation
- Swiss Krono
- LIGNOTREND GmbH & Co. KG.
- Lime Green Products Ltd
- Schneider GmbH
- Soprema
- STEICO SE
- TimberHP
Market Opportunities and Future Outlook
Whole-life carbon accounting and low-carbon construction rules are creating more specification-driven whitespace for wood fiber insulation in both new build and retrofit, especially where compliance workflows require traceable, documented environmental performance. Finland implemented mandatory low-carbon construction calculations at the start of 2026, which reinforces demand for products supported by verified EPDs and gives procurement teams and designers a way to compare insulation options using embodied-carbon metrics rather than thermal performance alone.
For North America, the near-term opportunity concentrates on capacity build-out, code acceptance, and go-to-market partnerships, since adoption is constrained by installer familiarity and approval pathways in some provinces and states. In April 2026, TimberHP secured a strategic investment from FTAI Infrastructure to accelerate production ramp-up at its Madison, Maine facility and expand its commercial footprint, reflecting active capital deployment to localize supply and reduce dependence on imported boards. The May 2026 Ontario roadmap also highlighted the practical gap between demand drivers and code recognition, pointing to product testing, alternative-solution pathways, and installer training as immediate levers for accelerating penetration while meeting performance and safety requirements.
Recent Industry Developments in Wood Fiber Insulation Market
- July 2026: STEICO SE - Released its Half-Year Report 2026, confirming that revenue growth guidance of -2% to +4% despite supply chain and cost pressures. The report frames how margins and demand trends could influence pricing and capacity utilization for wood fiber insulation. It also provides an outlook that helps set STEICO's near-term strategic priorities in Europe and adjacent markets.
- June 2026: STEICO SE - MillSIGHTS analytics implemented at LVL mill in Poland to optimize production yield and ensure traceability. The deployment shows adoption of production analytics within the wood fiber insulation value chain. It supports efficiency gains, quality control, and data-driven decision making across operations.
- May 2026: Schilliger Holz - First wood fibre insulation board produced at new Lignatherm facility in Küssnacht am Rigi (May 21). The launch expands European production capacity for wood fiber insulation. It points to a regional scale-up and shifts competitive dynamics in the premium wood fiber insulation segment.
Wood Fiber Insulation Market Report Scope and Research Methodology
Market Definition and Coverage
This market is defined as the value of wood fiber based insulation materials sold for building thermal and acoustic insulation, counted at the point of manufacturer sales into construction and renovation channels, across the major regions.
Scope exclusions: We exclude installed labor, fasteners and membranes, and broader building-envelope services that sit outside wood fiber insulation product revenue.
Segments Covered in This Report
- By Product Form
- Rigid Boards
- Flexible Batts
- Loose-Fill / Dense-Pack
- Composite and Hybrid Panels
- By Application
- Thermal Insulation
- Acoustic Insulation
- Electrical / Fire-Protection Linings
- By End-User Industry
- Residential
- Commercial
- Institutional
- Industrial and Infrastructure
- By Geography
- Asia-Pacific
- China
- Japan
- India
- South Korea
- Australia and New Zealand
- Rest of Asia-Pacific
- North America
- United States
- Canada
- Mexico
- Europe
- Germany
- United Kingdom
- France
- Italy
- Rest of Europe
- South America
- Brazil
- Argentina
- Rest of South America
- Middle East and Africa
- Saudi Arabia
- United Arab Emirates
- South Africa
- Nigeria
- Rest of Middle-East and Africa
- Asia-Pacific
Data Sources, Market Sizing, and Validation
Desk Research
Desk research was used to set the factual foundation around construction activity and insulation demand signals, then to keep assumptions consistent across regions. We reviewed public statistics on building starts, renovation activity, and energy efficiency policy direction as the main demand drivers for insulation.
Sources were taken from reputable public bodies and technical references, including the International Energy Agency (buildings and energy efficiency), Eurostat (construction output and permits), the US Energy Information Administration (energy prices that influence retrofit payback), the US Census Bureau (construction spending), and UN Comtrade (trade flows for related material categories). We also used company annual reports and investor presentations for capacity additions and product mix direction, plus a paid subscription for company financials and news, and a patent database to identify recurring material and process innovation themes. These examples are not exhaustive, and additional sources were used to support data collection, validation, and clarification during the study.
Primary Interviews and Surveys
Primary work focused on validating what is actually shipped and specified, especially where public statistics do not cleanly separate wood fiber insulation from other fiber products. We interviewed manufacturers, distributors, installers, and building specifiers across major regions to confirm typical selling prices, channel splits, and which applications are gaining share.
To close gaps, we tested assumptions on moisture management requirements, code-driven demand, and retrofit versus new-build mix, then rechecked any large variances during modeling before finalizing totals.
Distribution of primary research fieldwork respondents
| Company type | Respondent position | Region |
|---|---|---|
| Top tier: 30% | CXOs: 15% | APAC: 39% |
| Mid tier: 54% | Functional/Unit leaders: 32% | EMEA: 36% |
| Smaller Players: 16% | Managers: 53% | Americas: 25% |
Market-Sizing & Forecasting
The sizing starts from a top-down build where construction output, renovation intensity, and insulation adoption are used to reconstruct the addressable demand pool for wood fiber insulation by region, then translated into value using region-appropriate price bands. Once that structure was set, selective bottom-up checks were added, such as supplier revenue sanity checks, channel feedback on shipment momentum, and sampled price benchmarks (per cubic meter or per square meter) for common product formats.
Inputs used in the model include the new-build versus retrofit share, wall and roof insulation uptake in key climate zones, building energy-code tightening pace, trade and cross-border supply availability, and average selling price movement linked to wood feedstock and energy costs. Where a country-level data series was missing, proxy indicators were applied from nearby markets with similar code stringency and construction practices, then corrected through interview feedback.
For forecasting, we used scenario analysis supported by an exponential smoothing layer on near-term demand indicators, and then reconciled the outputs with expert views on retrofit incentives, public procurement rules, and manufacturing capacity additions. Assumptions were kept traceable so that changes in one driver, such as renovation subsidy timing, can be directly seen in the final market number.
Data Validation & Update Cycle
Validation is done through several cross-checks so the final market totals do not rely on a single series or a single viewpoint. Model outputs are compared with independent signals such as construction spending trends, insulation import patterns, and manufacturer commentary on utilization and order books, then reviewed for logical fit.
If an outlier appears, we revisit country assumptions, redo the price and mix checks, and then re-contact selected interviewees to confirm what changed and why. A multi-step internal review is followed before sign-off so major arithmetic or scope errors are caught early. Reports are refreshed annually, with interim updates when material events occur, and a final pre-delivery pass is completed so clients receive the latest updated view.
Mordor Intelligence's Wood Fiber Insulation Market Size Compared With Other Published Estimates
It is common to see different market sizes for wood fiber insulation because publishers do not always use the same product boundary, selling level, and time window. Differences in whether installed value is included, how hybrid boards are treated, and how regional pricing is converted into USD can all move the final number.
By tracking application-level demand indicators and refreshing the price bands used in the model, Mordor Intelligence keeps the wood fiber insulation total tied to product revenue and avoids mixing in broader envelope materials that are sometimes bundled in construction quotes.
Benchmark comparison
| Source | Market Size | Gaps in Research Methodology |
|---|---|---|
| Mordor Intelligence | USD 0.93 B (2025) | |
| Global Consultancy A | USD 1.40 B (2025) | This estimate appears to use a wider scope that can fold in adjacent natural fiber insulation categories or installed-value elements, which lifts totals when project-level pricing is used instead of product-only revenue. |
| Trade Journal B | USD 1.00 B (2025) | This number is closer in level but tends to rely on a narrower product interpretation (for example, focusing on boards) and may apply a single blended ASP across regions, which can understate higher-priced markets and overstate lower-priced ones. |
Overall, the spread mainly comes from scope boundaries and the way prices and mix are carried across regions. Our approach keeps the model repeatable by using clear demand drivers, practical pricing checks, and targeted expert validation so the final market size stays consistent year to year.
Key Questions Answered in the Report
How large is the global wood fiber insulation market and what value is expected by 2031?
Global outlay is estimated to reach USD 0.99 billion in 2026 and is projected to climb to USD 1.34 billion by 2031, reflecting a 6.25% CAGR.
Which geographic region is growing fastest for wood fiber insulation deployments?
Asia-Pacific leads in growth with a 6.19% forecast CAGR for 2026-2031, driven by tightening energy codes and incentive programs.
Why do builders favor rigid wood fiber boards for new-build envelopes?
Rigid boards provide dimensional stability, double as structural sheathing, and meet vapor-open requirements that simplify continuous-insulation assemblies.
What policy measures are accelerating the use of wood fiber insulation in public projects?
Buy Clean rules and embodied-carbon thresholds now make low-carbon materials a pass-fail criterion in bids, giving wood fiber an edge due to its negative cradle-to-gate footprint.
How does wood fiber insulation compare to mineral wool on carbon impact and upfront cost?
Wood fiber carries a negative carbon footprint but still costs 10-20% more delivered than commodity mineral wool in regions lacking carbon-based subsidies.
Which companies hold the largest production capacity for wood fiber insulation?
Leading producers include STEICO, Gutex, Pavatex (Soprema), and TimberHP, and Knauf Insulation together the top five account for roughly 60% of European and 35% of North American capacity.