Vietnam Data Center Market Size and Share
Market Overview
| Study Period | 2020 - 2031 |
|---|---|
| Forecast Data Period | 2026 - 2031 |
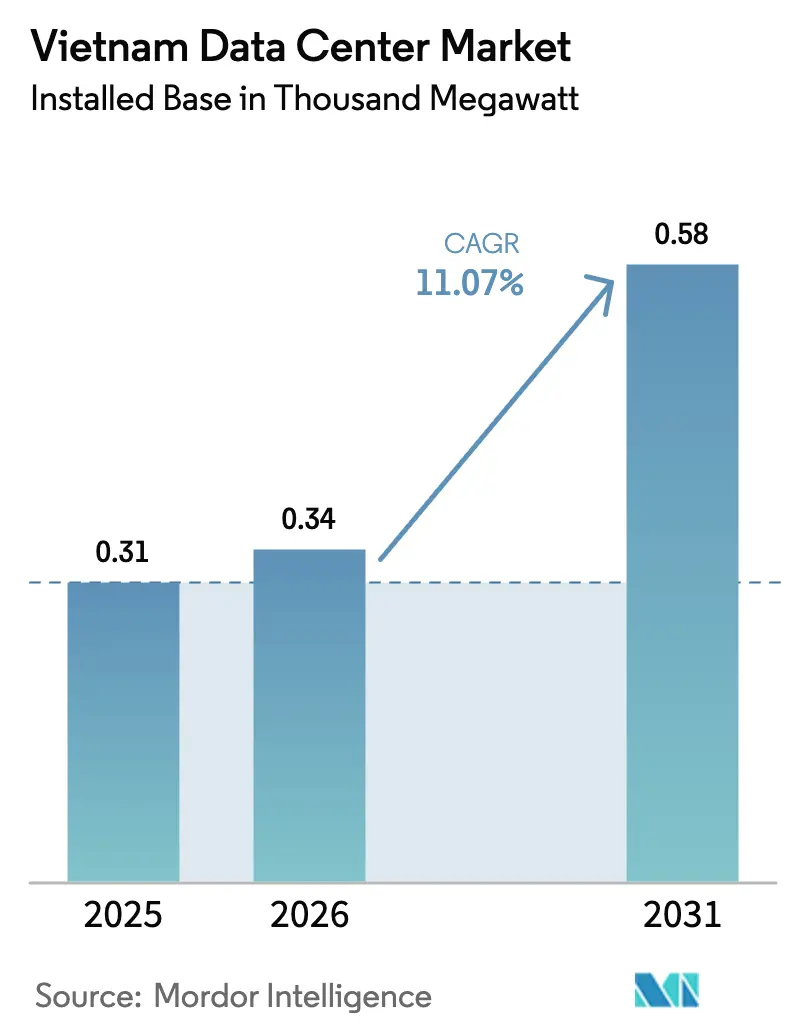
| Base Year Market Size (2025) | 0.31 Thousand megawatt |
| Market Volume (2026) | 0.34 Thousand megawatt |
| Market Volume (2031) | 0.58 Thousand megawatt |
| Growth Rate (2026 - 2031) | 11.07% CAGR |
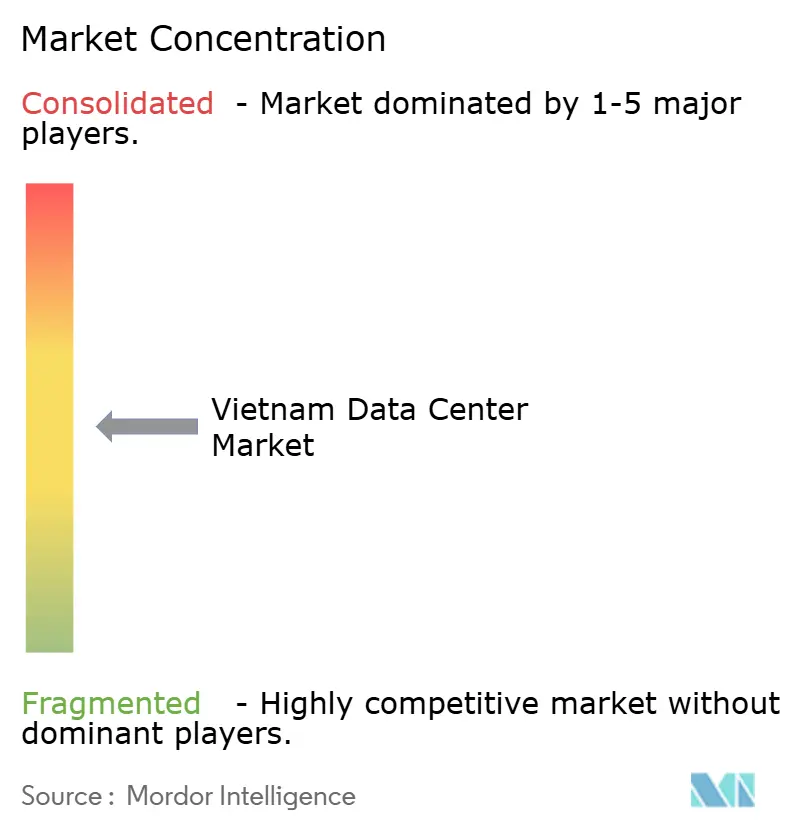
| Market Concentration | Medium |
Major Players *Disclaimer: Major Players sorted in no particular order Image © Mordor Intelligence. Reuse requires attribution under CC BY 4.0. | |
Vietnam Data Center Market Analysis by Mordor Intelligence
The Vietnam data center market size in terms of installed base was valued at 0.31 thousand megawatt in 2025 and is estimated to grow from 0.34 thousand megawatt in 2026 to reach 0.58 thousand megawatt by 2031, at a CAGR of 11.07% during the forecast period (2026-2031). Robust digital-transformation spending by enterprises, data-localization mandates, and the removal of foreign-ownership caps are accelerating facility builds in Hanoi and Ho Chi Minh City. Renewable-energy power-purchase agreements are beginning to offset grid-tariff volatility, while modular, prefabricated designs are shortening construction cycles and keeping capital intensity in check. Rising AI and 5G traffic is pushing average rack densities beyond 20 kW, nudging operators toward liquid cooling and Tier 4 power redundancy.
Key Report Takeaways
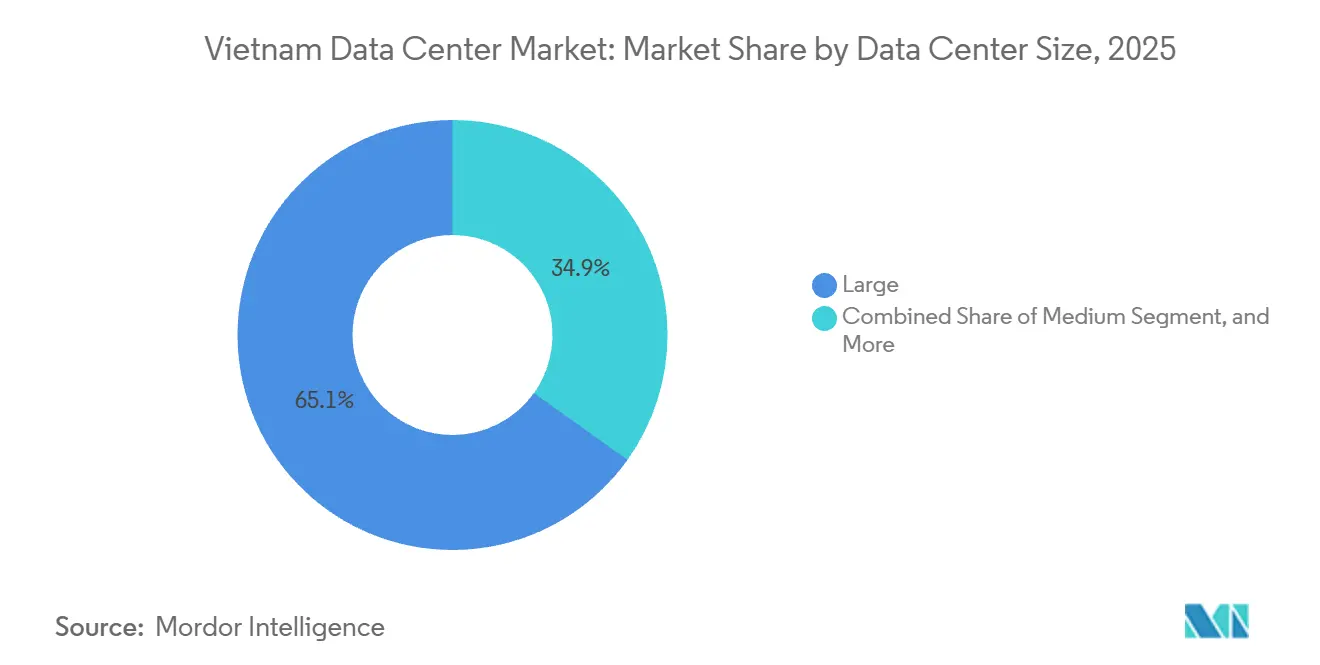
- By data-center size, large facilities led with 65.14% of the Vietnam data center market share in 2025, whereas medium facilities are projected to expand at a 12.32% CAGR through 2031.
- By tier type, tier 3 captured 78.15% of the Vietnam data center market in 2025, while tier 4 is advancing at a 12.43% CAGR to 2031.
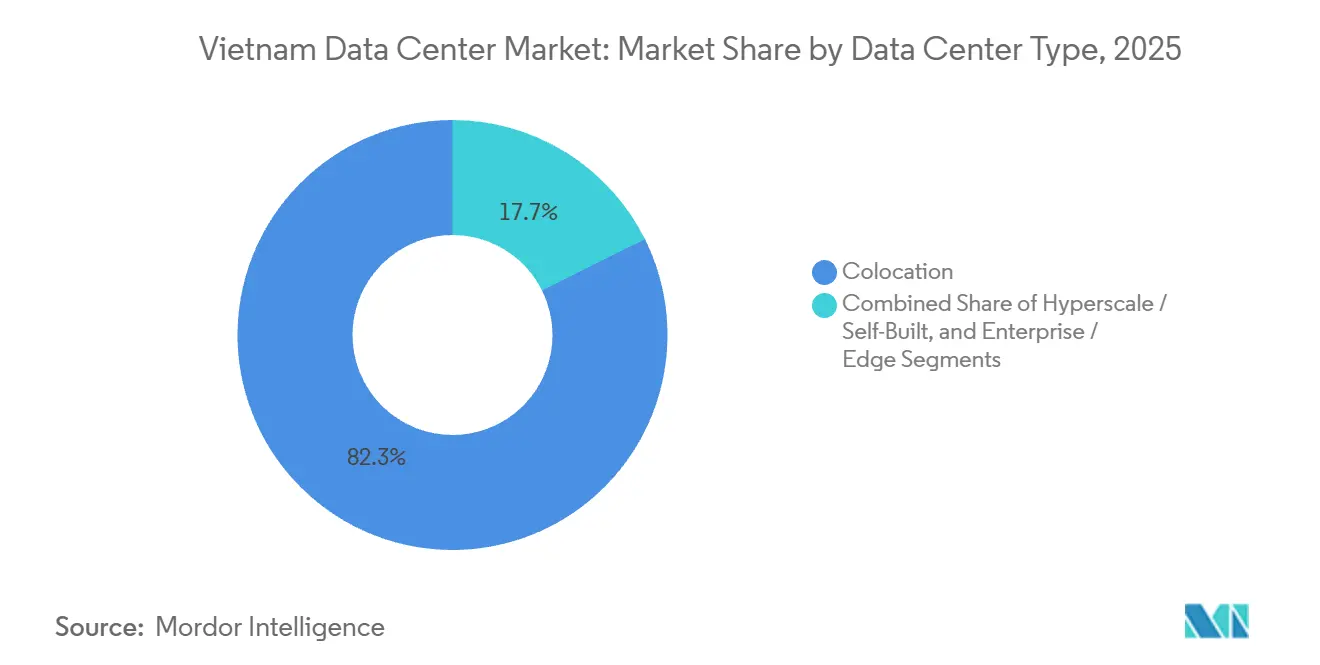
- By data center type, colocation accounted for 82.35% of the Vietnam data center market in 2025, yet hyperscale self-built sites are forecast to post a 12.62% CAGR through 2031.
- By end user, the IT and ITES segment held 55.26% of the Vietnam data center market in 2025, whereas BFSI is recording the highest projected CAGR at 13.59% through 2031.
- By hotspot, Ho Chi Minh City accounted for 46.29% of installed capacity in 2025; Hanoi is set to grow at a 12.58% CAGR between 2026-2031.
Note: Market size and forecast figures in this report are generated using Mordor Intelligence’s proprietary estimation framework, updated with the latest available data and insights as of January 2026.
Vietnam Data Center Market Trends and Insights
Drivers Impact Analysis*
| Driver | (~) % Impact on CAGR Forecast | Geographic Relevance | Impact Timeline |
|---|---|---|---|
| Data-Localization Mandates Under Decree 53/2022 | +2.8% | National, centered on Hanoi and Ho Chi Minh City | Medium term (2-4 years) |
| Foreign-Ownership Cap Removal Attracting Hyperscale FDI | +2.5% | Ho Chi Minh City and Binh Duong Province | Short term (≤ 2 years) |
| Rapid 5G Rollout and Mobile-Data Growth | +1.9% | Urban cores nationwide | Medium term (2-4 years) |
| Rising AI-Driven High-Density Workloads | +1.6% | Ho Chi Minh City, Hanoi, and Da Nang | Long term (≥ 4 years) |
| E-Commerce Expansion and Cloud-Service Adoption | +1.2% | National, highest in first-tier cities | Short term (≤ 2 years) |
| Renewable-Energy PPAs Unlocking Green Power | +0.7% | Coastal provinces with wind-and-solar clusters | Medium term (2-4 years) |
| Source: Mordor Intelligence | |||


Data-Localization Mandates Under Decree 53/2022
Decree 53/2022 obliges foreign cloud providers to store Vietnamese users' data on local servers, prompting commitments from AWS and Microsoft to launch in-country availability zones.[1]Ministry of Information and Communications, “Decree 53/2022 on Data Localization,” mic.gov.vnAnnual audits by the Authority of Information Security reinforce compliance, and non-adherence risks service suspension beyond the VND 50-100 million fines. Hyperscalers are therefore leasing wholesale suites while parallel self-build plans mature, fragmenting cross-border disaster-recovery architectures that once leaned on Singapore or Hong Kong.
Foreign-Ownership Cap Removal Attracting Hyperscale FDI
The July 2024 abolition of Vietnam’s 50% foreign-ownership ceiling allows hyperscale operators to hold land, power contracts, and network gateways outright.[2]U.S.-ASEAN Business Council, “Vietnam Telecommunications Investment Climate Report,” usasean.orgEquinix’s USD 150 million greenfield in Binh Duong and Digital Realty’s exploratory 50 MW Hanoi campus exemplify the capital inflow. Direct participation in the wholesale power market trims the total cost of ownership by 12%-18% over a decade.
Rapid 5G Rollout and Mobile-Data Growth
VNPT, Viettel, and MobiFone had installed more than 25,000 5G base stations by end-2025, covering 95% of urban districts and boosting average monthly smartphone data consumption to 18 GB per user.[3]Viettel Group, “5G Network Expansion,” vietteltelecom.vnVideo streaming and real-time gaming workloads are driving demand for micro-data centers at tower and metro aggregation sites, a trend underscored by Viettel’s plan to deploy 200 edge facilities by 2027. The Ministry of Information and Communications mandates that operators achieve 99% urban population coverage by 2027, accelerating small-cell densification and fiber backhaul upgrades. Edge nodes sized at 100-500 kW are projected to add roughly 60 MW of incremental IT load nationwide by 2031 as augmented-reality retail and autonomous-vehicle pilots move from trials to commercial rollout.
Rising AI-Driven High-Density Workloads
FPT’s Vietnamese-language large-language-model training and VNG Cloud’s GPU clusters require rack densities exceeding 20 kW. Export controls on NVIDIA A100 and H100 silicon divert operators toward A800, H800, or AMD MI250 chips, elongating lead times to 26 weeks and inflating unit costs by 35%. Liquid-cooling pilots with rear-door heat exchangers are therefore gaining favor, squeezing PUE below 1.3. Early tests show direct-to-chip cold plates cut water use by 30%, easing compliance with Hanoi’s drought-season caps. Operators estimate these retrofits can unlock an extra 4 MW of usable IT load per hall without enlarging switchgear footprints.
Restraints Impact Analysis*
| Restraint | (~) % Impact on CAGR Forecast | Geographic Relevance | Impact Timeline |
|---|---|---|---|
| Power-Supply Instability and Grid Congestion | -1.8% | Hanoi, Ho Chi Minh City, and adjoining industrial belts | Short term (≤ 2 years) |
| U.S. Export-Control Limits on Advanced GPUs | -1.3% | Ho Chi Minh City and Hanoi | Medium term (2-4 years) |
| Limited Submarine-Cable Redundancy | -0.9% | Coastal landing points, nationwide knock-on effects | Medium term (2-4 years) |
| Pending Liquid-Cooling Regulations | -0.6% | New builds nationwide | Short term (≤ 2 years) |
| Skilled-Workforce Shortages Outside Tier-1 Cities | -0.5% | Da Nang, Can Tho, Hai Phong | Long term (≥ 4 years) |
| Source: Mordor Intelligence | |||
Power-Supply Instability and Grid Congestion
Peak demand reached 72,000 MW in July 2025, versus 76,000 MW installed capacity, leaving a razor-thin reserve margin. Brownouts totaling 18 hours in August 2025 forced reliance on diesel generators, adding USD 0.08 per kWh to operating costs. Pending LNG and offshore-wind projects under Power Development Plan VIII remain hampered by permitting delays. EVN is now asking new data center applicants to self-fund 110 kV substations that cost USD 8-12 million each, a hurdle that pushes payback periods beyond 7 years. Operators are also piloting virtual power plant contracts pairing rooftop solar with lithium-ion batteries, but these hybrids cover less than 5% of critical load during multi-hour outages.
U.S. Export-Control Limits on Advanced GPUs
Performance thresholds imposed in October 2023 require exporter licenses for NVIDIA’s high-end accelerators, stretching procurement from eight to 26 weeks and prompting a two-tier AI-infrastructure market. Domestic operators reliant on A800 or AMD substitutes lag hyperscalers that can route inference from foreign clusters, eroding the localization benefits sought by Decree 53/2022. Spot prices for A100 80 GB cards escalated to USD 25,000 in 2025, up from USD 15,000 in 2023, compressing return-on-investment calculations for private GPU farms. As a result, FPT and VNG postponed planned generative-AI service launches by two quarters, deferring related revenue into late 2026.
*Our forecasts treat driver/restraint impacts as directional, not additive. The impact forecasts reflect baseline growth, mix effects, and variable interactions.
Segment Analysis
By Data Center Size: Medium Facilities Gain Traction
Medium-sized plants, defined as 5-20 MW, are projected to expand at a 12.32% CAGR through 2031, outpacing the Vietnam data center market. Prefabricated power modules and cooling skids trim build times below 12 months and align phased capacity with demand spikes. Large sites retained 65.14% of the Vietnam data center market share in 2025, serving hyperscale leases of 10 MW or more. Lenders view the mid-scale format favorably because shorter construction windows reduce interest during construction outlays and accelerate revenue recognition, thereby improving project finance metrics. Many operators now bundle remote-hands services with these builds, catering to regional enterprises that lack on-site IT staff.
Secondary cities such as Da Nang and Can Tho offer land priced 40%-50% lower than Ho Chi Minh City, prompting FPT Telecom’s three-site rollout that cuts colocation tariffs by 20%. Liquid-cooling advances permit 20 kW racks in the tropics, lowering PUE below 1.3 and making modular 10 MW halls a cost-effective hedge against power-grid bottlenecks. Municipal authorities also waive connective-road fees for digital-infrastructure projects, shaving a further 3%-4% off up-front capex. Local universities are partnering with operators to create talent pipelines, easing concerns about engineering shortages outside tier-1 cities.


By Tier Type: Tier 4 Adoption Accelerates
Tier 3 dominated with 78.15% capacity in 2025, yet Tier 4 facilities are poised to grow at a 12.43% CAGR through 2031 as BFSI and e-commerce workloads demand 99.995% uptime. State Bank of Vietnam Circular 35/2020 mandates concurrent maintainability for core banking, pushing banks such as Vietcombank to Tier 4 colocation, which slashed annual downtime to under 26 minutes. Rising cyber-resilience standards from global payment networks further incentivize operators to layer in dual-availability-zone architectures. Consequently, campus designs increasingly reserve shell space for a second Tier 4 hall that can be brought online within 18 months.
Although Tier 4 commands a 30%-40% capital premium, proximity to financial districts in Hanoi and Ho Chi Minh City justifies the investment. Insurance and securities brokers must also meet the Ministry of Finance recovery objectives, with recovery time under 4 hours and channeling workloads to 2N+1 plants with dual-grid feeds. Automation offsets some of the added cost, with AI-driven building management systems trimming about 5% from annual energy costs. Operators are also structuring availability-based service-level agreements that share outage-penalty risk, making Tier 4 contracts more palatable for price-sensitive customers.
By Data Center Type: Hyperscale Self-Built Gains Momentum
Colocation accounted for 82.35% of the Vietnam data center market in 2025, but hyperscale self-builds are projected to grow at a 12.62% CAGR. AWS’s three-building, 60 MW Ho Chi Minh City campus and Microsoft’s planned Hanoi site underscore the pivot to sovereign capacity. The July 2024 rule change that removed foreign-ownership caps lets these firms buy land outright and pledge it as collateral, unlocking lower-cost, foreign-currency debt. Hyperscalers also avoid cross-connect fees by operating on-premises Internet exchanges, saving millions of USD in network charges annually.
Self-builds let cloud platforms tune cooling for 20 kW-plus racks and negotiate direct renewable-energy PPAs that shave 15%-20% off electricity charges. Colocation operators respond with interconnection fabrics and managed-security overlays to defend margins as wholesale prices soften. Several have introduced “build-to-suit then convert” models, giving hyperscalers an option to purchase the hall outright after a five-year lease. At the edge, telecom-tower landlords are trialing micro-modules under 250 kW, anticipating back-haul synergies with their fiber assets.
By End User: BFSI Leads Growth Trajectory
BFSI workloads are set to expand at 13.59% CAGR, the fastest among end users, fueled by real-time payments on the NAPAS rail and cloud-based core banking overhauls. IT and ITES, while still commanding 55.26% of installed capacity in 2025, are leveling off as outsourcing firms migrate non-critical workloads to the public cloud. New fintech entrants offering buy-now-pay-later and digital-wallet services amplify transaction peaks, further stretching Tier 4 demand. Embedded-finance APIs also require low-latency data-exchange hubs, reinforcing the sector’s appetite for colocation.
Techcombank’s USD 80 million hybrid-cloud migration illustrates the sector’s tilt toward Tier 4 colocation to achieve sub-100-millisecond mobile-banking latency. Meanwhile, e-commerce giants drive edge-node deployments to sustain real-time inventory and checkout flows, and government agencies align with the Digital Transformation Program target of 20 MW incremental sovereign load by 2028. Content-streaming studios and media houses are following suit, booking smaller 500 kW suites for transcoding workloads that must stay within national borders. This cross-vertical mix helps operators diversify tenant exposure and stabilize occupancy rates.
Geography Analysis
Ho Chi Minh City maintained 46.29% capacity in 2025, leveraging submarine-cable clusters in Vung Tau that deliver sub-50-millisecond latency to Singapore. However, summer 2025 grid overloads delayed new rack turn-ups and nudged expansions toward Long An and Ba Ria-Vung Tau, where land costs run 30% lower. Binh Duong now houses a 30 MW ST Telemedia campus and a 25 MW NTT-VNPT-GDS joint venture. Developers are lobbying EVN for priority-load status to secure faster substation sign-offs, but final approvals still average 9 months. Some projects include community-solar carve-outs to improve permit optics with provincial authorities.
Hanoi is forecast to grow at a 12.58% CAGR over 2026-2031, benefiting from land at USD 150 per m² in Hoa Lac Hi-Tech Park and a 400 Gbps VNPT backbone that cuts latency to the south to under 8 milliseconds. Government incentives, including four-year tax holidays under Decree 218/2013, attract Equinix and Digital Realty, while sovereign-cloud policies ring-fence demand for classified workloads. The city’s tertiary-education cluster graduates over 15,000 IT engineers annually, easing staffing challenges for 24×7 operations. Planned metro-rail extensions will further shorten commute times to the western data center corridor.
The rest of Vietnam tracks the broader market, with Da Nang riding the Asia Direct Cable landing for sub-30-millisecond links to Hong Kong. FPT’s modular 10 MW build in Da Nang, Hai Phong’s IoT-driven manufacturing edge nodes, and Can Tho’s disaster-recovery pull set the stage for a distributed, latency-optimized mesh that balances power and land availability. Local governments bundle digital-tax incentives with long-term leases to lure operators, while smart-city pilots in Hue and Quy Nhon hint at the next wave of micro-edge demand.
Competitive Landscape
Vietnam’s competitive field is moderately fragmented. State-owned carriers, including Vietnam Posts and Telecommunications Group, Viettel, and VNPT, operate legacy Tier 2-3 assets serving domestic ministries. Global colocation leaders, namely ST Telemedia Global Data Centres, NTT Communications, and Equinix, are scaling wholesale footprints through joint ventures and, post-2024, wholly owned subsidiaries. Regional telcos like Singtel and True Online are also assessing market entry via minority stakes, signaling that consolidation may accelerate over the next two years.
Hyperscale providers now favor self-builds to secure tailored cooling, 2N power, and renewable-energy contracts, compressing wholesale lease rates. Operators that clinch direct wind or solar PPAs enjoy 15%-20% electricity savings, a decisive edge in multi-megawatt bids. Interconnection density is the other battleground; meet-me rooms with five or more submarine-cable systems command premiums from latency-sensitive traders and streamers. Several players are courting satellite-ground-station tenants to diversify carrier mix and differentiate cross-border traffic paths.
Niche players such as Eco Data Center Services and Universal Smart Data Center Technology pursue the disaster-recovery and regional-edge segments by offering 40%-50% discounts compared to metro-core racks. Yet bundling of cross-region backup by hyperscalers narrows that addressable pool, pushing independents toward specialized managed-service overlays or acquisition exits. A tightening labor market adds pressure, prompting smaller firms to form shared-operations alliances that pool network-operations-center staff on a 24×7 rota.
Vietnam Data Center Industry Leaders
Vietnam Posts and Telecommunications Group
Viettel – CHT Company Limited
FPT Telecom International Co. Ltd.
CMC Telecommunications Infrastructure JSC
ST Telemedia Global Data Centres Vietnam Ltd.
- *Disclaimer: Major Players sorted in no particular order

Recent Industry Developments
- January 2026: Equinix unveiled a USD 150 million, 10 MW greenfield in Binh Duong with Platform Equinix fabric and 30 MW expansion headroom.
- December 2025: Viettel committed VND 5 trillion (USD 200 million) to roll out 200 edge sites with Schneider Electric liquid-cooling modules by 2027.
- November 2025: FPT Telecom set aside VND 3 trillion (USD 120 million) for three 10 MW modular centers in Da Nang, Hai Phong, and Can Tho, completing by mid-2027.
- October 2025: Techcombank earmarked VND 2 trillion (USD 80 million) for an 80% hybrid-cloud migration into Tier 4 colocation by 2028.


Vietnam Data Center Market Report Scope
The data center market encompasses the infrastructure, services, and technologies that support the storage, management, and processing of data. This market includes various data center sizes, tier classifications, types, end-user industries, and hotspots, reflecting the diverse needs of businesses and organizations operating in the country.
The Vietnam Data Center Market Report is Segmented by Data Center Size (Small, Medium, Large, and Hyperscale), Tier Type (Tier 1 and 2, Tier 3, and Tier 4), Data Center Type (Hyperscale/Self-Built, Enterprise/Edge, and Colocation), End User (BFSI, IT and ITES, E-Commerce, Government, Manufacturing, Media and Entertainment, Telecom, and Other End Users), and Hotspot (Hanoi, Ho Chi Minh City, and Rest of Vietnam). The Market Forecasts are Provided in Terms of IT Load Capacity (Megawatt).
| Small |
| Medium |
| Large |
| Hyperscale |
| Tier 1 and 2 |
| Tier 3 |
| Tier 4 |
| Hyperscale / Self-Built | ||
| Enterprise / Edge | ||
| Colocation | Non-Utilized | |
| Utilized | Retail Colocation | |
| Wholesale Colocation | ||
| BFSI |
| IT and ITES |
| E-Commerce |
| Government |
| Manufacturing |
| Media and Entertainment |
| Telecom |
| Other End Users |
| Hanoi |
| Ho Chi Minh City |
| Rest of Vietnam |
| By Data Center Size | Small | ||
| Medium | |||
| Large | |||
| Hyperscale | |||
| By Tier Type | Tier 1 and 2 | ||
| Tier 3 | |||
| Tier 4 | |||
| By Data Center Type | Hyperscale / Self-Built | ||
| Enterprise / Edge | |||
| Colocation | Non-Utilized | ||
| Utilized | Retail Colocation | ||
| Wholesale Colocation | |||
| By End User | BFSI | ||
| IT and ITES | |||
| E-Commerce | |||
| Government | |||
| Manufacturing | |||
| Media and Entertainment | |||
| Telecom | |||
| Other End Users | |||
| By Hotspot | Hanoi | ||
| Ho Chi Minh City | |||
| Rest of Vietnam | |||


Market Definition
- IT LOAD CAPACITY - The IT load capacity or installed capacity, refers to the amount of energy consumed by servers and network equipments placed in a rack installed. It is measured in megawatt (MW).
- ABSORPTION RATE - It denotes the extend to which the data center capacity has been leased out. For instance, a 100 MW DC has leased out 75 MW, then absorption rate would be 75%. It is also referred as utilization rate and leased-out capacity.
- RAISED FLOOR SPACE - It is an elevated space build over the floor. This gap between the original floor and the elevated floor is used to accommodate wiring, cooling, and other data center equipment. This arrangement assist in having proper wiring and cooling infrastructure. It is measured in square feet (ft^2).
- DATA CENTER SIZE - Data Center Size is segmented based on the raised floor space allocated to the data center facilities. Mega DC - # of Racks must be more than 9000 or RFS (raised floor space) must be more than 225001 Sq. ft; Massive DC - # of Racks must be in between 9000 and 3001 or RFS must be in between 225000 Sq. ft and 75001 Sq. ft; Large DC - # of Racks must be in between 3000 and 801 or RFS must be in between 75000 Sq. ft and 20001 Sq. ft; Medium DC # of Racks must be in between 800 and 201 or RFS must be in between 20000 Sq. ft and 5001 Sq. ft; Small DC - # of Racks must be less than 200 or RFS must be less than 5000 Sq. ft.
- TIER TYPE - According to Uptime Institute the data centers are classified into four tiers based on the proficiencies of redundant equipment of the data center infrastructure. In this segment the data center are segmented as Tier 1,Tier 2, Tier 3 and Tier 4.
- COLOCATION TYPE - The segment is segregated into 3 categories namely Retail, Wholesale and Hyperscale Colocation service. The categorization is done based on the amount of IT load leased out to potential customers. Retail colocation service has leased capacity less than 250 kW; Wholesale colocation services has leased capacity between 251 kW and 4 MW and Hyperscale colocation services has leased capacity more than 4 MW.
- END CONSUMERS - The Data Center Market operates on a B2B basis. BFSI, Government, Cloud Operators, Media and Entertainment, E-Commerce, Telecom and Manufacturing are the major end-consumers in the market studied. The scope only includes colocation service operators catering to the increasing digitalization of the end-user industries.
| Keyword | Definition |
|---|---|
| Rack Unit | Generally referred as U or RU, it is the unit of measurement for the server unit housed in the racks in the data center. 1U is equal to 1.75 inches. |
| Rack Density | It defines the amount of power consumed by the equipment and server housed in a rack. It is measured in kilowatt (kW). This factor plays a critical role in data center design and, cooling and power planning. |
| IT Load Capacity | The IT load capacity or installed capacity, refers to the amount of energy consumed by servers and network equipment placed in a rack installed. It is measured in megawatt (MW). |
| Absorption Rate | It denotes how much of the data center capacity has been leased out. For instance, if a 100 MW DC has leased out 75 MW, then the absorption rate would be 75%. It is also referred to as utilization rate and leased-out capacity. |
| Raised Floor Space | It is an elevated space built over the floor. This gap between the original floor and the elevated floor is used to accommodate wiring, cooling, and other data center equipment. This arrangement assists in having proper wiring and cooling infrastructure. It is measured in square feet/meter. |
| Computer Room Air Conditioner (CRAC) | It is a device used to monitor and maintain the temperature, air circulation, and humidity inside the server room in the data center. |
| Aisle | It is the open space between the rows of racks. This open space is critical for maintaining the optimal temperature (20-25 °C) in the server room. There are primarily two aisles inside the server room, a hot aisle and a cold aisle. |
| Cold Aisle | It is the aisle wherein the front of the rack faces the aisle. Here, chilled air is directed into the aisle so that it can enter the front of the racks and maintain the temperature. |
| Hot Aisle | It is the aisle where the back of the racks faces the aisle. Here, the heat dissipated from the equipment’s in the rack is directed to the outlet vent of the CRAC. |
| Critical Load | It includes the servers and other computer equipment whose uptime is critical for data center operation. |
| Power Usage Effectiveness (PUE) | It is a metric which defines the efficiency of a data center. It is calculated by: (𝑇𝑜𝑡𝑎𝑙 𝐷𝑎𝑡𝑎 𝐶𝑒𝑛𝑡𝑒𝑟 𝐸𝑛𝑒𝑟𝑔𝑦 𝐶𝑜𝑛𝑠𝑢𝑚𝑝𝑡𝑖𝑜𝑛)/(𝑇𝑜𝑡𝑎𝑙 𝐼𝑇 𝐸𝑞𝑢𝑖𝑝𝑚𝑒𝑛𝑡 𝐸𝑛𝑒𝑟𝑔𝑦 𝐶𝑜𝑛𝑠𝑢𝑚𝑝𝑡𝑖𝑜𝑛). Further, a data center with a PUE of 1.2-1.5 is considered highly efficient, whereas, a data center with a PUE >2 is considered highly inefficient. |
| Redundancy | It is defined as a system design wherein additional component (UPS, generators, CRAC) is added so that in case of power outage, equipment failure, the IT equipment should not be affected. |
| Uninterruptible Power Supply (UPS) | It is a device that is connected in series with the utility power supply, storing energy in batteries such that the supply from UPS is continuous to IT equipment even during utility power is snapped. The UPS primarily supports the IT equipment only. |
| Generators | Just like UPS, generators are placed in the data center to ensure an uninterrupted power supply, avoiding downtime. Data center facilities have diesel generators and commonly, 48-hour diesel is stored in the facility to prevent disruption. |
| N | It denotes the tools and equipment required for a data center to function at full load. Only "N" indicates that there is no backup to the equipment in the event of any failure. |
| N+1 | Referred to as 'Need plus one', it denotes the additional equipment setup available to avoid downtime in case of failure. A data center is considered N+1 when there is one additional unit for every 4 components. For instance, if a data center has 4 UPS systems, then for to achieve N+1, an additional UPS system would be required. |
| 2N | It refers to fully redundant design wherein two independent power distribution system is deployed. Therefore, in the event of a complete failure of one distribution system, the other system will still supply power to the data center. |
| In-Row Cooling | It is the cooling design system installed between racks in a row where it draws warm air from the hot aisle and supplies cool air to the cold aisle, thereby maintaining the temperature. |
| Tier 1 | Tier classification determines the preparedness of a data center facility to sustain data center operation. A data center is classified as Tier 1 data center when it has a non-redundant (N) power component (UPS, generators), cooling components, and power distribution system (from utility power grids). The Tier 1 data center has an uptime of 99.67% and an annual downtime of <28.8 hours. |
| Tier 2 | A data center is classified as Tier 2 data center when it has a redundant power and cooling components (N+1) and a single non-redundant distribution system. Redundant components include extra generators, UPS, chillers, heat rejection equipment, and fuel tanks. The Tier 2 data center has an uptime of 99.74% and an annual downtime of <22 hours. |
| Tier 3 | A data center having redundant power and cooling components and multiple power distribution systems is referred to as a Tier 3 data center. The facility is resistant to planned (facility maintenance) and unplanned (power outage, cooling failure) disruption. The Tier 3 data center has an uptime of 99.98% and an annual downtime of <1.6 hours. |
| Tier 4 | It is the most tolerant type of data center. A Tier 4 data center has multiple, independent redundant power and cooling components and multiple power distribution paths. All IT equipment are dual powered, making them fault tolerant in case of any disruption, thereby ensuring interrupted operation. The Tier 4 data center has an uptime of 99.74% and an annual downtime of <26.3 minutes. |
| Small Data Center | Data center that has floor space area of ≤ 5,000 Sq. ft or the number of racks that can be installed is ≤ 200 is classified as a small data center. |
| Medium Data Center | Data center which has floor space area between 5,001-20,000 Sq. ft, or the number of racks that can be installed is between 201-800, is classified as a medium data center. |
| Large Data Center | Data center which has floor space area between 20,001-75,000 Sq. ft, or the number of racks that can be installed is between 801-3,000, is classified as a large data center. |
| Massive Data Center | Data center which has floor space area between 75,001-225,000 Sq. ft, or the number of racks that can be installed is between 3001-9,000, is classified as a massive data center. |
| Mega Data Center | Data center that has a floor space area of ≥ 225,001 Sq. ft or the number of racks that can be installed is ≥ 9001 is classified as a mega data center. |
| Retail Colocation | It refers to those customers who have a capacity requirement of 250 kW or less. These services are majorly opted by small and medium enterprises (SMEs). |
| Wholesale Colocation | It refers to those customers who have a capacity requirement between 250 kW to 4 MW. These services are majorly opted by medium to large enterprises. |
| Hyperscale Colocation | It refers to those customers who have a capacity requirement greater than 4 MW. The hyperscale demand primarily originates from large-scale cloud players, IT companies, BFSI, and OTT players (like Netflix, Hulu, and HBO+). |
| Mobile Data Speed | It is the mobile internet speed a user experiences via their smartphones. This speed is primarily dependent on the carrier technology being used in the smartphone. The carrier technologies available in the market are 2G, 3G, 4G, and 5G, where 2G provides the slowest speed while 5G is the fastest. |
| Fiber Connectivity Network | It is a network of optical fiber cables deployed across the country, connecting rural and urban regions with high-speed internet connection. It is measured in kilometer (km). |
| Data Traffic per Smartphone | It is a measure of average data consumption by a smartphone user in a month. It is measured in gigabyte (GB). |
| Broadband Data Speed | It is the internet speed that is supplied over the fixed cable connection. Commonly, copper cable and optic fiber cable are used in both residential and commercial use. Here, optic cable fiber provides faster internet speed than copper cable. |
| Submarine Cable | A submarine cable is a fiber optic cable laid down at two or more landing points. Through this cable, communication and internet connectivity between countries across the globe is established. These cables can transmit 100-200 terabits per second (Tbps) from one point to another. |
| Carbon Footprint | It is the measure of carbon dioxide generated during the regular operation of a data center. Since, coal, and oil & gas are the primary source of power generation, consumption of this power contributes to carbon emissions. Data center operators are incorporating renewable energy sources to curb the carbon footprint emerging in their facilities. |


Research Methodology
Mordor Intelligence follows a four-step methodology in all our reports.
- Step-1: Identify Key Variables: In order to build a robust forecasting methodology, the variables and factors identified in Step-1 are tested against available historical market numbers. Through an iterative process, the variables required for market forecast are set and the model is built on the basis of these variables.
- Step-2: Build a Market Model: Market-size estimations for the forecast years are in nominal terms. Inflation is not a part of the pricing, and the average selling price (ASP) is kept constant throughout the forecast period for each country.
- Step-3: Validate and Finalize: In this important step, all market numbers, variables and analyst calls are validated through an extensive network of primary research experts from the market studied. The respondents are selected across levels and functions to generate a holistic picture of the market studied.
- Step-4: Research Outputs: Syndicated Reports, Custom Consulting Assignments, Databases & Subscription Platforms


