UV LED Market Size and Share
Market Overview
| Study Period | 2020 - 2031 |
|---|---|
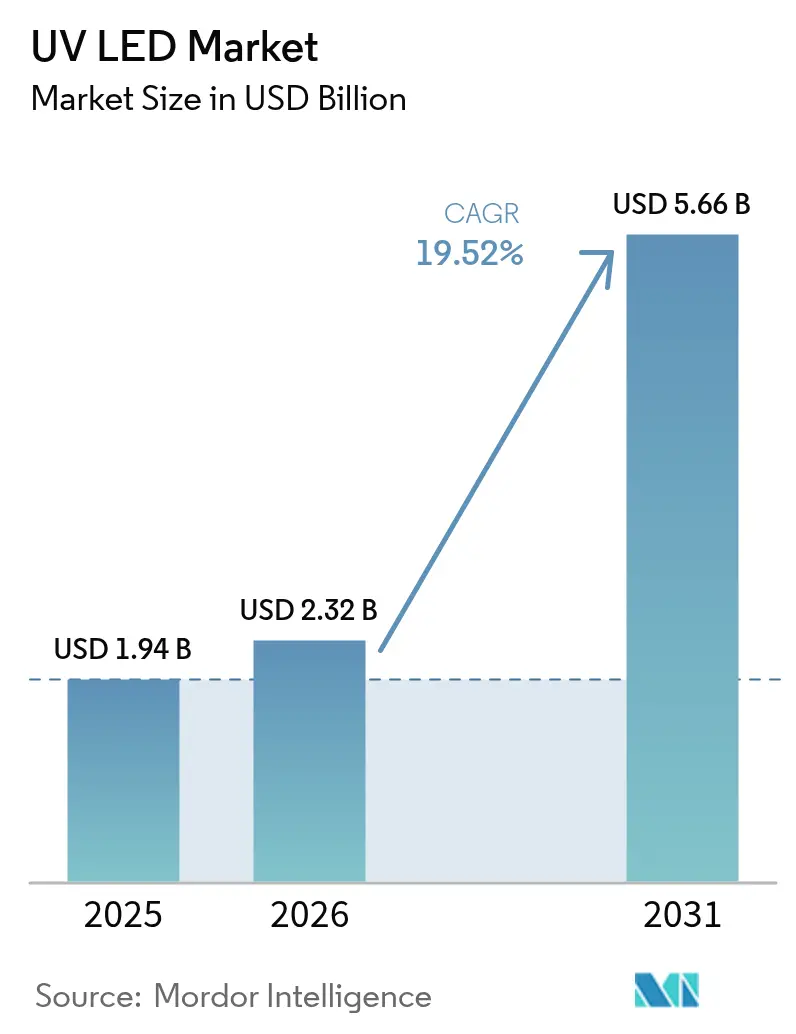
| Market Size (2026) | USD 2.32 Billion |
| Market Size (2031) | USD 5.66 Billion |
| Growth Rate (2026 - 2031) | 19.52% CAGR |
| Fastest Growing Market | Middle East and Africa |
| Largest Market | Asia Pacific |
| Market Concentration | Low |
Major Players
*Disclaimer: Major Players sorted in no particular order Image © Mordor Intelligence. Reuse requires attribution under CC BY 4.0. |
|
UV LED Market Analysis by Mordor Intelligence
UV LED market size in 2026 is estimated at USD 2.32 billion, growing from 2025 value of USD 1.94 billion with 2031 projections showing USD 5.66 billion, growing at 19.52% CAGR over 2026-2031. Growth is powered by global mercury-lamp bans, surging demand for energy-efficient curing solutions, and rapid gains in chip quantum efficiency. Regulatory timelines under the Minamata Convention, EU RoHS, and Canadian mercury rules converge in 2027–2025, pushing end users toward UV LED adoption,[1]Rebekah Mullaney, “The End of Fluorescent Lighting,” Buildings, buildings.com, Opsytec, “RoHS & UV Lamps – Current Regulations,” opsytec.com Parallel advances in AlGaN epitaxy, flip-chip structures, and thermal management have lifted external quantum efficiency for deep-UV devices to 9.19% at 250 mA, closing the performance gap with legacy mercury lamps.[2]Hao Xu et al., “Enhancing the Performance of High-Power DUV-LEDs,” Optics Express, optica.org Strong replacement momentum in printing, packaging, and water treatment is reinforcing supplier revenue visibility through 2030.
Key Report Takeaways
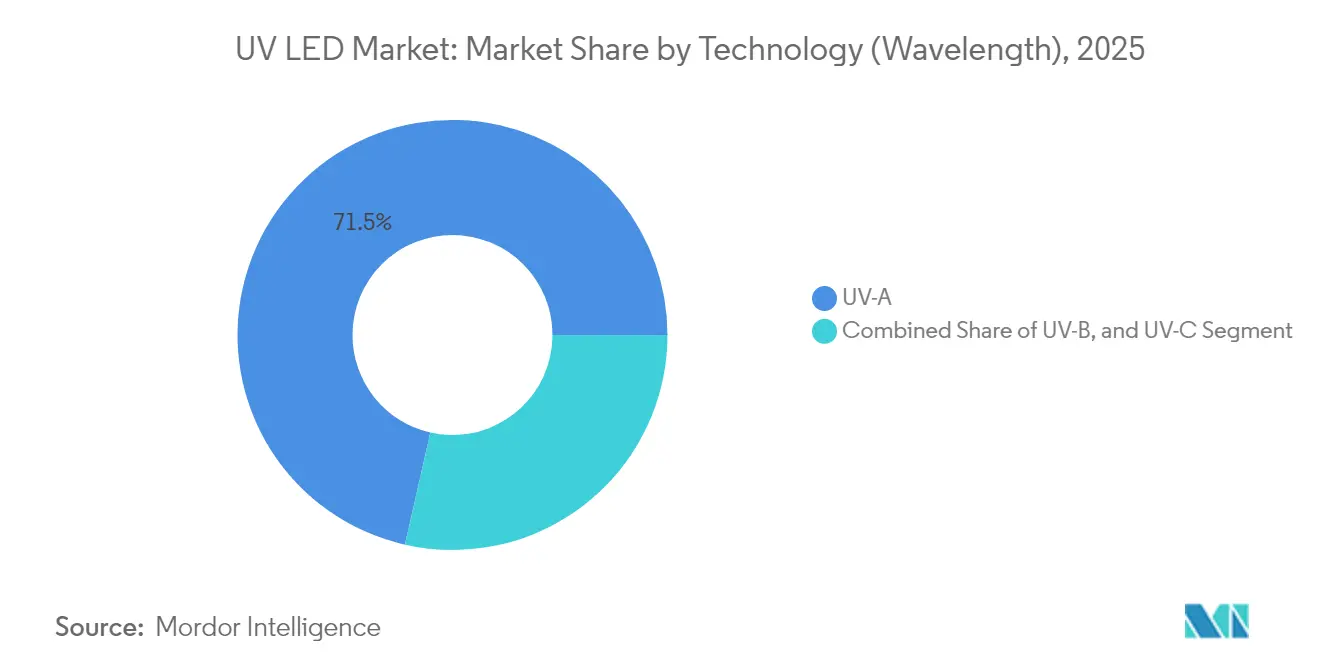
- By technology, UV-A held 71.45% revenue share in 2025, while UV-C is poised to expand at a 21.62% CAGR through 2031.
- By product, modules led with 41.35% of the UV LED market share in 2025; chips are set to grow at 22.85% CAGR to 2031.
- By power class, low-power (<10 mW) devices captured 56.40% of UV LED market size in 2025, yet high-power (>100 mW) devices will rise at 23.18% CAGR between 2026 and 2031.
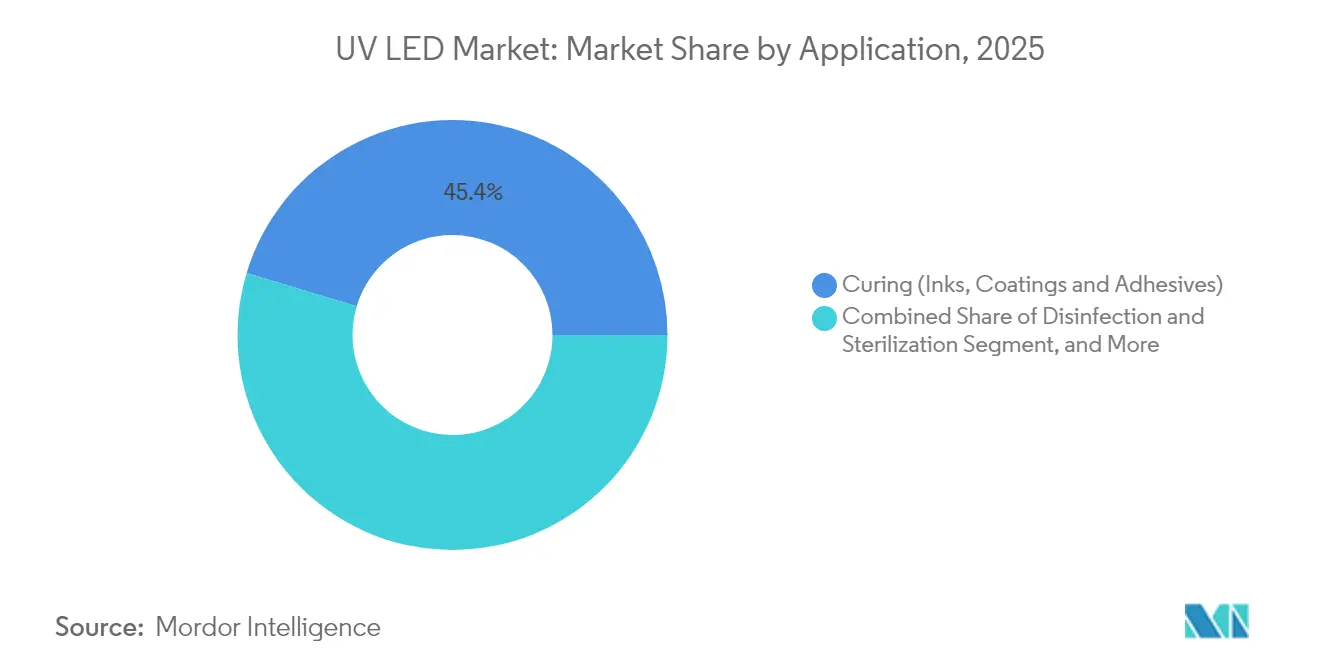
- By application, curing commanded 45.35% share in 2025; disinfection & sterilization shows the fastest growth at 20.75% CAGR.
- By end user, printing & packaging accounted for 29.45% of the UV LED market size in 2025, while healthcare & life sciences will expand at a 24.32% CAGR.
- By geography, Asia Pacific maintained 54.30% regional share in 2025; the Middle East & Africa region is forecast to grow at 20.05% CAGR.
Note: Market size and forecast figures in this report are generated using Mordor Intelligence’s proprietary estimation framework, updated with the latest available data and insights as of 2026.
Global UV LED Market Trends and Insights
Drivers Impact Analysis*
| Driver | (~) % Impact on CAGR Forecast | Geographic Relevance | Impact Timeline |
|---|---|---|---|
| Stringent Mercury Lamp Phase-Out Policies in EU & California Accelerating UV-LED Adoption | +5.3% | European Union, North America (particularly California), with global spillover | Medium term (2-4 years) |
| Surge in Point-of-Use Water Disinfection Demand Post-COVID-19 Across Asia | +4.2% | Asia Pacific (primarily China, India, Southeast Asia) | Short term (≤ 2 years) |
| Rapid Shift to Low-Migration UV LED Inks in Flexible Packaging for Food Safety Compliance | +3.8% | Europe, North America, with adoption spreading to Asia Pacific | Medium term (2-4 years) |
| Energy Price Inflation in Europe Favouring Low-Power UV-LED Curing Lines | +2.9% | European Union, UK | Short term (≤ 2 years) |
| Mini-LED Backlighting Roadmaps Driving Deep-UV Inspection Tools Adoption in Semiconductor Fabs | +2.1% | Asia Pacific (Taiwan, South Korea, Japan), North America | Medium term (2-4 years) |
| Growing Acceptance of Far-UVC (222 nm) for Occupied-Space Air Sanitisation in Airports and Hospitals | +3.5% | North America, Europe, with emerging adoption in Middle East | Long term (≥ 4 years) |
| Source: Mordor Intelligence | |||
Stringent Mercury-Lamp Phase-Out Policies Accelerating UV LED Adoption
Global regulation is eliminating mercury sources in lighting. The Minamata Convention aligned 147 signatories on a 2027 fluorescent exit. The EU RoHS Directive already caps mercury content at 5 mg per lamp, with full bans expected after 2027. Canada’s 2025 rules mirror this direction. As users transition, printing lines report 85% lower energy use after swapping mercury lamps for solid-state arrays. Vendors that pre-qualified UV LED equipment are therefore securing long-term retrofit contracts.
Surge in Point-of-Use Water Disinfection Demand Across Asia
Rapid urbanisation stresses central water grids in India, Indonesia, and coastal China. Field trials in Norway demonstrated 3-log coliform removal at 545 m³/day using LED reactors, validating the technology’s viability for municipal flows. Compact form factors allow embedding UV-C emitters in home dispensers, small factories, and rural clinics. Asian equipment makers are scaling integrated modules that operate on solar micro-grids, accelerating off-grid water-safety rollouts.
Rapid Shift to Low-Migration UV LED Inks in Flexible Packaging
Food-contact packaging faces tighter limits on chemical migration. Low-migration UV LED inks meet these thresholds while curing instantly at room temperature. The narrow UV-A output cuts substrate heating, enabling printing on thin films and bio-based plastics. Converters upgrading to LED lines report 30-70% electricity savings and reduced ventilation costs. Brands adopting recyclable mono-material pouches now specify LED-cured layers to meet voluntary sustainability scorecards.
Energy Price Inflation Favouring Low-Power UV LED Curing Lines
European electricity prices remain volatile, lifting operating costs for mercury-lamp presses that must stay at temperature between jobs. UV LEDs eliminate warm-up idling and lower cooling-air loads. A typical narrow-web flexo press saves 50 MWh annually after conversion. Payback periods shortened to 18 months in 2024, making funding easier under EU green-capex schemes. Demand for retrofit kits has risen sharply among SME converters facing carbon-levy exposure.
Restraints Impact Analysis*
| Restraint | (~) % Impact on CAGR Forecast | Geographic Relevance | Impact Timeline |
|---|---|---|---|
| Quantum Efficiency Ceiling (<5 %) of AlGaN-Based UVC Chips Limits High-Power Applications | -3.2% | Global, with particular impact on North America and Europe | Medium term (2-4 years) |
| Royalty-Heavy IP Landscape Raising Cost Barriers for New Entrants in North America | -2.5% | North America, with spillover effects in Europe | Short term (≤ 2 years) |
| Thermal Management Challenges in High-Density UV LED Arrays for Industrial Curing Lines | -1.8% | Global, with higher impact in Asia Pacific manufacturing hubs | Medium term (2-4 years) |
| Slow Certification Cycles (NSF/ANSI 55-2022) Delaying Municipal Water Projects in Emerging Economies | -2.1% | Emerging economies in Asia Pacific, Middle East, Africa, and South America | Short term (≤ 2 |
| Source: Mordor Intelligence | |||
Quantum Efficiency Ceiling Limiting High-Power Applications
Deep-UV LEDs below 280 nm typically deliver <5% wall-plug efficiency, far below the 20–30% of low-pressure mercury lamps.[3]Nichia, “Alternative Technologies to Low-Pressure Germicidal Mercury Lamps,” nichia.comWater utilities needing kilowatt-scale output must deploy large LED arrays, inflating capital costs. Research now focuses on quantum dots, super-lattices, and transparent substrates to improve hole injection and light extraction. AlGaN super-lattice designs boosted EQE to 8.6% at 35 mW, yet mass manufacturing at such performance remains years away.
Royalty-Heavy IP Landscape Raising Cost Barriers
Foundational patents covering vertical chip structures, flip-chip bonding, and short-period super-lattices are held by a handful of incumbents. New entrants pay multi-layer licensing fees that can add 10–15% to LED module prices. Some suppliers circumvent blockage by adopting alternative epitaxial stacks, but litigation risk still discourages venture-funded challengers in North America. Public funding under the U.S. CHIPS Act prioritises visible LEDs and power devices, leaving deep-UV programmes relatively under-supported.
*Our forecasts treat driver/restraint impacts as directional, not additive. The impact forecasts reflect baseline growth, mix effects, and variable interactions.
Segment Analysis
By Technology (Wavelength): UV-C Growth Redefines Disinfection
UV-A systems held 71.45% revenue share in 2025, retaining dominance in graphic-arts curing and counterfeit detection. UV-C, however, is set for a 21.62% CAGR as healthcare and municipal users deploy mercury-free germicidal solutions. ams OSRAM’s OSLON™ UV 3535 delivers 115 mW at 265 nm with 20,000-hour life, a key milestone for reliable water and air reactors. The UV-B niche addresses phototherapy and agricultural photomorphogenesis, carving specialised demand pockets.
Adoption dynamics vary by region. Europe is standardising 255–275 nm emitters in food-processing pipelines, while Japan explores 308 nm UV-B for dermatology. As quantum-efficiency gains continue, the UV LED market size for UV-C modules targeting medical air sterilisation is projected to grow at double the sector average through 2030. Breakthroughs in far-UVC 222 nm excimer emitters promise human-safe continuous disinfection of occupied spaces, further widening the use-case frontier.


By Product/Form Factor: Chips Drive Miniaturisation
Modules retained the largest 41.35% slice of 2025 revenue due to integration ease. Chips, though, will post a 22.85% CAGR, reflecting demand for custom optical engines in consumer devices and lab instruments. GaN-on-SiC substrates cut thermal resistance, enabling chip-level powers of 100 mW in 2025 prototypes. The lamps sub-segment serves retrofit sockets but faces gradual volume decline as arrays gain traction.
Ultra-miniaturised chips underpin emerging biosensors and lab-on-a-chip devices. Researchers have demonstrated nano-scale perovskite LEDs with 20% EQE at 90 nm dimensions. As packaging shifts from ceramic to moulded composites, median cost per milliwatt is falling, stimulating design-in across portable sterilisation gadgets. Consequently, the UV LED market share of chip-level sales is forecast to rise to 34.20% by 2031.
By Power Output: High-Power Class Breaks Barriers
Low-power emitters (<10 mW) comprised 56.40% revenue in 2025 because many curing lines and sensing devices need modest flux. The high-power bracket (>100 mW) will grow fastest at 23.18% CAGR, fuelled by flip-chip designs that slash thermal resistance. Violumas achieved 13,000-hour lifetimes at 265 nm using 3-PAD architecture, unlocking industrial reactor retrofits. Medium-power devices (10–100 mW) bridge laboratory and compact air-purifier markets.
Cooling innovation remains core. Sloped sidewalls and interrupted mesas raised EQE to 9.19% and WPE to 7.13% at 250 mA, enabling smaller arrays for large-volume reactors. As reliability data accumulates, water authorities expect to substitute mercury banks with LED panels during refurbishment cycles. That transition alone could triple the UV LED market size for high-power arrays between 2025 and 2030.
By Application: Disinfection Momentum Accelerates
Curing kept 45.35% share in 2025, valued for instant on/off and 85% energy cuts versus mercury lamps. The pandemic boosted awareness of UV-based hygiene; disinfection & sterilisation now shows a 20.75% CAGR. UV-C LEDs proved effective against salmonid pathogens in aquaculture, broadening industrial reach. Sensing & instrumentation benefits from stable narrow spectra that enhance analytical signal-to-noise ratios.
Horticulture trials reveal that short-pulse UV-B improves flavonoid profiles in medicinal plants, opening premium crop opportunities. Counterfeit detection, medical phototherapy, 3D printing, and micro-lithography deepen the addressable base. Together, these niches diversify revenue and reinforce the UV LED market’s resilience to sector-specific slowdowns.
By End-User Industry: Healthcare Emerges as Growth Engine
Printing & packaging dominated with 29.45% revenue share in 2025 owing to widespread retrofit of flexographic presses. Healthcare & life sciences will clock a 24.32% CAGR as hospitals install upper-air UV-C fixtures and pharmaceutical plants adopt LED-based surface decontamination. UV-guided therapies such as photodynamic treatment also contribute.
Electronics fabs deploy deep-UV inspection lights to control micro-LED backplane yields, while water utilities experiment with LED reactors above 1.0 MGD throughput. Automotive lines cure scratch-resistant coatings under UV-A LEDs, slashing cycle times. Residential and commercial facilities integrate UV-C air modules in HVAC ducts to raise indoor-air-quality benchmarks. Such multi-industry uptake underscores why the UV LED industry enjoys sustained double-digit expansion.
Geography Analysis
Asia Pacific held a commanding 54.30% share of UV LED market revenue in 2025. China’s self-reliance push is spawning local epitaxy suppliers and captive device packaging lines. Japan and South Korea add high-precision fabrication know-how, while Taiwan specialises in gallium-nitride substrates for deep-UV chips. Rising public-health budgets channel demand for UV-based water and air purification across megacities, cementing regional dominance.
North America ranks second. California’s accelerated mercury-lamp phase-out, coupled with federal funding for domestic chip capacity, drives adoption in healthcare and advanced manufacturing. However, a dense patent thicket and higher labour costs temper the expansion pace. Europe follows closely, powered by energy-efficiency mandates. Ecodesign rules forecast that 96% of installed lamps will be LEDs by 2030, creating a receptive environment for UV solutions.
The Middle East & Africa is the fastest-growing area, showing a 20.05% CAGR as desalination plants and new hospitals incorporate LED reactors. Gulf states fund smart-city programmes that specify mercury-free lighting. South America sees momentum in beverage bottling and aquaculture, though municipal water projects move slowly due to certification cycles. Across all geographies, simultaneous regulation and technology maturation keep the UV LED market on a convergent uplift path.


Competitive Landscape
Industry concentration is moderate. ams OSRAM, Nichia, Seoul Viosys, and Signify combine large patent portfolios with wafer-level capacity, accounting for the bulk of global shipments. ams OSRAM exceeded EUR 100 million free cash flow in 2025, underscoring financial resilience. Nichia leads deep-UV chip performance, while Seoul Viosys leverages vertical integration to lower system-level costs.
Specialists are carving niches. CrayoNano blends AlGaN nanowires with graphene substrates to boost efficiency at lower drive currents, targeting portable sterilisation. Silanna UV commercialises short-period super-lattice devices that sidestep certain incumbent patents. Equipment makers such as Kyocera and Dr. Hönle integrate proprietary air-cooled arrays into modular curing systems, shortening customer changeover times. As application diversity widens, partnerships between LED suppliers, optics firms, and system integrators intensify.
White-space opportunities lie in smart, connected disinfection ecosystems. Combining UV LEDs with sensors enables closed-loop intensity control and usage analytics. Cloud-linked modules can report dosage data for audit compliance in food or pharma plants. Strategic alliances across the value chain will likely determine leadership positions as the UV LED market scales toward mainstream status.
UV LED Industry Leaders
-
Lumileds Holding BV
-
Koninklijke Philips NV
-
NKFG Corporation
-
Hongli Zhihui Group
-
Seoul Viosys Co. Ltd
- *Disclaimer: Major Players sorted in no particular order

Recent Industry Developments
- May 2025: Kyocera introduced the G7A Series air-cooled UV LED light source, advancing curing efficiency for industrial lines.
- March 2025: AquiSense Technologies launched a Norwegian pilot to validate UV-C LED reactors for municipal water disinfection.
- February 2025: ams OSRAM reported Q4 2024 revenue of EUR 882 million and guided to free cash flow above EUR 100 million for 2025.
- October 2024: University of Science and Technology of China demonstrated a vertically integrated micro-LED array for maskless deep-UV lithography.


Research Methodology Framework and Report Scope
Market Definitions and Key Coverage
Our study counts every newly manufactured ultraviolet light-emitting diode, spanning UV-A, UV-B, and UV-C chips, packaged devices, modules, and turnkey lamps that ship to end-use OEMs or distributors for curing, disinfection, sensing, medical therapy, security printing, horticulture, and allied uses. The valuation stops at the first commercial sale and is reported in constant 2024 US dollars.
Scope exclusion: legacy mercury or excimer lamps and retrofit driver kits are left outside the model, keeping the focus on solid-state emitters only.
Segmentation Overview
-
By Technology (Wavelength)
- UV-A
- UV-B
- UV-C
-
By Product/Form Factor
- Lamps
- Modules
- Arrays
- Chips
-
By Power Output
- Low Power (<10 mW)
- Medium Power (10-100 mW)
- High Power (>100 mW)
-
By Application
- Curing (Inks, Coatings and Adhesives)
- Disinfection and Sterilization
- Sensing and Instrumentation
- Medical and Phototherapy
- Counterfeit Detection and Security
- Horticulture and Indoor Farming
- Other Niche Applications (3-D Printing, Lithography)
-
By End-user Industry
- Healthcare and Life Sciences
- Printing and Packaging
- Electronics and Semiconductors
- Water and Wastewater Utilities
- Food and Beverage Processing
- Automotive and Aerospace
- Residential and Commercial Buildings
- Industrial Manufacturing
-
By Geography
-
North America
- United States
- Canada
- Mexico
-
Europe
- Germany
- United Kingdom
- France
- Italy
- Spain
- Rest of Europe
-
Asia-Pacific
- China
- Japan
- South Korea
- India
- South East Asia
- Rest of Asia-Pacific
-
South America
- Brazil
- Rest of South America
-
Middle East and Africa
-
Middle East
- United Arab Emirates
- Saudi Arabia
- Rest of Middle East
-
Africa
- South Africa
- Rest of Africa
-
Middle East
-
North America
Detailed Research Methodology and Data Validation
Primary Research
Mordor analysts interviewed chip fabricators, packaging houses, UV curing press integrators, water-purifier OEMs, and infection-control specialists across Asia-Pacific, Europe, and the Americas. These dialogues confirmed wafer throughput, adoption rates in narrow-web presses, and the practical ceiling on deep-UV external quantum efficiency, refining assumptions surfaced during desk work.
Desk Research
We layer public science with business data. Open datasets from bodies such as the International Ultraviolet Association, the Minamata Convention secretariat, US EPA, EU RAPEX recall logs, and China's Institute of Semiconductors reveal installed base rules, wavelength safety norms, and policy timelines. Trade flows from UN Comtrade, customs filings, and Korea International Trade Association help us size cross-border diode shipments, while company 10-Ks, investor decks, and patent filings feed yield, die size, and average selling price (ASP) cues. Select paid portals like D&B Hoovers and Dow Jones Factiva supply revenue splits and deal trackers that ground early trend signals. The list above is illustrative; many additional sources were tapped for triangulation and context building.
Market-Sizing & Forecasting
A top-down construct starts with global AlGaN wafer capacity, back-calculates packaged-LED output through yield and binning factors, and then maps device volumes to nine end-use pools via penetration-rate paths. Results are stress-tested with selective supplier roll-ups (sampled ASP × volume) before finalizing totals. Key variables include: (1) regulatory mercury-lamp phase-out deadlines, (2) UV curing press installations, (3) point-of-use water purifier shipments, (4) median module ASP progression, (5) deep-UV chip conversion efficiency, and (6) regional energy tariffs that sway payback math. A multivariate regression, blended with scenario analysis for policy shocks, projects each driver through 2030.
Data Validation & Update Cycle
Outputs pass two analyst reviews, variance checks against independent shipment tallies, and automated currency/inflation scrubs. We refresh the model every twelve months, triggering mid-cycle updates when material events, such as plant fires, import bans, or step-change efficiency gains, shift baselines.
Why Mordor's UV LED Baseline Commands Reliability
Published estimates vary; definitions, price decks, and refresh schedules seldom match. By anchoring scope at the packaged-LED sale, using recent ASP curves validated with buyers, and maintaining an annual refresh cadence, Mordor minimizes distortion.
Key gap drivers include narrower application baskets, conservative ASP erosion assumptions, or omission of Asia's contract packaging output in other studies, which together compress their totals relative to ours.
Benchmark comparison
| Market Size | Anonymized source | Primary gap driver |
|---|---|---|
| USD 1.94 B (2025) | Mordor Intelligence | - |
| USD 1.23 B (2025) | Global Consultancy A | Limited wavelength scope and static ASP assumption |
| USD 1.52 B (2024) | Industry Journal B | Excludes module-level aftermarket and small Asian job shops |
In sum, our disciplined source mix, constant validation loops, and transparent driver stack give decision-makers a dependable baseline that is easy to audit and ready to adapt when the market pivots.


Key Questions Answered in the Report
What is the current size of the UV LED market?
The UV LED market is valued at USD 2.32 billion in 2026 and is forecast to hit USD 5.66 billion by 2031.
Which region leads the UV LED market?
Asia Pacific holds a 54.30% revenue share thanks to its comprehensive semiconductor supply chain and high demand for disinfection technologies.
Why are UV-C LEDs growing so quickly?
Tight mercury-lamp bans and heightened hygiene awareness push hospitals, water utilities, and public venues to adopt UV-C LEDs that offer germicidal performance without hazardous substances.
What limits deeper penetration of UV-C LEDs in high-power systems?
Quantum-efficiency ceilings below 5% and complex patent licensing increase cost per watt, although new super-lattice structures are gradually lifting performance.
Which application will add the most new revenue by 2031?
Disinfection & sterilisation leads growth with a 20.75% CAGR, driven by healthcare, municipal water, and air-quality deployments.
How energy efficient are UV LED curing lines compared with mercury lamps?
Converters switching to UV LEDs report up to 85% lower energy consumption and substantial reductions in cooling and standby power.
Page last updated on:


