U.S. Water Softening Systems Market Size and Share
Market Overview
| Study Period | 2021 - 2031 |
|---|---|
| Forecast Data Period | 2026 - 2031 |
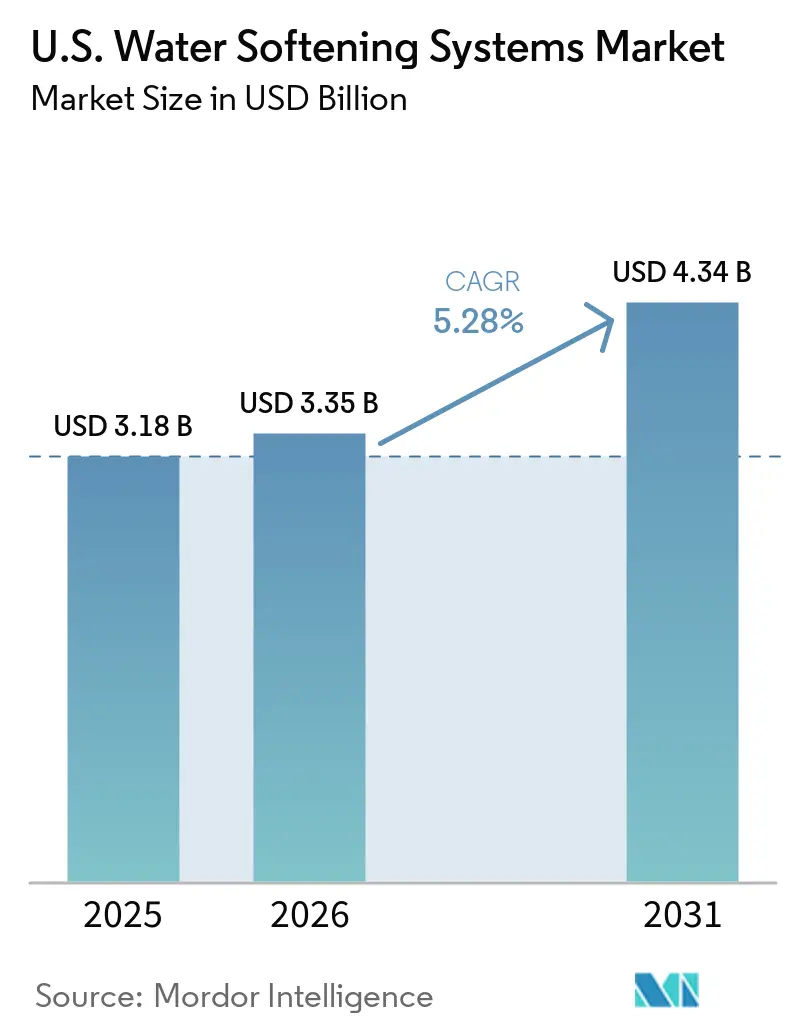
| Base Year Market Size (2025) | USD 3.18 Billion |
| Market Size (2026) | USD 3.35 Billion |
| Market Size (2031) | USD 4.34 Billion |
| Growth Rate (2026 - 2031) | 5.28% CAGR |
| Market Concentration | Medium |
Major Players *Disclaimer: Major Players sorted in no particular order Image © Mordor Intelligence. Reuse requires attribution under CC BY 4.0. | |
U.S. Water Softening Systems Market Analysis by Mordor Intelligence
The U.S. water softening systems market size was valued at USD 3.18 billion in 2025 and estimated to grow from USD 3.35 billion in 2026 to reach USD 4.34 billion by 2031, at a CAGR of 5.28% during the forecast period (2026-2031). The U.S. water softening systems market continues to rest on a durable demand base because hard water affects 85% of U.S. households, which keeps the need for treatment tied to daily water use rather than short-term spending cycles, according to the United States Geological Survey[1]Source: U.S. Geological Survey, “Hardness of Water,” USGS Water Science School, usgs.gov. Household adoption is also broadening, with the Water Quality Association stating that 54% of U.S. households used at least 1 water treatment product in 2025, up from 40% in 2021, while whole-house systems and softeners posted 16% year-over-year ownership growth[2]Source: Water Quality Association, “2025 Consumer Insights Report,” Water Quality Association, wqa.org. The U.S. water softening systems market is also benefiting from a shift toward connected, bundled systems, where buyers increasingly look for filtration, monitoring, and shutoff features in a single purchase, boosting revenue per installation and giving dealers a stronger service relationship after the sale. Demand is further supported by operational needs across business facilities, as hard-water scale can reduce water heater efficiency by up to 30%, making treatment a cost-control tool in buildings that depend on reliable hot-water performance, according to the United States Department of Energy. At the same time, western water efficiency rules and drought planning are pushing product development toward high-efficiency and low-discharge systems, which is changing the mix of technologies and installation models across the U.S. water softening systems market.
Key Report Takeaways
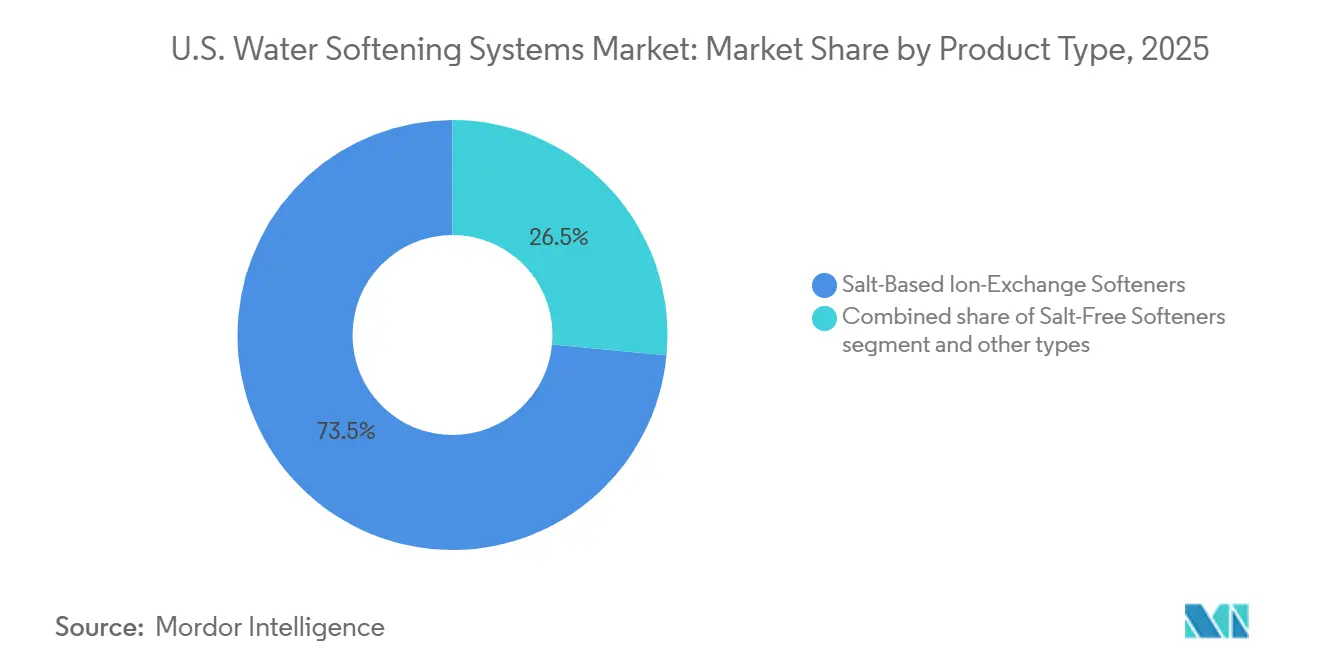
- By product type, salt-based ion-exchange softeners held 73.55% of the U.S. water softening systems market share in 2025, while salt-free softeners are forecast to expand at a 8.67% CAGR through 2031.
- By process, ion exchange accounted for 71.74% of the U.S. water softening systems market size in 2025, while reverse osmosis is expected to grow fastest at 9.15% CAGR through 2031.
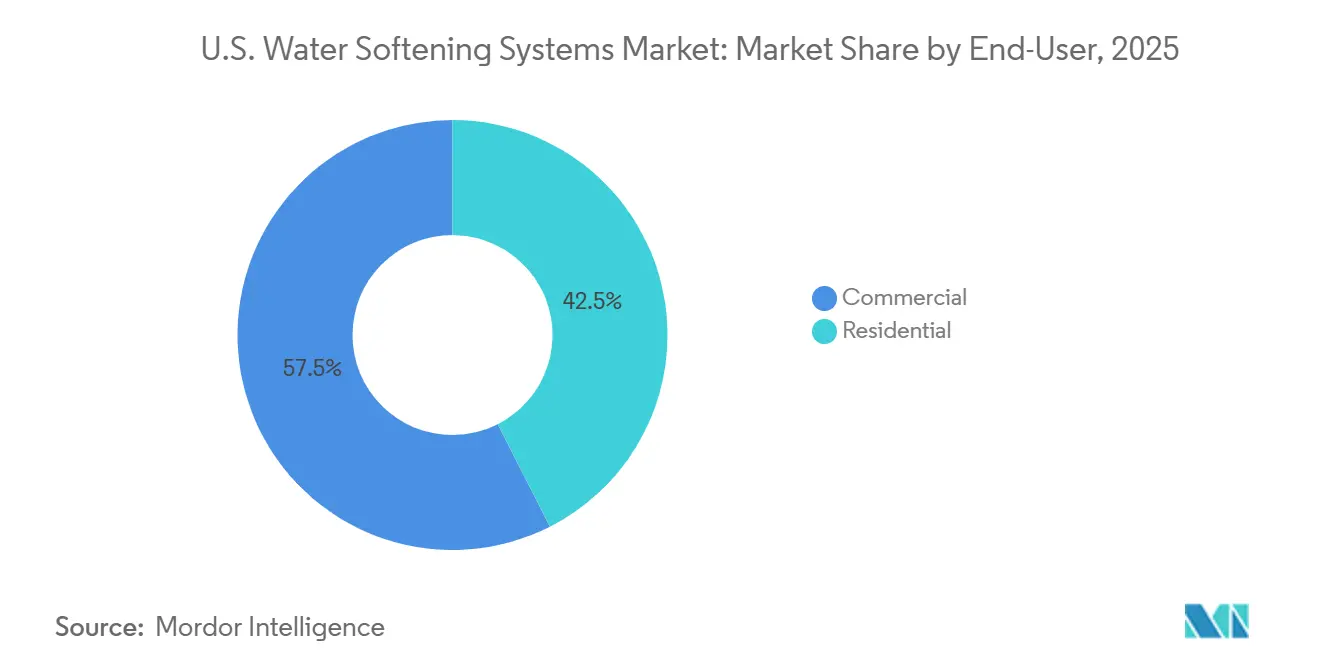
- By end user, commercial installations held 57.49% of the U.S. water softening systems market share in 2025, while residential installations are poised to grow at a 10.86% CAGR through 2031.
Note: Market size and forecast figures in this report are generated using Mordor Intelligence’s proprietary estimation framework, updated with the latest available data and insights as of January 2026.
U.S. Water Softening Systems Market Trends and Insights
Drivers Impact Analysis*
| Driver | (~) % Impact on CAGR Forecast | Geographic Relevance | Impact Timeline |
|---|---|---|---|
| High hard-water prevalence across U.S. households | +1.1% | National, with stronger intensity across the Midwest, Great Plains, and Southwest | Long term (≥ 4 years) |
| Rising demand for whole-house water quality solutions | +0.9% | National, with stronger uptake in new residential developments across Sun Belt states | Medium term (2-4 years) |
| Growth in smart and Wi-Fi-enabled softeners | +0.8% | National, led by smart-home adoption corridors in the Northeast and Pacific Coast | Medium term (2-4 years) |
| Adoption of salt- and water-efficient systems | +0.6% | National, with early momentum in California, Nevada, and Arizona | Short term (≤ 2 years) |
| Water efficiency pressure in drought-affected states | +0.5% | Southwest core, with spillover into Colorado and Texas | Medium term (2-4 years) |
| Commercial demand from boiler, laundry, and foodservice water quality requirements | +0.8% | National, with concentration in major urban commercial corridors | Medium term (2-4 years) |
| Source: Mordor Intelligence | |||
Hard-water prevalence sustains a non-cyclical demand floor
Hard-water exposure affects 85% of U.S. households, giving the U.S. water-softening systems market a demand floor tied to normal water use and appliance protection rather than to discretionary purchasing cycles, according to the U.S. Geological Survey. The strongest need continues to cluster in the Midwest, Great Plains, and Southwest, where the USGS water hardness map shows broad areas of very hard groundwater and where treatment is often a practical requirement for homes and businesses. Hard water also creates a direct operating cost problem because scale buildup can cut water heater efficiency by up to 30%, which raises the value of softening in both homes and commercial buildings that depend on steady hot-water output, according to the United States Department of Energy[3]Source: Pacific Northwest National Laboratory, “Water Softeners,” Building America Solution Center, basc.pnnl.gov . The Water Quality Association reported that 75% of softener buyers made the purchase within their first year of homeownership, suggesting a close link between demand and housing turnover and new-home completions in hard-water states. That pattern keeps the U.S. water softening systems market closely linked to suburban expansion in Sun Belt states, while also supporting a steady replacement cycle in older installed bases across established hard-water regions.
Whole-home water quality bundles elevate average transaction values
The U.S. water softening systems market is moving beyond the single-purpose appliance model, as more buyers now view treatment as part of a broader whole-home water setup that includes filtration, monitoring, and drinking water improvement. The Water Quality Association stated that 54% of U.S. households used at least 1 water treatment product in 2025, up from 40% in 2021, and that whole-house systems and softeners posted 16% year-over-year growth in ownership, indicating stronger household comfort with broader treatment adoption. This shift helps dealers and manufacturers raise transaction values because a bundled installation carries more equipment, more service touchpoints, and a stronger reason for professional setup. GE Appliances made this approach visible in February 2025 when it launched the GE Profile Professional Smart Valve Water Softener with integrated smart controls and remote shutoff capability as part of a wider whole-home water lineup. As a result, the U.S. water softening systems market is rewarding suppliers that can offer a broader household water platform rather than a stand-alone softener, especially in new housing and premium retrofit projects.
IoT connectivity converts a product sale into a recurring service relationship
Connected systems are changing how the U.S. water softening systems market operates after installation, as monitoring and service alerts keep the supplier involved long after the initial sale. Culligan’s Aquasential Smart High Efficiency Water Softener uses remote monitoring, demand-initiated regeneration, and system alerts, and the company states that this design can reduce salt use by up to 46% compared to time-clock systems, providing connected equipment with a clear operating-cost message and a convenience benefit[4]Source: Culligan International, “Aquasential Smart High Efficiency Water Softener,” Culligan, culligan.com. These features also support repeat business because dealers can use app-linked systems to sell maintenance plans, salt delivery, and scheduled service rather than waiting for a breakdown call. The Water Quality Association reported that 52% of softener owners already have a professional service agreement, indicating that the service model is established and still has room to deepen. This is important for the U.S. water softening systems market because margins are shifting toward service retention, operational efficiency, and data-led support rather than one-time equipment sales.
Commercial water quality mandates anchor high-value installation segments
The U.S. water softening systems market continues to benefit from strong demand from commercial installations, as businesses that depend on boilers, laundry systems, foodservice equipment, and sterile processing cannot absorb the downtime and maintenance costs caused by untreated hard water. Commercial demand accounted for 57.5% of total market demand in 2025, underscoring the importance of non-residential water quality needs for system vendors serving institutional and business customers. Compliance standards also strengthen this demand because NSF/ANSI 44 remains a recognized baseline for residential cation exchange softeners, and broader water quality specifications continue to shape institutional purchasing behavior, requiring equipment performance to be documented in accordance with the National Sanitation Foundation. This gives suppliers with trained installation teams, familiarity with certifications, and the ability to support large accounts across multiple locations an advantage. In the U.S. water softening systems market, this makes commercial work attractive not only because of system size, but also because contracts, maintenance cycles, and customer retention are usually stronger than in one-time household purchases.
Restraints Impact Analysis*
| Restraint | (~) % Impact on CAGR Forecast | Geographic Relevance | Impact Timeline |
|---|---|---|---|
| Brine discharge restrictions and wastewater compliance pressure | -0.5% | California, Texas, Arizona, with spillover to nearby western states | Short term (≤ 2 years) |
| Upfront installation cost and service complexity | -0.4% | National, with stronger effect in lower-income and service-thin regions | Medium term (2-4 years) |
| Consumer shift toward salt-free alternatives in certain states | -0.3% | California, Oregon, and Southwest states, with wider awareness building nationally | Medium term (2-4 years) |
| Space constraints in urban multifamily retrofits | -0.2% | High-density urban markets such as New York City, San Francisco, Chicago, and Boston | Long term (≥ 4 years) |
| Source: Mordor Intelligence | |||
Brine discharge regulations reshape the salt-based installation map
The U.S. water softening systems market faces a real constraint from brine discharge regulation because some western jurisdictions are tightening the conditions under which self-regenerating softeners can be installed or used. California’s statewide conservation framework took effect on January 1, 2025, and increases pressure on utilities and local authorities to manage long-term water-efficiency and reuse goals, which directly affects the acceptability of discharge-heavy systems in parts of the state. Water stress across the Southwest is adding to that pressure because post-2026 Colorado River planning is centered on reduced supply scenarios across major western states, which supports lower-discharge product designs and alternative service models. This means the U.S. water softening systems market is not losing demand in those areas, but demand is shifting toward high-efficiency units, salt-free options, and exchange-based service models that make regulatory risk easier to manage.
Installation Cost and Service Complexity Slow Mass-Market Penetration
The U.S. water softening systems market also faces a softer but persistent restraint from installation complexity because buyers need proper sizing, local water knowledge, and service support to choose the right system. The Water Quality Association found that 12% of non-owners cited maintenance concerns as the main reason for not purchasing a treatment product, indicating that the barrier is not just budget but also concern over upkeep and system management. That matters because water softeners are not a simple plug-and-play purchase, and incorrect sizing for hardness level, flow demand, or iron content can lead to poor performance and customer dissatisfaction. Certification and product validation help reduce this problem, with NSF/ANSI 44 and the WQA Gold Seal program providing clear performance and compliance benchmarks for products sold in the United States, according to the National Sanitation Foundation[5]Source: NSF, “NSF/ANSI 44 Technical Requirements,” NSF, nsf.org. Even so, the U.S. water softening systems market still has uneven installer depth across some rural and lower-density regions, which slows conversion and favors brands with wider dealer networks and stronger after-sales support.
*Our forecasts treat driver/restraint impacts as directional, not additive. The impact forecasts reflect baseline growth, mix effects, and variable interactions.
Segment Analysis
By Product Type: Salt-Based Systems Dominant, Salt-Free Gaining Momentum
Salt-based ion-exchange softeners held 73.55% of the market by product type in 2025, keeping them firmly in the lead in the U.S. water softening systems market, as they remain the most proven option for severe hardness reduction. Their position is supported by long installer familiarity, dependable performance, and strong alignment with recognized residential certification standards, especially in regions where water hardness is consistently high. Salt-free systems are projected to grow at a 8.67% CAGR through 2031, making them the fastest-growing product type as western regulations, homeowner preference for lower maintenance, and builder interest in low-discharge designs continue to expand. That growth does not remove the lead held by salt-based units, but it does change where future gains are likely to emerge across the U.S. water softening systems market.
Within the U.S. water softening systems industry, product development is moving toward systems that do more than just soften water, as suppliers seek to capture a larger share of the whole-home treatment budget. GE Appliances showed this direction in February 2025 with the launch of the GE Profile Professional Smart Valve Water Softener, which added app connectivity, usage monitoring, salt alerts, and remote shutoff into a professionally installed system. Salt-free products are also finding a useful path through builder relationships, with Sidon Water highlighting deployment of its Integro system in Boise Hunter Homes developments, which shows how new construction can support adoption where developers want simpler maintenance and lower discharge concerns. Smaller non-ion-exchange products still occupy a niche position, but the U.S. water softening systems market is giving them selective openings in regulated and space-constrained settings where a conventional brine-based setup is harder to justify.


By Process: Ion Exchange Anchors the Market, Reverse Osmosis Posts the Fastest Growth
Ion exchange held 71.74% of the market by process in 2025, while reverse osmosis is projected to grow at a 9.15% CAGR through 2031, indicating a clear split between the current anchor technology and the fastest-rising alternative in the U.S. water softening systems market. Ion exchange continues to benefit from installer familiarity, a long operating history, and direct fit with NSF/ANSI 44 requirements that still matter in mainstream residential procurement and many professional channels, according to the National Sanitation Foundation. Reverse osmosis is gaining ground because many buyers now want a system that addresses hardness and broader water-quality concerns in a single household or building upgrade. This is pushing the U.S. water softening systems market toward a combined-treatment approach, where the chosen process is judged on contaminant control, water efficiency, and total system value rather than hardness reduction alone.
The process shift is also becoming more visible in product launches, as suppliers respond to drought pressure and increased scrutiny of water loss in western states. Kinetico introduced the HYDRO ECO reverse osmosis system in 2025 with a 2:1 pure-to-drain water ratio, which positioned the product around efficiency as much as purification performance. Arizona’s 2025 groundwater legislation and the federal planning focus on reduced Colorado River supplies are likely to keep that efficiency message important across the Southwest, where process choice is increasingly tied to water use as well as treatment performance. Even so, the U.S. water softening systems industry still gives ion exchange a durable role in larger and more specification-driven installations because reliability, certification, and service familiarity remain hard for emerging alternatives to match at scale.
By End-User: Commercial Anchors Volume While Residential Drives Growth Rate
Commercial installations accounted for 57.49% of total demand in 2025, while residential installations are projected to grow at a 10.86% CAGR through 2031, making this one of the clearest balance points in the U.S. water softening systems market. Business demand remains strong because hotels, restaurants, healthcare facilities, laundries, and similar sites experience direct equipment wear, service disruptions, and increased operating costs when hard water is left untreated. These buyers also tend to value dependable service, support, and documented product performance, which underscores the importance of installer reach and familiarity with compliance standards, according to the National Sanitation Foundation. In practice, that keeps commercial demand steady even when household replacement activity or consumer sentiment softens across parts of the U.S. water softening systems market.
Residential demand is growing faster as the addressable customer base widens through Sun Belt housing growth, broader household interest in whole-home treatment, and a clearer service proposition for first-time buyers. The Water Quality Association stated that 53% of non-owners would adopt a water treatment product if utilities handled ongoing upkeep, which suggests that easier service models could unlock a larger residential customer pool over time. A.O. Smith’s acquisition of Impact Water Products expanded its West Coast distribution reach, which supports installer coverage in a region where regulation, drought concerns, and treatment demand all intersect. That makes residential growth in the U.S. water softening systems market more than a housing story because it also depends on service access, local installer density, and the ability of suppliers to reduce friction for households that have not owned a system before.
Geography Analysis
The Midwest and Southwest remained the most active demand zones in the U.S. water softening systems market in 2025. The strongest geographic support continues to come from hard-water intensity, as the USGS water hardness map shows widespread very hard groundwater across much of the central and western United States, keeping treatment demand rooted in local water conditions rather than temporary demand spikes. Texas stands out because it combines household demand from fast-growing suburban areas with business demand from food processing, energy operations, hospitality, and commercial laundry facilities. Kansas, Oklahoma, Iowa, and Missouri also matter because they support a stable mix of first-time installations and replacement demand from older residential systems already in service. This gives the U.S. water-softening systems market a broad middle-U.S. demand base that is less exposed to short-term swings than markets built solely on new construction activity.
The Southwest adds another layer because it combines some of the country’s hardest water with some of the sharpest water-efficiency pressure. Arizona, Nevada, Utah, and parts of California continue to support strong treatment need, while major metro growth in Phoenix, Las Vegas, and other high-growth corridors keeps adding new households to the addressable base of the U.S. water softening systems market. Arizona’s 2025 Ag-to-Urban Groundwater Conservation Program reinforces the need for efficient water use, and post-2026 Colorado River planning keeps long-term supply constraints in view for western states that depend on stressed basin resources. California remains the most complex part of the region because real treatment demand exists alongside local discharge restrictions and stronger conservation rules, which narrows the fit for conventional salt-based installations in some service areas. For that reason, the U.S. water softening systems market in the Southwest is growing through a different mix of products and service models than the Midwest, with more emphasis on efficiency, compliance, and alternative delivery formats.
The Southeast and Northeast round out the national picture with a different opportunity mix inside the U.S. water softening systems market. Florida and the Carolinas benefit from ongoing residential development and moderate-to-hard water conditions, which create a healthy first-installation pipeline for regionally strong installer networks. The Northeast leans more toward commercial and retrofit work because dense urban areas such as New York City and Boston have older building stock, tighter equipment spaces, and large hospitality and foodservice footprints that reward compact and higher-performance systems.
Competitive Landscape
The U.S. water softening systems market remains moderately fragmented, with a competitive landscape shaped by a mix of national service networks, regional installers, direct-to-consumer brands, and niche commercial suppliers. No single supplier appears to dominate the field to the point of setting the market structure alone, which is why competition still depends heavily on dealer reach, after-sales support, local water expertise, and product breadth. Strategic moves in the last 2 years show that leading companies are trying to build broader water platforms rather than stay limited to stand-alone softeners. Watts Water Technologies strengthened its position in June 2025 by acquiring EasyWater, adding chemical-free and salt-free treatment capabilities that are increasingly relevant as discharge regulations gain weight in parts of the country. GE Appliances also entered the connected premium segment in February 2025 with the launch of its smart valve softener, reflecting how digital features are becoming a more important way to compete in the U.S. water softening systems market.
The next layer of competition is moving toward platform strength, which means suppliers increasingly need filtration, monitoring, service, and channel coverage in addition to softening performance. A.O. Smith expanded that reach through its earlier acquisition of Impact Water Products, which improved dealer access on the West Coast, and through its 2024 acquisition of Pureit, which added portfolio scale and stronger digital water treatment capability. Watts also continued to emphasize connected product development, reporting 25 new smart and connected product launches in 2024, which supports a broader shift toward digital monitoring and service-led equipment management. In the U.S. water softening systems market, that matters because certification alone is no longer enough to stand out once buyers begin to compare service speed, digital oversight, and the ability to solve multiple water quality issues in one installation. Brands that cannot support online discovery, regional installer coordination, and recurring service revenue are likely to face more pressure in price-sensitive parts of the market.
Certification and compliance still create a meaningful barrier in higher-value channels, which gives established suppliers some protection even in a fragmented field. NSF/ANSI 44 and the WQA Gold Seal program are now close to minimum requirements in much of the residential channel, and they are especially useful where builders, dealers, and institutional buyers want documented performance rather than marketing claims. At the same time, the U.S. water softening systems market is opening more room for compact products, subscription service offers, and lower-discharge alternatives as regulation and urban retrofit needs change the shape of demand. The result is a market where scale matters, but local execution, service quality, and fit with water-efficiency expectations still decide a large share of winning business.
U.S. Water Softening Systems Industry Leaders
Culligan International Company
A. O. Smith Corporation
EcoWater Systems LLC
Kinetico Incorporated
Pentair plc
- *Disclaimer: Major Players sorted in no particular order

Recent Industry Developments
- January 2026: A.O. Smith Corporation completed the USD 470 million acquisition of Leonard Valve Company (LVC Holdco LLC), advancing A.O. Smith's integrated water management platform and broadening its distribution to commercial and institutional customers in the U.S.
- December 2025: Culligan International and AmeriWater announced a strategic partnership targeting Central Sterile Processing Departments in North American healthcare facilities. The partnership combines Culligan's commercial dealer network with AmeriWater's specialized purification capabilities to meet ANSI/AAMI ST108 water quality standards, opening a high-compliance segment for commercial installations.
- June 2025: Watts Water Technologies acquired all assets of Freije Treatment Systems, Inc. (EasyWater), a Fishers, Indiana-based provider of chemical-free and salt-free water treatment solutions for residential and commercial applications, substantially. The acquisition directly strengthens Watts' position in no-discharge treatment alternatives as brine regulations tighten across U.S. markets.
- February 2025: GE Appliances Air & Water Solutions launched the GE Profile Professional Smart Valve Water Softener, featuring SmartHQ app integration, real-time flow and usage data, salt-refill alerts, and a remote water shutoff valve. The launch debuted at the Kitchen and Bath Industry Show (KBIS) 2025, marking GE Appliances' entry into the connected smart softener segment.


U.S. Water Softening Systems Market Report Scope
Water softening systems are water treatment solutions designed to reduce hardness-causing minerals, such as calcium and magnesium, to improve water quality and protect plumbing and appliances. The U.S. water softening systems market is segmented by product type, process, and end user. By product type, the market includes salt-based ion-exchange softeners, salt-free softeners, and other types of water softening systems. Based on process, the market is categorized into ion exchange, reverse osmosis, and other treatment processes. By end user, the market is segmented into residential and commercial sectors. The report analyzes market size and forecasts for the U.S. water softening systems market across these segments. For each segment, market sizing and forecasts have been conducted on a value basis (USD).
| Salt-Based Ion-Exchange Softeners |
| Salt-Free Softeners |
| Other Types |
| Ion Exchange |
| Reverse Osmosis |
| Others |
| Residential |
| Commercial |
| By Product Type | Salt-Based Ion-Exchange Softeners |
| Salt-Free Softeners | |
| Other Types | |
| By Process | Ion Exchange |
| Reverse Osmosis | |
| Others | |
| By End-User | Residential |
| Commercial |


Key Questions Answered in the Report
What is the 2031 outlook for U.S. water softening systems demand?
The U.S. water softening systems market is projected to reach USD 4.34 billion by 2031 from USD 3.35 billion in 2026, growing at a 5.28% CAGR over 2026-2031.
Which product type leads U.S. water softening systems sales today?
Salt-based ion-exchange softeners led product demand with 73.55% share in 2025 because they remain the most established option for strong hardness reduction in severe hard-water areas.
Which process is expanding the fastest in water softening applications?
Reverse osmosis is projected to grow at 9.15% CAGR through 2031 as buyers increasingly seek systems that address hardness and broader water quality concerns in a single installation.
Why is residential demand increasing faster than commercial demand?
Residential installations are forecast to rise at 10.86% CAGR because of Sun Belt housing growth, broader household interest in whole-home treatment, and stronger service models that reduce ownership friction.
Page last updated on:


