
US Student Accommodation Market Size and Share
Market Overview
| Study Period | 2020 - 2031 |
|---|---|
| Forecast Data Period | 2026 - 2031 |
| Base Year Market Size (2025) | USD 22.80 Billion |
| Market Size (2026) | USD 24.56 Billion |
| Market Size (2031) | USD 35.65 Billion |
| Growth Rate (2026 - 2031) | 7.74 % |
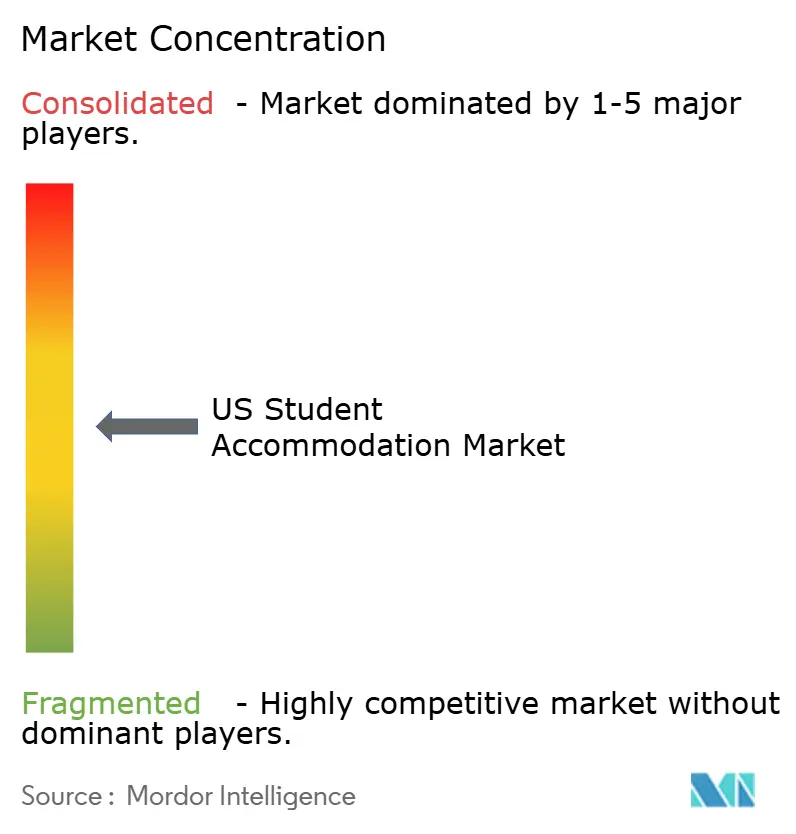
| Market Concentration | Medium |
Major Players *Disclaimer: Major Players sorted in no particular order Image © Mordor Intelligence. Reuse requires attribution under CC BY 4.0. | |
US Student Accommodation Market Analysis by Mordor Intelligence
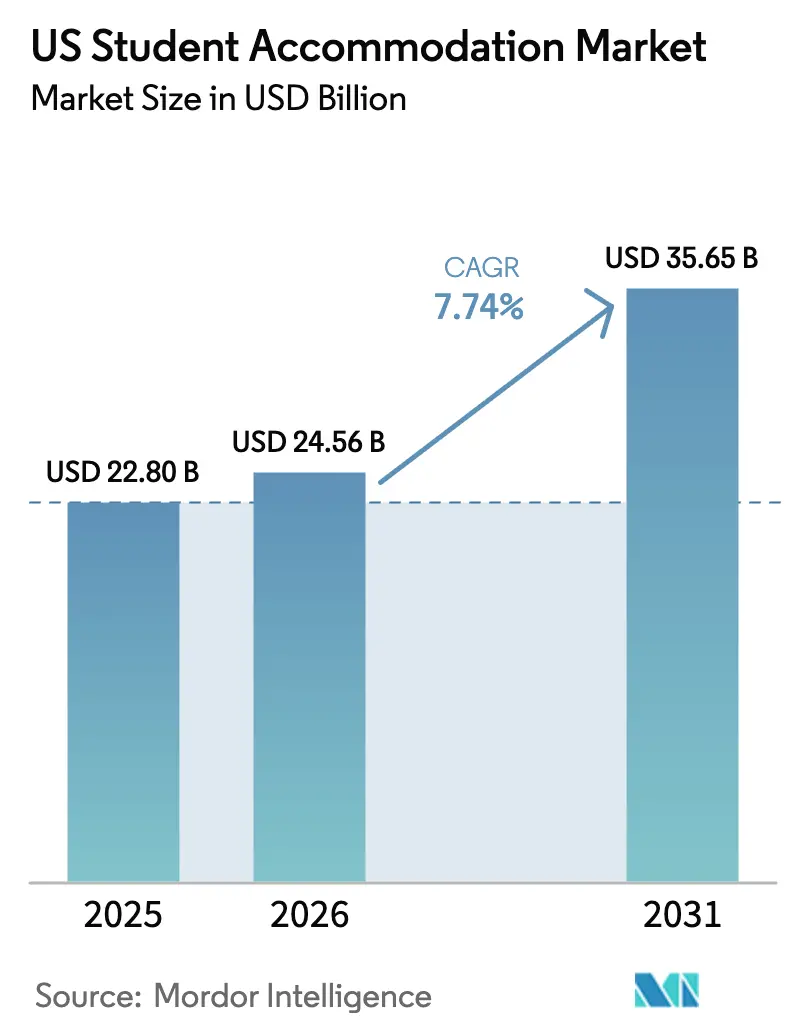
The US Student Accommodation Market size is expected to grow from USD 22.80 billion in 2025 to USD 24.56 billion in 2026 and is forecast to reach USD 35.65 billion by 2031 at 7.74% CAGR over 2026-2031. Expansion continues despite macroeconomic uncertainty because international enrollment has already rebounded above 1.057 million students, marking the largest single-year jump in four decades. A refinancing wave worth more than USD 8 billion of loan maturities through 2025 is unlocking new capital, prompting asset re-positioning in tier-1 university towns. A tight new-bed supply of only 26,000 additions through 2025 gives landlords pricing power as occupancy sits above 94% costar.com. Operators are adopting public-private partnership (P3) frameworks that transfer delivery risk while accelerating timelines; UC Merced’s USD 1.3 billion scheme now serves up to 10,000 students on time and budget. Technology platforms such as predictive leasing tools are cutting room-change requests by 35% and nudging occupancy above 90%.
Key Report Takeaways
- By student type, international students captured 77.22% of the US student housing market share in 2025; domestic students trail, yet their segment expands at the next-highest 8.74% CAGR through 2031.
- By room type, private rooms held 59.12% of revenue in 2025; shared rooms are forecast to expand at 11.18% CAGR to 2031.
- By institution type, “Others” (private owners) controlled 71.66% share in 2025, while university-managed housing records the fastest projected 8.58% CAGR through 2031.
- By region, the Rest of the US commanded 37.62% of the US student housing market size in 2025; Illinois posts the quickest 10.01% CAGR outlook to 2031.
Note: Market size and forecast figures in this report are generated using Mordor Intelligence’s proprietary estimation framework, updated with the latest available data and insights as of 2026.
Proportional positioning is established by comparing country level and regional contributions against the global total, including that of United states. The student accommodation market share in our global report expresses these relative weights.
US Student Accommodation Market Trends and Insights
Drivers Impact Analysis*
| Driver | (~) % Impact on CAGR Forecast | Geographic Relevance | Impact Timeline |
|---|---|---|---|
| Surge in international student numbers | +2.1% | California, New York, Texas, Massachusetts, Illinois | Short term (≤ 2 years) |
| Rising institutional and private capital inflows | +1.8% | National, with focus on Tier-1 university markets | Medium term (2-4 years) |
| Continued expansion of higher-education enrollment | +1.2% | National, with concentration in Texas, California, Florida | Medium term (2-4 years) |
| Expansion of public-private partnership models | +0.9% | National, with early adoption in California, Indiana, North Carolina | Long term (≥ 4 years) |
| State decarbonization mandates spurring green retrofits | +0.7% | California, New York, Illinois, with spillover to other states | Long term (≥ 4 years) |
| Growth of short-cycle credential programs needing flexible stays | +0.5% | National, with concentration in metropolitan areas | Medium term (2-4 years) |
| Source: Mordor Intelligence | |||
Surge in International Student Numbers
The international student market in the United States continues to show robust growth, driven by increasing enrollments and evolving student preferences. In 2023, international student headcounts surpassed 1.057 million, with analysts projecting Indian enrollments to exceed 500,000 by 2030. While California and New York account for a quarter of all foreign students, states like Texas, Illinois, and Florida are witnessing the most significant growth. In response, service providers are introducing gender-inclusive rooms, culturally tailored amenities, and flexible lease terms that sync with visa cycles. Notably, 73% of US campuses now offer gender-inclusive housing, and 83% allow emotional support animals. This steady demand, particularly from STEM-focused institutions, ensures stable revenue streams and boosts occupancy in secondary markets with strong academic reputations[1].
Rising Institutional and Private Capital Inflows
The US student housing market is witnessing significant investment activity, driven by strong yields and evolving market dynamics. In early 2024, KKR invested USD 1.64 billion to acquire a portfolio from Blackstone, while Greystar committed USD 600 million to three mixed-use campus projects. Global investors, such as CapitaLand Ascott Trust, are attracted by cash yields often exceeding 7% EBITDA. CapitaLand Ascott Trust reported a 99% pre-leasing rate at Standard at Columbia, as noted by hospitalitynet.org. Walker & Dunlop projects USD 8-10 billion in refinancings by 2025, creating opportunities for new entrants to scale. Liquidity is compressing cap rates and encouraging portfolio aggregation, pushing the market closer to institutional standards. These trends underscore the growing maturity and appeal of the US student housing sector.
Continued Expansion of Higher-Education Enrollment
Record-breaking enrollment numbers are reshaping housing dynamics at large public universities. Institutions like the University of Michigan are facing critical student-to-bed ratios, with a reported 1.99 students per bed (costar.com). To address capacity challenges, Georgia Tech is investing USD 117 million in an 860-bed hall, scheduled to open in 2026. Enrollment growth is driven by demographic trends and the expansion of graduate programs, which extend average student stays. Universities are increasingly adopting P3 deals to expand housing without burdening their balance sheets; for example, Florida Atlantic University's USD 117 million plan received swift state approval. These developments are collectively boosting baseline demand across tier-1 and tier-2 campus hubs, signaling a transformative period for university housing strategies.
Expansion of Public-Private Partnership Models
Public-private partnerships (P3s) are emerging as a transformative approach in higher education infrastructure development. UC Merced's USD 1.3 billion P3 successfully delivered 10,000 new beds on time and within budget, demonstrating the feasibility of large-scale projects. Purdue's 1,300-bed initiative employs a 65-year availability-payment structure, enabling the university to oversee residence life while private partners manage execution. American Campus Communities, through its ACE funding model, caps rents below market rates and shifts project risks off university balance sheets. With interest rate stability anticipated in 2025, deal economics are improving, driving an accelerated P3 pipeline nationwide. As flagship schools increasingly integrate P3s into their strategic plans, this model is reshaping the future of campus development.
Restraints Impact Analysis*
| Restraint | (~) % Impact on CAGR Forecast | Geographic Relevance | Impact Timeline |
|---|---|---|---|
| Affordability crisis & persistent supply gap | -1.5% | National, with acute impact in California, New York, Massachusetts | Short term (≤ 2 years) |
| Escalating construction and finance costs | -1.1% | National, with regional variations based on labor markets | Medium term (2-4 years) |
| High cost burden for international students | -0.8% | California, New York, Texas, Massachusetts, Illinois | Medium term (2-4 years) |
| Climate-risk-driven insurance premium spikes | -0.6% | Sun Belt states: Florida, Texas, Arizona, California | Long term (≥ 4 years) |
| Source: Mordor Intelligence | |||
Affordability Crisis & Persistent Supply Gap
The US student housing market is grappling with significant challenges in 2024. Over 40% of four-year students reported housing insecurity, as supply trails new enrollments by tens of thousands of beds. High land prices in coastal metros impede affordable development, forcing students to opt for distant or substandard housing options. Universities are revising zoning codes to allow taller buildings, but entitlement cycle delays slow progress. This shortfall has driven an 11.40% CAGR in shared rooms, with price-sensitive students prioritizing affordability over privacy. Without accelerated construction, rent increases are expected to outpace inflation, further straining the market.
Escalating Construction and Finance Costs
The construction industry continues to face significant challenges as it navigates a complex economic landscape. In 2024, material prices surged, and many regions grappled with a shortage of skilled labor. While interest rates found stability in 2025, they still hovered above levels seen before 2023. This situation has tightened pro-forma yields and pushed back project starts. Developers, in a bid to manage costs, are turning to value-engineering and modular designs. Yet, numerous projects, primed for action, remain on hold, seeking clearer cost insights. These dynamics are shaping the industry's trajectory, moderating short-term supply growth while prolonging occupancy tightness and slowing pipeline diversification.
*Our forecasts treat driver/restraint impacts as directional, not additive. The impact forecasts reflect baseline growth, mix effects, and variable interactions.
Segment Analysis
By Room Type: Private Rooms Drive Premium Positioning
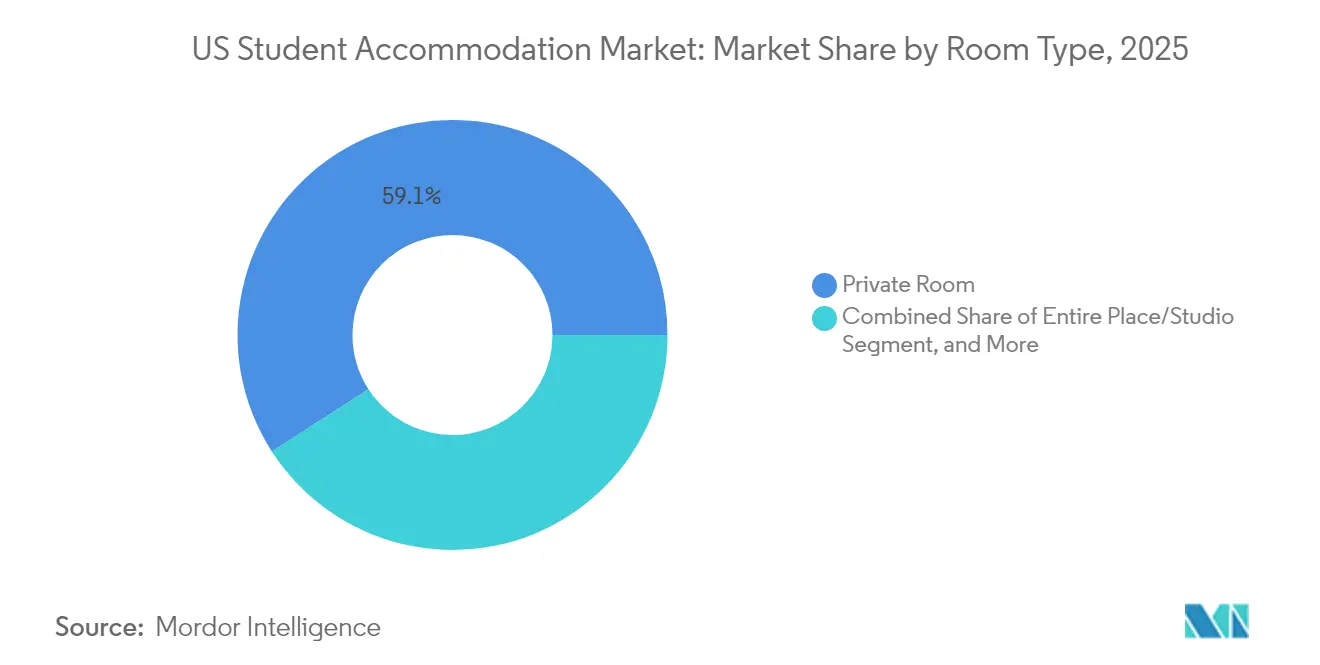
Private rooms held 59.12% of revenue within the US student housing market in 2025, underscoring continued willingness among students to pay for privacy and personal study space. Developers enhance this format with bed-bath parity, built-in desks, and smart-lock access, enabling premium rates that cushion operating margins. Shared rooms, though currently smaller, post the fastest 11.18% CAGR to 2031, propelled by affordability concerns among international and first-generation students. Operators leverage technology to refine roommate matching, which trimmed room-change requests by 35% in recent rollouts, making shared layouts more acceptable.
The US student housing market size for shared rooms is projected to expand sharply as universities encourage density to relieve waitlists. Forward-looking owners design convertible units that switch between double and triple occupancy to capture seasonal surges. Entire place/studio products cater to graduate learners and older undergraduates who prize independence; their demand clusters in large urban metros where off-campus apartments compete directly. Notably, NAA surveys indicate that bed-bath parity is now standard in more than 70% of deliveries post-2023, signalling the rising bar for private-room amenities.

By Student: International Dominance Reshapes Market Dynamics
International students accounted for 77.22% of US student housing market share in 2025, redefining product mix and service expectations. They also drive the highest 8.86% CAGR outlook through 2031 as US visa policies stabilise and overseas incomes rise. Concentrated clusters around West Coast and Northeast schools magnify occupancy and pricing upside in those corridors. Operators integrate multilingual leasing portals, bank-transfer rent options, and cultural programming to enhance retention. Domestic demand remains stable but faces tighter affordability; many local students migrate to peripheral suburbs or opt for shared rooms to manage cost.
US institutions increasingly segment marketing by nationality because Indian, Chinese, and Latin American cohorts demonstrate distinct lease-length and amenity preferences. The US student housing market size for international-focused assets often carries a rental premium of 10-15% relative to mixed properties. Universities respond by adding airport pickup, storage over summer breaks, and visa-status counselling directly in residence halls, amplifying the overall value proposition.
By Institution Type: Non-University Entities Lead Market Share
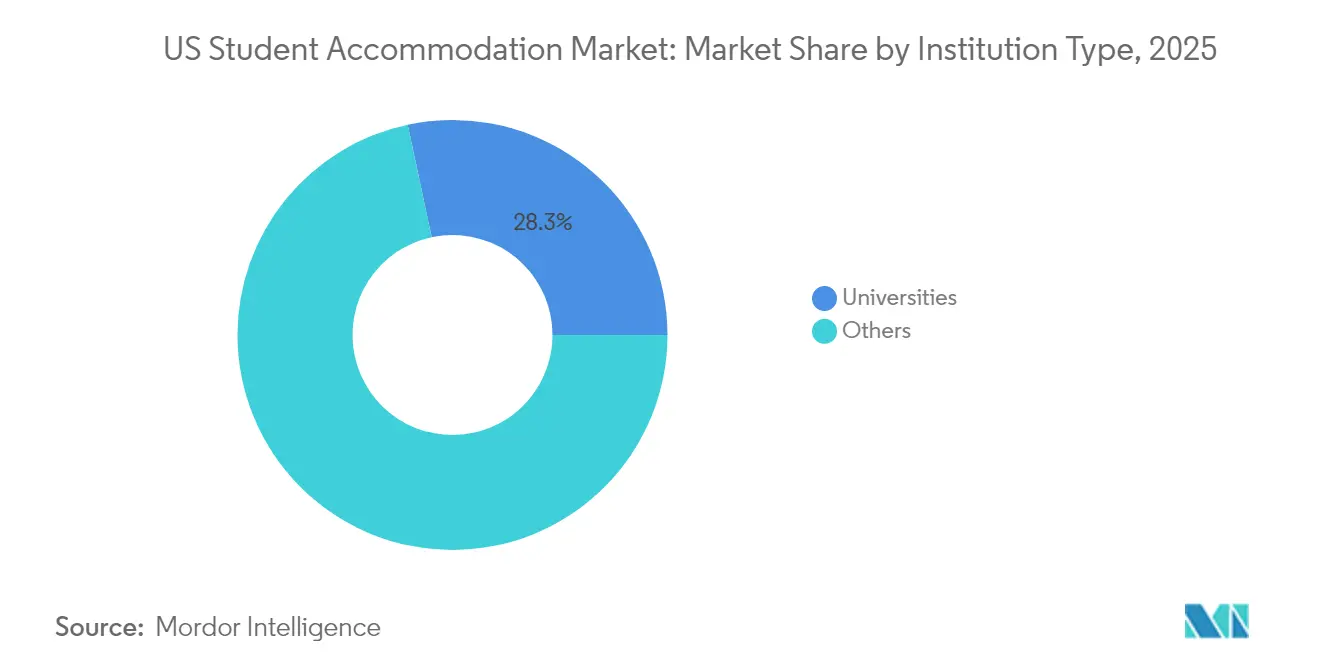
Non-university owners held 71.66% share in 2025, maintaining dominance through operational expertise and access to institutional capital. Yet university-managed stock shows the swiftest 8.58% CAGR through 2031 as campuses recognise the link between residential experience and academic success. High-profile builds like Georgia Tech’s USD 117 million residence hall signal renewed emphasis on in-house projects. Private firms respond by offering turn-key P3 models that let schools preserve program control while outsourcing risk.
The US student housing market size for university-managed property will grow as bond-rating agencies reward schools that improve retention metrics via better housing. Convergence emerges with hybrid structures in which universities hold land while private partners operate under long leases. Such alignments spread risk and encourage technological upgrades such as mobile entry and IoT energy monitoring. Competition between on- and off-campus portfolios stimulates continuous amenity evolution, benefiting residents.
Geography Analysis
The Rest of US block remains the largest contributor at 37.62% in 2025, driven by hundreds of public universities scattered across interior states. Lower land prices and streamlined zoning attract developers who can still command robust rents thanks to limited purpose-built supply. Core Spaces’ entry into North Carolina and LV Collective’s 299-unit College Park scheme typify ongoing interest in these diversified markets. State legislatures passed 50 reform bills in 2024 that ease density restrictions and accelerate approvals, further priming growth.
Illinois is the fastest-growing geography, projected at 10.01% CAGR to 2031. The University of Illinois Urbana-Champaign alone supports more than 56,000 students, while Chicago hosts research institutions that draw sizable graduate cohorts. Moderate land costs permit garden-style projects with amenities rivaling coastal peers, sustaining rental premiums without breaching affordability thresholds. Investors note convenient Midwest access and multimodal transit options that appeal to international families. Gilbane and CBRE’s six-property program demonstrates how portfolio strategies can scale here smoothly.
Coastal heavyweights California, Texas, Florida, New York continue to post absolute demand highs. California’s seismic codes and protracted CEQA reviews inflate budgets; the 4,200-bed Cal Poly venture reflects the megaproject approach required for viability. Texas gains from population inflows and policy relaxations like the “frat house” law removing occupancy caps; this reform widens density possibilities in College Station and Austin. Florida leverages year-round academic calendars and strong Indian enrollment momentum, while New York’s carbon-neutral mandates spur deep-energy retrofits that add ESG appeal. Each mature region now focuses on redeveloping obsolete stock, layering hospitality-style amenities, and incorporating climate-resilient design to maintain competitive edge in the US student housing market.
Mordor Intelligence examines the student accommodation market across diverse other regional markets as well, including Asia and Europe, while also offering granular country-level perspectives for India, United Kingdom, and Germany and more.
Regulatory Landscape
US student accommodation is shaped mainly by state and local land-use rules, building codes, and environmental review regimes, with permitting and density entitlements influencing delivery timelines around campuses. Coastal markets such as California face higher compliance burdens tied to seismic requirements and lengthy CEQA-style reviews, which has supported a market shift toward larger, single-site expansions such as the 4,200-bed Cal Poly project announced in February 2025.
On the operating side, owners must align with federal fair-housing and accessibility expectations, including reasonable-accommodation processes that intersect with campus acceptance of emotional support animals. Retrofit activity is also being pulled by state decarbonization and building-performance mandates in states including California, New York, and Illinois. Industry benchmarking and advocacy frequently run through the National Multifamily Housing Council (NMHC), including its 2025 Student Housing Income and Expense Survey, which informs underwriting assumptions around expenses and NOI.
Value Chain Analysis
The value chain runs from land control (often via university ground leases in P3 structures) to development and design, construction delivery, financing, lease-up and marketing, property operations, and eventual recapitalization or sale. Capital typically comes from a mix of institutional investors and lenders, alongside a refinancing and recapitalization cycle through 2025 referenced in market commentary, while universities use P3 availability-payment or long-lease models to add beds without placing all construction and delivery risk on their balance sheets.
Operators increasingly combine multiple steps across the chain, bringing development, asset management, leasing, and resident-life operations together across portfolios. Large platforms such as American Campus Communities, Greystar, The Scion Group, Landmark Properties, and Core Spaces use scale to standardize procurement, deploy resident apps and analytics for leasing and retention, and execute joint ventures with institutional capital. Sector benchmarks such as NMHC's student housing income and expense survey are used across the chain to normalize operating-cost inputs for owners, lenders, and investors.
Competitive Landscape
The US Student Accommodation Market shows moderate fragmentation, with top operators controlling less than half of the total beds. American Campus Communities, Greystar, and The Scion Group leverage scale to negotiate lower procurement costs and deploy data analytics that lift effective rents. KKR’s USD 1.64 billion purchase from Blackstone vaulted it into the top-ten owners, illustrating how large deals can quickly reshape share. Occupancy leadership increasingly hinges on digital engagement portals and predictive maintenance that reduce downtime and enhance resident satisfaction scores[3].
Strategic moves emphasize P3 pipelines and core-plus acquisitions in secondary markets. Harrison Street’s USD 893 million sale of 8,724 beds to Scion Group realigned both portfolios and freed capital for new development. Greystar’s global diversification, including a USD 1.01 billion Australian buy in 2024, supplies operational insights that feed back into its US assets. Tech-centric challengers use AI to calibrate pricing daily and automate leasing, chipping at incumbents’ margins.
M&A appetite will likely persist because many mid-sized owners lack the scale or ESG credentials now required by lenders and universities. Operators able to integrate occupancy forecasting with sustainability dashboards possess a competitive moat as compliance costs mount. Meanwhile, P3 specialists such as Plenary and Provident Resources Group fill a niche for universities seeking off-balance-sheet solutions. This blend of consolidation and specialist entry keeps the US student housing industry dynamic while pushing service levels higher.
US Student Accommodation Industry Leaders
-
American Campus Communities
-
Greystar Student Housing
-
The Scion Group
-
Landmark Properties
-
Core Spaces
- *Disclaimer: Major Players sorted in no particular order
Market Opportunities and Future Outlook
In the near term, the most actionable whitespace concentrates around supply-protected campuses and flagship markets where leasing velocity is visible ahead of the academic year, while new development is held back by high construction costs and selective financing. As of March 2026, preleasing for the 2026-2027 academic year reached 52.3%, creating room for owners to push earlier leasing, refine revenue management, and prioritize unit mixes aligned with affordability-driven demand, including shared-room options, while still maintaining premium private-room product for parents and international students who pay for privacy.
P3-driven on-campus delivery continues to create pathways for new inventory, repositioning, and redevelopment on university-controlled land, particularly for projects that modernize obsolete stock without expanding a school's balance sheet. Greystar's 2026 financial closes with the University of Mississippi, The University of Texas at Austin (Law School Village), and the University of Pennsylvania show an active pipeline that other operators with campus-facing development capabilities can model. A second opportunity set is decarbonization-led retrofits in states with aggressive climate mandates, including California and New York, where capital programs can pair energy upgrades with amenity modernization to protect occupancy and reduce operating volatility as insurance and utility costs rise.
Recent Industry Developments
- June 2026: Greystar finalized a partnership with the University of Pennsylvania for the 493-bed redevelopment project at 3650 Chestnut Street, marking the second phase of the Sansom Place redevelopment. The P3 led redevelopment expands flagship-campus housing. Strengthens university housing capacity with modern, leased assets and enhances Greystar's on-campus portfolio.
- May 2026: Greystar reached financial close and commenced construction on the 340-bed Law School Village at The University of Texas at Austin. Expansion of on-campus graduate/law student housing. Adds on-campus supply in a key market, reinforcing occupancy and pricing power through a campus-aligned project.
- March 2026: Greystar reached financial close and commenced construction on Phase I of a public-private partnership with the University of Mississippi to deliver 1,282 beds for the 2027-2028 academic year. Large P3 project enabling substantial on-campus bed additions. Accelerates capacity growth and rental revenue through a high-profile university partnership.
Research Methodology Framework and Report Scope
Market Definition and Coverage
For this methodology, the market covers paid housing used by students in the United States during an academic year, including purpose-built and professionally managed options where rent is charged per bed or per unit.
Scope exclusions: This sizing does not count owner-occupied living, informal sublets between students, or temporary hotel stays that are not contracted as student housing.
Segmentation Overview
- By Room Type
- Entire Place/Studio
- Private Room
- Shared Room
- By Student
- Domestic
- International
- By Institution type
- Universities
- Others
- By Region
- Texas
- California
- Florida
- New York
- Illinois
- Rest of US
Data Sources, Market Sizing, and Validation
Desk Research
Desk work starts by building the demand pool and the supply context, then checking whether the same story holds across multiple public signals. We referenced public education and enrollment datasets, including IPEDS through the US Department of Education, US Census releases on population and housing, and macro indicators published by the Bureau of Labor Statistics.
To ground the real estate side, we also used sources such as local planning and permitting dashboards in major university metros, university housing websites, and filings and investor presentations from listed owners and operators. In a few cases, subscribed databases were used for company financials, patent records, and shipment-level import data for furniture and fixtures as supporting context. The desk research sources listed here are illustrative, and additional public documents and datasets were used for collection, cross-checking, and clarification.
Primary Interviews and Surveys
Primary work was used to test occupancy and rent assumptions, and to understand how leasing differs by campus type and seasonality. We spoke with operators, property managers, brokers, and university housing stakeholders across the United States, and we also included views from lenders and service providers to sanity-check pricing, concessions, and development timing.
Distribution of primary research fieldwork respondents
| Company type | Respondent position |
|---|---|
| Top tier: 31% | CXOs: 12% |
| Mid tier: 51% | Functional/Unit leaders: 29% |
| Smaller Players: 18% | Managers: 59% |
Market-Sizing & Forecasting
Market sizing is built using a top-down demand pool reconstruction where student counts by institution type are translated into an addressable housing need, then adjusted for on-campus capacity and off-campus take-up patterns. Once the demand picture is stable, it is converted into value using observed rent levels and typical lease structures, which are then aligned to a calendar-year revenue view.
To keep the model practical, a few key inputs are tracked closely, including total enrollment (domestic and international), the share of students living off campus, new bed additions and the near-term construction pipeline, occupancy and pre-leasing momentum, and effective rent changes after concessions. Results are corroborated through selective bottom-up checks, such as sampled per-bed pricing by market, sampled occupancy ranges by asset class, and owner revenue consistency checks where disclosures are available. When a local data point is missing, we used a range based on comparable university towns and then tightened it after interviews.
Forecasts were built using scenario analysis, where base case rent growth and occupancy are linked to enrollment trends and expected supply deliveries. Assumptions were kept consistent by geography so that growth is explained by clear drivers, not by one-off jumps.
Data Validation & Update Cycle
Model outputs are checked against independent signals, including enrollment direction, new bed delivery expectations, and published leasing season indicators, and any large variances are reviewed by a second analyst. If a metric moves in a way that breaks the expected relationship, such as rising rents with falling occupancy in a stable demand market, the inputs are rechecked and interview follow-ups are triggered.
Reports are refreshed annually, with interim updates when material events can shift enrollment, financing conditions, or the new supply pipeline. Before delivery, a final pass is completed to incorporate the latest public releases and confirm that currency timing and year labels are consistent across tables and charts.
Mordor Intelligence's US Student Accommodation Market Size Measured Against Other Published Estimates
Published values for US student accommodation can vary even when they sound like they are tracking the same space, since each source draws lines differently around what qualifies as student housing revenue. Differences also come from how rents are annualized, whether per-bed or per-unit pricing is used, and how supply additions are timed into a given year.
The main gap comes from mixing asset valuation style totals with operating revenue, and then folding in adjacent rental categories that are not leased to students as a primary customer group, which is why some estimates run higher. In Mordor Intelligence, totals are built as annualized accommodation revenue tied to occupied beds and effective rents, with market-level supply deliveries and enrollment shifts used as the practical checks before forecasting forward.
Benchmark comparison
| Source | Market Size | Gaps in Research Methodology |
|---|---|---|
| Mordor Intelligence | USD 22.80 B (2025) | |
| Global Consultancy A | USD 38.45 B (2024) | Uses a different base year and appears to include a wider definition that can blend student housing with broader rental or valuation-linked totals, which inflates the value relative to rent-driven revenue sizing. |
| Specialist Advisory B | USD 12.10 B (2026) | Focuses on purpose-built student accommodation revenue only, which can exclude university-managed beds and some off-campus professional stock, leading to a smaller total even for a later year. |
Across the three figures, the spread is mostly explained by scope and measurement, meaning revenue versus broader market opportunity or narrower PBSA-only views. By keeping inputs traceable to enrollment, beds, occupancy, and effective rent, the approach stays repeatable and easier to reconcile when clients apply it to specific states or university clusters.
Key Questions Answered in the Report
What is the current size of the US student housing market?
The US student housing market size reached USD 24.56 billion in 2026 and is projected to grow to USD 35.65 billion by 2031 at a 7.74% CAGR.
Why are international students so important to demand?
International enrolment climbed 12% in 2023 and foreigners now account for 77.22% of market demand, bringing longer lease tenures and premium rent payments that stabilise occupancy.
Where is the fastest regional growth expected?
Illinois leads with a 10.01% forecast CAGR to 2031 thanks to expanding flagship campuses and relatively low development costs.
How are universities funding new beds?
Many institutions turn to public-private partnerships such as the USD 1.3 billion UC Merced project, allowing capacity expansion without adding on-balance-sheet debt.
What challenges threaten future growth?
Affordability gaps, construction-cost inflation, and climate-related insurance hikes could trim the national CAGR by as much as 4.0 percentage points according to current restraint estimates.
Which room type shows the fastest growth?
Shared rooms record an 11.18% CAGR through 2031 because cost-sensitive students seek lower rents amid persistent supply constraints.