United States Pension Fund Market Size and Share
Market Overview
| Study Period | 2020 - 2030 |
|---|---|
| Forecast Data Period | 2025 - 2030 |
| Historical Data Period | 2020 - 2023 |
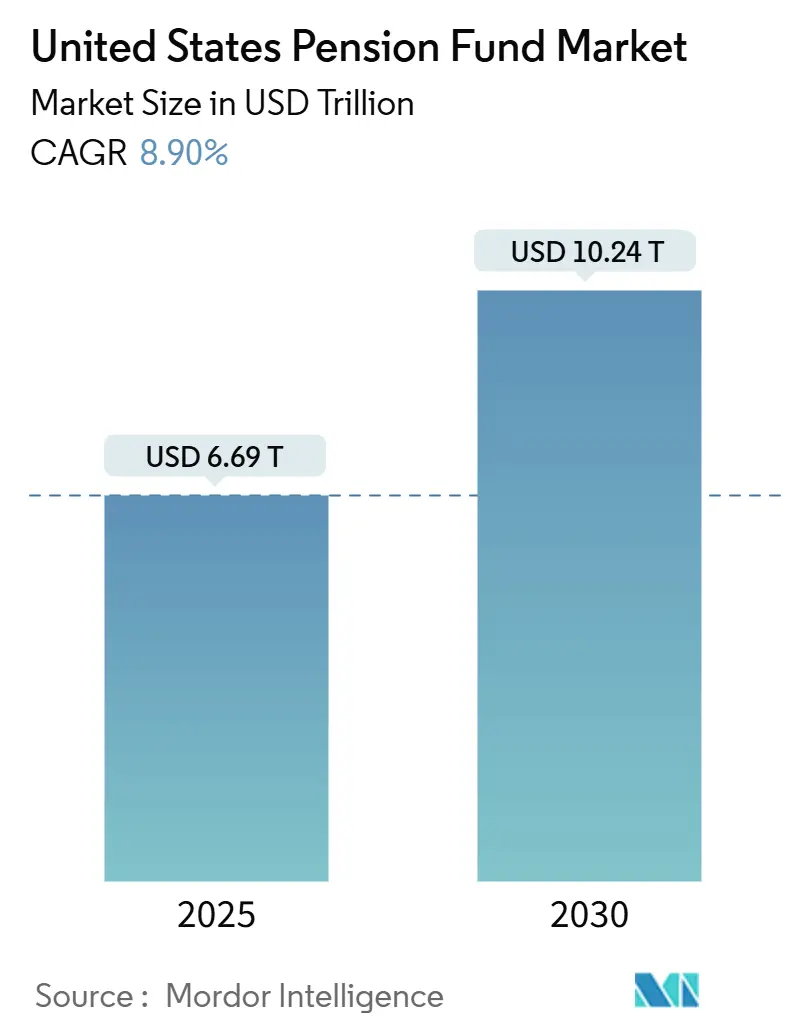
| Market Size (2025) | USD 6.69 Trillion |
| Market Size (2030) | USD 10.24 Trillion |
| Growth Rate (2025 - 2030) | 8.90% CAGR |
| Market Concentration | Low |
Major Players *Disclaimer: Major Players sorted in no particular order Image © Mordor Intelligence. Reuse requires attribution under CC BY 4.0. | |
United States Pension Fund Market Analysis by Mordor Intelligence
The United States Pension Fund market size is valued at USD 6.69 trillion in 2025 and is projected to reach USD 10.24 trillion by 2030, growing at an 8.90% CAGR. This uptrend reflects how sponsors rebalance portfolios toward liability-matching bonds, expand technology adoption, and diversify return engines in response to aging demographics and under-funding risks. Well-funded corporate and public plans shift capital into long-duration fixed income to lock in funded-status gains, while less-funded state systems maintain higher equity exposure and pursue alternative investments for incremental alpha. Technology platforms that automate asset-liability matching accelerate de-risking capabilities across plan sizes, and persistent inflation prompts larger allocations to real assets and Treasury Inflation-Protected Securities (TIPS). Fee-transparency regulations and heightened ESG scrutiny reshape vendor selection processes, pressuring service providers to demonstrate cost discipline and reporting rigor.
Key Report Takeaways
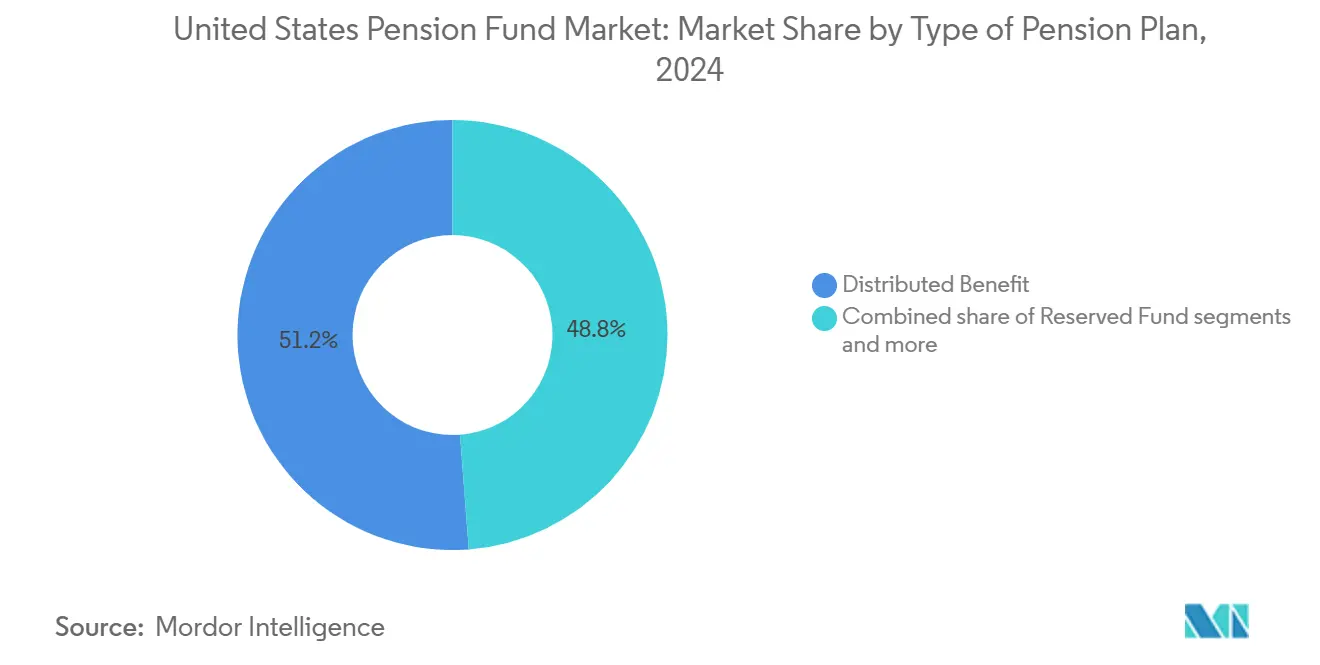
- By type of pension plan, distributed benefit plans led with 51.24% of the United States pension fund market share in 2024, while hybrid plans are expanding at a 5.83% CAGR through 2030.
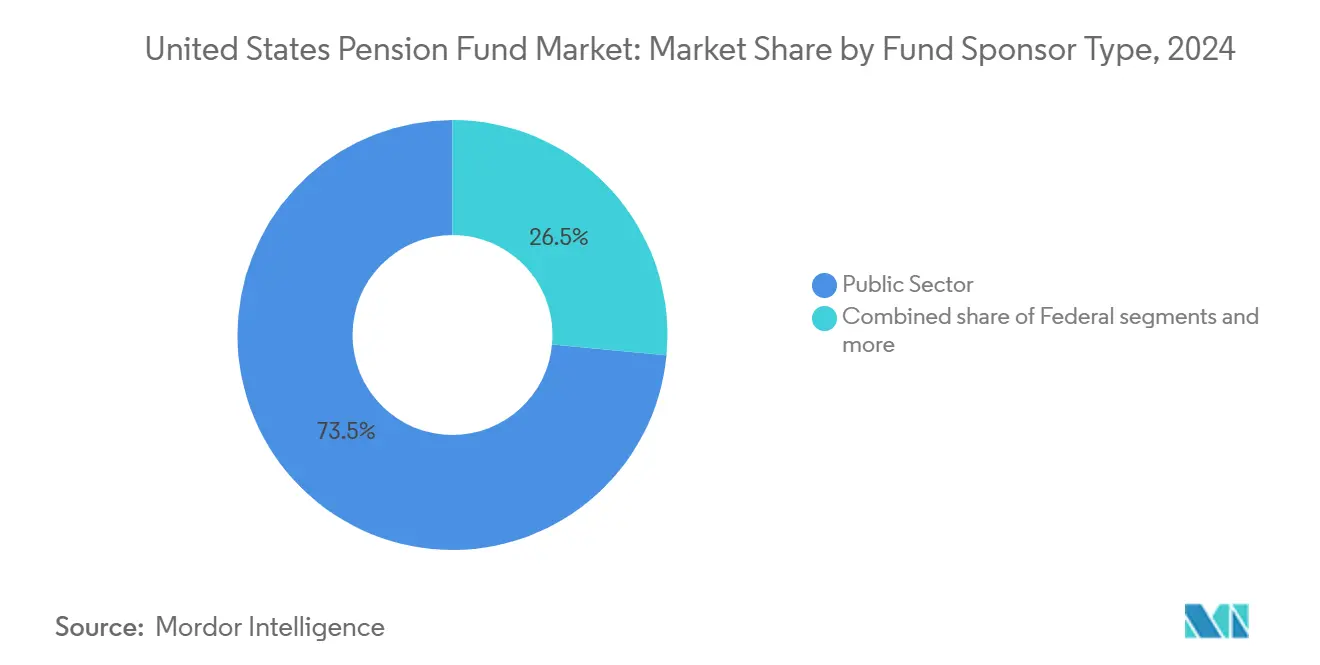
- By fund sponsor type, public sector plans held 73.47% of the United States pension fund market size in 2024 and are rising at a 5.24% CAGR to 2030.
- By asset class, fixed income commanded a 56.76% share of the United States pension fund market size in 2024, whereas alternatives are set to advance at a 9.87% CAGR.
- By geography, the South region accounted for 34.39% of the United States pension fund market size in 2024, while the West is forecast to grow the fastest at a 3.87% CAGR.
United States Pension Fund Market Trends and Insights
Drivers Impact Analysis*
| Driver | (~) % Impact on CAGR Forecast | Geographic Relevance | Impact Timeline |
|---|---|---|---|
| Rising funded-status-driven de-risking activity | +1.2% | National, concentrated in well-funded state plans | Medium term (2-4 years) |
| Escalating adoption of alternative assets for alpha generation | +1.8% | National, led by large public and corporate plans | Long term (≥ 4 years) |
| Expansion of liability-driven-investment (LDI) technology platforms | +0.7% | National, early adoption in Northeast and West | Short term (≤ 2 years) |
| Growing demand for inflation-hedging assets amid stickier CPI | +0.9% | National, particularly South and Midwest regions | Medium term (2-4 years) |
| Regulatory push for improved fee transparency & ESG disclosure | +1.4% | National, particularly among public sector sponsors | Medium term (2–4 years) |
| AI-enabled analytics improving asset-liability modelling accuracy | +1.8 | National, led by large public and corporate plans | Short term (≤ 2 years) |
| Source: Mordor Intelligence | |||
Rising Funded-Status-Driven De-Risking Activity
Funded ratios above 90% encourage many plans to rotate from growth assets into bonds that match liability duration [1]CalPERS, “CalPERS Will Increase Private Markets Investments,” calpers.ca.gov. . Corporate sponsors reduce equity allocations to curb balance-sheet volatility and create headroom for risk-transfer exercises. Demand for long-duration Treasuries and STRIPS rises accordingly, tightening spreads and lowering reinvestment risk for plans nearing full funding. The trend boosts take-up of custom liability benchmarks that integrate cash-flow projections and interest-rate hedges. As funded levels fluctuate with market moves, dynamic glide-path frameworks recalibrate risk exposures without relying on ad-hoc asset-allocation committees. This disciplined posture enhances balance-sheet resilience but narrows upside return potential, necessitating refined scenario modeling to sustain contribution affordability.
Escalating Adoption of Alternative Assets for Alpha Generation
Alternatives now comprise 40% of aggregate pension holdings, up from 35% in 2024, as trustees look beyond public markets for performance tailwinds. Private-equity funds sit at the core of the build-out, with target weights climbing to 15–25% for large public systems. Illiquidity premiums, differentiated cash-flow profiles, and inflation-linked income streams make infrastructure and real estate particularly appealing. CalPERS aims to bring its private-market exposure to 30% of total assets by 2027 to capture this premium. Broader deployment of secondaries programs improves liquidity management and vintage balance, mitigating the valuation lags that accompany private assets. Nonetheless, heavier fee structures, complex governance, and opaque pricing keep boards focused on cost transparency and peer benchmarking.
Expansion of Liability-Driven Investment Technology Platforms
Cloud-based analytics now integrate plan liabilities, real-time market data, and automated hedge execution to streamline LDI workflows. State Street’s AI-enabled engine, recently deployed across several public systems, calibrates duration hedges intraday and rebalance triggers in response to yield curve shifts [2]: State Street, “Pension Fund Technology Trends,” statestreet.com.. Smaller sponsors benefit from modular implementations that slot into existing custodial systems, circumventing the capital intensity of legacy actuarial software. Portfolio dashboards present forward-looking funded-status projections that incorporate mortality, salary growth, and contribution policy changes, improving governance speed. By shortening feedback loops, these tools empower investment committees to revise target allocations on a quarterly cadence, a cadence historically reserved for the largest plans. Early adopters reap operational efficiencies but must navigate heightened cybersecurity requirements associated with cloud connectivity.
Growing Demand for Inflation-Hedging Assets Amid Stickier CPI
Inflation prints persisting above the Federal Reserve’s 2% target rekindle appetite for TIPS, real estate, and infrastructure projects with contractual escalators [3]Federal Reserve Bank of St. Louis, “10-Year Treasury Inflation-Indexed Security,” stlouisfed.org. . Allocations to TIPS climbed to 8–12% of fixed-income buckets in 2024 from 3–5% historically. The Teacher Retirement System of Texas raised its real-assets exposure to 18% to secure cash flows that track cost-of-living adjustments. Commodity-adjacent infrastructure, such as energy logistics and renewable power, serves as both a hedge and a diversifier against equity drawdowns tied to policy tightening cycles. While these asset classes can dampen funded-status volatility, execution challenges arise around valuation, fee benchmarking, and political sensitivity to emissions profiles.
Restraints Impact Analysis*
| Restraint | (~) % Impact on CAGR Forecast | Geographic Relevance | Impact Timeline |
|---|---|---|---|
| Rising scrutiny of fee drag from private-market allocations | −0.8% | National, particularly among public sector sponsors | Short term (≤ 2 years) |
| Persistent under-funding in several state & local plans | −1.1% | Concentrated in Midwest and Northeast legacy industrial states | Long term (≥ 4 years) |
| Political headwinds against ESG-labelled strategies | −0.6% | Predominantly Southern and some Midwestern states | Medium term (2–4 years) |
| Liquidity stress triggered by ageing demographics & retiree outflows | −0.9% | Nationwide, with higher impact in states with ageing public workforces | Long term (≥ 4 years) |
| Source: Mordor Intelligence | |||
Rising Scrutiny of Fee Drag from Private-Market Allocations
High fee layers across private-equity, venture, and fund-of-funds structures erode net returns just as wage inflation elevates payout obligations [4]Securities and Exchange Commission, “SEC Press Release 2024-89,” sec.gov. . Several legislatures now require granular cost disclosure that itemizes carried interest, transaction fees, and monitoring fees. The Illinois State Board of Investment’s USD 1.2 billion fee line item in 2024 triggered hearings on whether alternative allocations justify premium pricing. Trustees weigh passive equity and direct-co-investment pathways to compress cost ratios without ceding exposure to illiquidity premiums. Negotiated “most-favored-nation” clauses and performance hurdles are gaining popularity as monitoring tools. However, restricting access to top-quartile managers could lower long-term return targets, forcing higher employer contributions in an already tight fiscal environment.
Persistent Under-Funding in Several State & Local Plans
Twenty-three state systems remain below the 70% funded-ratio threshold, constraining risk budgets and impeding glide-path progression toward de-risked portfolios. Liquidity buffers rise as benefit outflows surpass contributions, compelling overweight positions in cash and core bonds and limiting allocations to return-seeking assets. Kentucky Teachers’ 58% funded ratio typifies the bind: trustees hold 40% in liquid assets despite historically higher equity allocations among better-funded peers. As unfunded liabilities crowd out operating budgets, legislatures increase employer and sometimes employee contributions, stoking political resistance that accentuates governance instability. The cycle reinforces conservative investment postures, prolonging the time horizon required for full funding.
*Our forecasts treat driver/restraint impacts as directional, not additive. The impact forecasts reflect baseline growth, mix effects, and variable interactions.
Segment Analysis
By Type of Pension Plan: Hybrid Models Bridge Traditional Divide
Hybrid plans contribute a smaller slice of the United States Pension Fund market but record the highest 5.83% CAGR as sponsors seek a blend of defined-benefit security and defined-contribution portability. Distributed Benefit plans still command 51.24% of the United States Pension Fund market share, reflecting the legacy strength of public and unionized structures. Hybrid schemes employ variable annuities or cash-balance formats that cap sponsor risk while offering member upside linked to asset performance. The Federal Thrift Savings Plan’s automatic enrollment and lifecycle design demonstrate this convergence. Implementation requires robust administrative systems to track separate accrual rules, yet sponsors accept the complexity to align benefit promises with changing workforce preferences. Younger employees value account-based transparency, while nearing-retirement cohorts prize guaranteed minimums, making hybrids attractive across demographics.
Employers also benefit from clearer budgeting because contribution rates adjust based on formula ceilings rather than market volatility. As actuarial techniques and recordkeeping platforms mature, adoption barriers fall, paving the way for broader uptake across mid-sized corporate plans. In the longer horizon, hybrids may gradually chip away at the dominance of traditional formulas as taxation and regulatory frameworks adapt. Still, switching costs, collective bargaining constraints, and legal protections of accrued benefits will temper the pace of conversion. Consultants forecast that hybrid penetration could reach 20% of total participants by 2030 if legislative incentives remain supportive. The sustained rise in hybrid enrollment underscores its role as a pragmatic compromise in the evolving United States Pension Fund market.


By Fund Sponsor Type: Public Sector Dominance Faces Fiscal Constraints
Public Sector sponsors hold 73.47% of the United States Pension Fund market size, leveraging payroll tax inflows and statutory funding channels to maintain defined-benefit promises. Growth at a 5.24% CAGR reflects a mix of contribution inflows tied to expanding public payrolls and investment income. Federal systems like the USD 840 billion Thrift Savings Plan illustrate how scale compresses administrative and investment costs. Corporate Single-Employer plans remain significant but trend toward risk-transfer deals such as annuity buy-outs and lump-sum windows as funded positions improve. Multi-employer plans face divergent outcomes: some enjoy strong craft-union support, while others suffer from declining contributing employers in legacy industries. Church and non-profit plans occupy niche spaces, operating under ERISA exemptions that shape unique funding rules.
Political perspectives on ESG mandates, fee transparency, and social-policy investing increasingly influence public plan governance. Texas and Florida enacted statutes restricting ESG-labeled strategies, narrowing the investable universe for their retirement systems. Conversely, West Coast sponsors emphasize climate-risk integration, illustrating regional policy divergence within the United States Pension Fund market. Despite fiscal headwinds, public sponsors are unlikely to relinquish their dominance owing to statutory obligations and the sheer scale of existing liabilities. Nonetheless, budget pressures may spur hybrid or cash-balance overlays for new hires, incrementally lowering future cost variability.
By Asset Class Allocation: Alternatives Drive Portfolio Evolution
Fixed Income retains a 56.76% share of the United States Pension Fund market size because liability-hedging remains foundational to discount-rate management. However, Alternatives post a robust 9.87% CAGR as trustees hunt for yield premium in private equity, infrastructure, and real estate. Equity allocations still capture market-beta upside but face trimming as funded ratios improve and de-risking tracks glide-paths. Within real assets, renewable-energy projects and long-lease transportation assets gain favor, offering inflation-linked cash flows that sync with cost-of-living adjustments. Improved secondaries markets provide exit avenues that address liquidity concerns, making private holdings more palatable even for mid-size plans. Cash and short-term pools stay modest, acting mainly as transition buffers during rebalancing or benefit-payment spikes. Operational complexity grows with each incremental allocation to less-liquid strategies, driving demand for specialized staff, governance committees, and risk systems capable of look-through analytics. Larger plans benefit from in-house expertise and direct-investment platforms that economize on fees. Smaller sponsors often access alternatives through fund-of-funds or co-mingled vehicles, accepting higher fee stacks in exchange for diversified exposure and manager selection. The structural shift toward alternative assets appears durable, anchored by lower forward-looking public-market return expectations.
Geography Analysis
The South continues to serve as the largest regional contributor, commanding 34.39% of the United States Pension Fund market. This dominance is supported by sustained population inflows, steady payroll expansion, and a rising base of private-sector employment. Rapid demographic growth across states like Texas and Florida has strengthened pension contribution volumes and broadened fund diversification opportunities. Institutional investors in the South are also focusing on balancing traditional allocations with moderate exposure to infrastructure and energy-linked assets. These patterns reinforce the region’s long-term stability while highlighting its evolving role in national retirement capital formation.
The West, however, leads in growth momentum, advancing at a CAGR of 3.87%, underpinned by robust technology-sector pension creation and forward-looking investment mandates. States such as California and Washington are actively setting the pace through climate-risk integration, innovation-driven portfolios, and broader private-market participation. California’s CalPERS and CalSTRS continue to define national benchmarks for ESG inclusion, governance transparency, and global diversification. Meanwhile, the Washington State Investment Board’s use of AI-driven optimization illustrates a frontier mindset that merges quantitative precision with strategic agility. Collectively, these initiatives position the Western region as the laboratory of pension modernization and data-informed policy experimentation in the United States.
The Northeast and Midwest present contrasting characteristics shaped by demographic maturity and industrial structure. The Northeast, home to roughly one-third of national assets, faces challenges from aging populations and legacy under-funding across public systems. Yet its proximity to capital markets enables superior access to financial-sector expertise and alternative-asset deal flow. The Midwest, representing 27.0% of total pension assets, maintains a conservative stance closely aligned with its manufacturing and agricultural cycles. Together, these regions demonstrate how fiscal health, sectoral orientation, and political climate collectively craft a diverse mosaic of investment doctrines across the United States Pension Fund landscape.
Competitive Landscape
The United States pension fund market is highly fragmented, with the largest five funds managing only a small portion of total assets. This structure creates space for specialized asset managers, technology vendors, and fintech entrants to compete and grow. CalPERS stands out by leveraging its size to pursue direct private equity and co-investment strategies, streamlining exposure while avoiding traditional fund-of-funds fees. Meanwhile, the Federal Thrift Savings Plan offers low-cost, participant-driven index options supported by automated rebalancing to maintain efficiency. Strategic service providers differentiate by offering integrated data platforms that unify custody, performance, compliance, and ESG analytics.
Technology is increasingly becoming a gatekeeper for market access and competitive relevance. State Street’s AI-powered liability-driven investment (LDI) tools, embedded in several mid-sized public systems, represent a new standard for real-time risk and duration management. Other vendors are exploring tokenization of private-market assets, aiming to unlock fractional liquidity in traditionally illiquid segments. Transparent dashboards now empower pension boards to benchmark provider fees more accurately, fueling greater scrutiny and pressure on cost structures. These tools are reshaping how services are evaluated and procured across the market.
Ongoing macroeconomic volatility and rising political pushback against ESG-labelled strategies are shifting advisory dynamics. Smaller, agile consulting firms are gaining traction by offering compliance-customized screening solutions that avoid limiting investment opportunity sets. The market increasingly favors holistic service models that combine asset management with regulatory expertise and operational outsourcing. In contrast, passive and beta-driven offerings face mounting fee compression as transparency becomes standard. As pension plans navigate these shifts, adaptability and integration are becoming essential traits for long-term partners in the ecosystem.
United States Pension Fund Industry Leaders
CalPERS
Federal Thrift Savings Plan
CalSTRS
New York State Common Retirement Fund
Teacher Retirement System of Texas
- *Disclaimer: Major Players sorted in no particular order

Recent Industry Developments
- October 2024: CalPERS announced a USD 15 billion commitment to private markets over the next 3 years, targeting infrastructure and real estate investments to reach 30% alternative allocation by 2027.
- September 2024: Federal Thrift Savings Plan implemented AI-enhanced portfolio rebalancing across its USD 840 billion in assets, enabling real-time optimization of lifecycle fund allocations based on market conditions and participant demographics.
- August 2024: New York State Common Retirement Fund completed a USD 2.5 billion private equity secondary transaction, selling stakes in 47 funds to improve portfolio liquidity and reduce vintage year concentration risk.
- July 2024: Teacher Retirement System of Texas expanded its real assets allocation to 18% of total portfolio through a USD 3.6 billion infrastructure investment program focused on renewable energy and transportation projects.


United States Pension Fund Market Report Scope
A pension fund is an investment made to provide for retirement income. They typically have large amounts of money to invest in listed and private companies. The United States Pension Fund Industry Is Segmented Based On The Type Of Pension Plan (Distributed Contribution, Distributed Benefit, Reserved Fund, And Hybrid). The Report Offers Market Size And Forecasts For The United States Pension Funds Market In Terms Of Value (USD) For All The Above Segments.
| Distributed Contribution |
| Distributed Benefit |
| Reserved Fund |
| Hybrid |
| Public Sector |
| Corporate (Single-Employer) |
| Multi-employer |
| Federal |
| Other (Non-profit & Church) |
| Equities |
| Fixed Income |
| Alternatives |
| Real Assets |
| Cash & Short-term |
| Northeast |
| Midwest |
| South |
| West |
| By Type of Pension Plan | Distributed Contribution |
| Distributed Benefit | |
| Reserved Fund | |
| Hybrid | |
| By Fund Sponsor Type | Public Sector |
| Corporate (Single-Employer) | |
| Multi-employer | |
| Federal | |
| Other (Non-profit & Church) | |
| By Asset Class Allocation | Equities |
| Fixed Income | |
| Alternatives | |
| Real Assets | |
| Cash & Short-term | |
| By Geography | Northeast |
| Midwest | |
| South | |
| West |


Key Questions Answered in the Report
What is the projected value of the United States Pension Fund market by 2030?
The United States Pension Fund market is expected to reach USD 753.18 billion by 2030, reflecting a 4.63% CAGR.
Which pension plan type is growing the fastest through 2030?
Hybrid structures show the quickest expansion, advancing at a 5.83% CAGR as sponsors seek a balance between benefit certainty and cost control.
Why are alternative assets gaining share in pension portfolios?
Trustees allocate more to private equity, infrastructure, and real estate to capture illiquidity premiums and offset lower expected public-market returns.
What regional factor is driving growth in the West?
Technology-sector employment and progressive investment policies in states like California and Washington are propelling the West’s 3.87% CAGR leadership.
How are fee-transparency rules affecting investment strategies?
Greater disclosure requirements push sponsors toward lower-cost structures, direct investments, and tighter monitoring of alternative-asset fees.
Page last updated on:


