United States Short-term Vacation Rental Market Size and Share
Market Overview
| Study Period | 2022 - 2031 |
|---|---|
| Forecast Data Period | 2026 - 2031 |
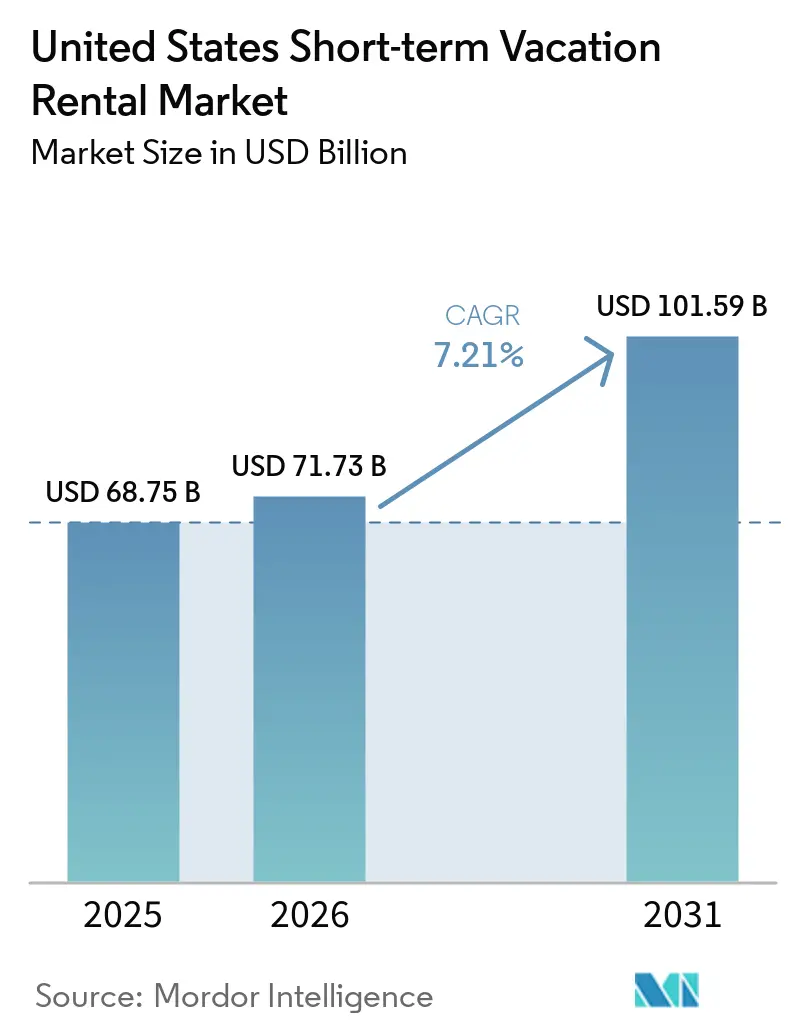
| Base Year Market Size (2025) | USD 68.75 Billion |
| Market Size (2026) | USD 71.73 Billion |
| Market Size (2031) | USD 101.59 Billion |
| Growth Rate (2026 - 2031) | 7.21% CAGR |
| Market Concentration | Medium |
Major Players *Disclaimer: Major Players sorted in no particular order Image © Mordor Intelligence. Reuse requires attribution under CC BY 4.0. | |
United States Short-term Vacation Rental Market Analysis by Mordor Intelligence
The United States Short-term Vacation Rental Market size is expected to grow from USD 68.75 billion in 2025 to USD 71.73 billion in 2026 and is forecast to reach USD 101.59 billion by 2031 at 7.21% CAGR over 2026-2031.
The United States vacation rental market is expanding because domestic short getaways remain strong, private home stays continue to gain preference over standard hotel formats, and travelers are staying longer than before. Owners are also upgrading inventory with better interiors, smart home features, and dynamic pricing tools, which is raising listing quality and supporting pricing discipline across the United States vacation rental market. The supply side is also changing as platform concentration and professional management are narrowing the gap between independent hosts and scaled operators, especially in high-demand resort corridors. Even with rising listings and softer inbound travel, revenue per available rental remained higher in April 2026, which shows that the United States vacation rental market is still using pricing tools and product differentiation to manage a more crowded supply base.[1]U.S. Travel Association, “U.S. Travel Forecast Spring 2026, Volume Data,” U.S. Travel Association, ustravel.org
Key Report Takeaways
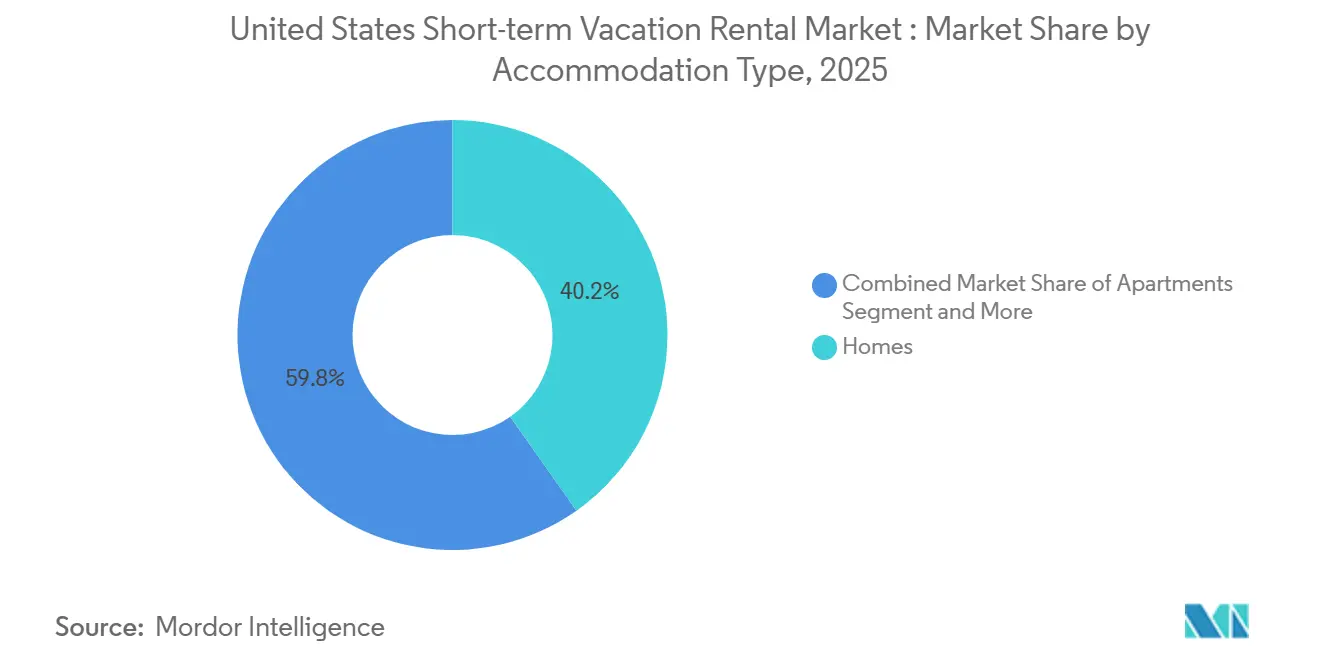
- By accommodation type, Homes accounted for 40.2% of the United States vacation rental market in 2025, while Condominiums and Resort Condominiums recorded the highest projected CAGR of 7.9% through 2031.
- By booking channel, OTAs and platform-based bookings held 81.4% of the United States vacation rental market share in 2025, while Direct Booking Websites are forecast to expand at an 8.5% CAGR through 2031.
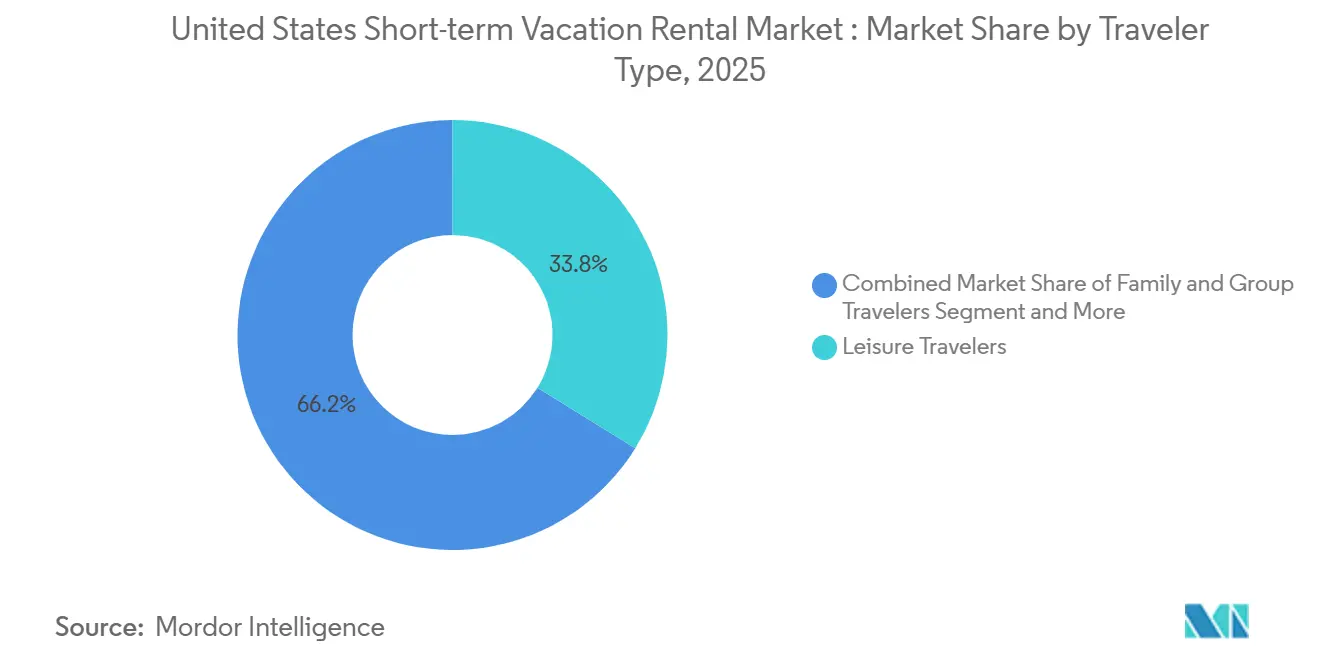
- By traveler type, Leisure Travelers accounted for 33.8% of market revenue in 2025, while Digital Nomads and Remote Workers are projected to grow at an 8.9% CAGR through 2031.
- By stay duration, Medium Stay 4-6 nights captured 30.7% of market revenue in 2025, while Extended Short-Term Stay 14-30 nights is forecast to advance at a 9.3% CAGR through 2031.
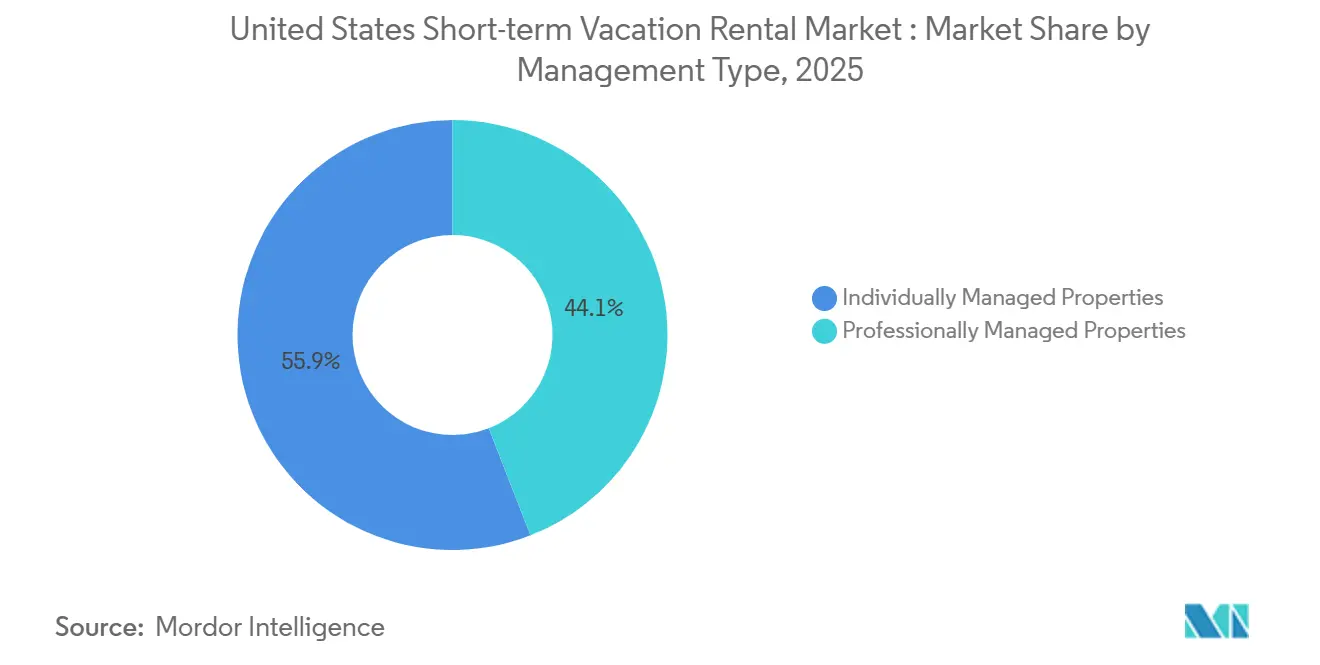
- By management type, Individually Managed Properties held 55.9% of market revenue in 2025, while Professionally Managed Properties are projected to grow at an 8% CAGR through 2031.
- By geography, the South held 36.7% of market revenue in 2025, while the West is forecast to grow at a 9.2% CAGR through 2031.
Note: Market size and forecast figures in this report are generated using Mordor Intelligence’s proprietary estimation framework, updated with the latest available data and insights as of January 2026.
United States Short-term Vacation Rental Market Trends and Insights
Drivers Impact Analysis*
| Drivers | (~) % Impact on CAGR Forecast | Geographic Relevance | Impact Timeline |
|---|---|---|---|
| Domestic Short-Getaway Resilience | +1.5% | National, with outsized gains in South and Mountain West | Short term (≤ 2 years) |
| Online Booking Platform Dominance | +1.2% | National | Medium term (2-4 years) |
| Group-Friendly Larger Homes Outperformance | +0.8% | National, concentrated in beach and mountain resort corridors | Medium term (2-4 years) |
| Premiumization of Lodging Choices | +0.9% | National, with early gains in Florida, California, and Rocky Mountain states | Long term (≥ 4 years) |
| Flexible Payment Tools Improving Conversion | +0.6% | National | Short term (≤ 2 years) |
| Compliant Urban Supply Scarcity Lifting Rates | +0.5% | Major urban markets, New York, San Francisco, Los Angeles, Boston | Medium term (2-4 years) |
| Source: Mordor Intelligence | |||
Domestic Short-Getaway Resilience Fuels Baseline Demand
Domestic travel remains the main demand base for the United States vacation rental market, and the U.S. Travel Association forecasts total travel spending to reach USD 1.37 trillion in 2026, with domestic travel accounting for 87% of that total (approximately USD 1.20 trillion). This domestic weighting provides the United States vacation rental market with better protection from the weaker inbound travel environment, which is affecting gateway city demand more directly. Stay length also improved, with average United States vacation rental stays increasing from 4.0 nights to 4.42 nights in 2025, strengthening booking economics without requiring the same degree of occupancy growth. Listings that can attract medium- and extended-stay guests are therefore capturing more guest spending, especially from travelers who value privacy, kitchen access, and flexible trip patterns. This pattern supports steadier demand throughout the year and gives the United States vacation rental market a broader base than a model built solely on peak-season leisure trips.
Online Booking Platform Dominance Redefines Distribution Power
Online channels are shaping how demand is captured in the United States vacation rental market, and OTAs accounted for 81.4% of booking revenue in 2025. Airbnb reported Q1 2026 revenue of USD 2.7 billion, up 18% year over year, and Gross Booking Value of USD 29.9 billion, up 19% year over year, showing how large platforms continue to deepen their transactional role. Airbnb also disclosed that 63% of total nights booked in Q1 2026 came through the mobile app, indicating stronger app-based repeat behavior and lower friction in the booking flow. As platforms expand their role from listing distribution to trip planning and in-app services, direct channels face a tougher environment for first-time acquisition, even as repeat guest migration remains possible. This leaves the United States vacation rental market more dependent on platform visibility, ranking systems, and app-led customer retention than it was only a few years ago.
Group-Friendly Larger Homes Outperform Across All Rate Tiers
Homes led with 40.2% revenue share in 2025, which shows that group travel remains one of the strongest demand anchors in the United States vacation rental market. A 5-bedroom home priced at USD 750 per night can host 10 guests at USD 75 per person, and that group cost logic continues to compare well against multiple hotel rooms in leisure destinations. The appeal is not only price, because travelers also gain kitchen use, shared living areas, and private outdoor space that hotels cannot match at the same scale across most resort corridors. AvantStay’s portfolio of more than 3,000 properties across 65 markets and its Nexo Residences entry in North Miami Beach show how operators are actively building product around group amenity demand, including smart access, high speed internet, and resort-style common features. This keeps larger home formats at the center of the United States vacation rental market, especially in beach and mountain destinations where shared-use travel is a stable booking pattern.
Premiumization Upgrades Yield Across the Inventory Pyramid
Premium and luxury inventory are raising the revenue ceiling of the United States vacation rental market, even when the demand base still includes broad mid-market leisure travelers. Rentals for luxury apartment bookings rose from 9,724 to 21,354 in 2025, while total booking value increased from EUR 12.5 million to EUR 33.8 million, equivalent to USD 13.7 million to USD 37.2 million using the conversion already provided in the input. ELP Luxury Vacations surpassed USD 700 million in assets under management by March 2026. They expanded through American Express Select Homes and Retreats and Marriott Homes and Villas, which shows stronger institutional distribution for premium stock. The premium shift is not limited to ultra-luxury homes, because mid-tier hosts investing USD 15,000 to USD 20,000 in upgrades captured 15% to 25% booking premiums. That means the United States vacation rental market is seeing a broader quality upgrade cycle, in which better design, amenities, and service can improve rate realization across more than just top-end inventory.
Restraints Impact Analysis*
| Restraints | (~) % Impact on CAGR Forecast | Geographic Relevance | Impact Timeline |
|---|---|---|---|
| City-Level Permit Caps and Enforcement | -0.8% | Urban and coastal markets, New York City, Los Angeles, San Francisco, Honolulu | Long term (≥ 4 years) |
| Supply Growth Outpacing Demand in Many Markets | -0.9% | National, with acute pressure in Florida, Tennessee, and Pacific Northwest | Medium term (2-4 years) |
| All-In Price Disclosure Compressing Fee-Led Yield | -0.5% | National | Short term (≤ 2 years) |
| Softening Inbound Demand in Gateway Markets | -0.6% | Coastal and border-adjacent gateway markets, Miami, New York, Seattle, San Diego | Medium term (2-4 years) |
| Source: Mordor Intelligence | |||
City-Level Permit Caps Constrain Compliant Supply
Municipal regulation remains one of the strongest restraints on the United States vacation rental market, with more cities adopting permit caps, primary-residency rules, and density controls after 2024. Newberg, Oregon, set its 2026 vacation rental home cap at 187 units, equal to 2% of city households, under Ordinance No. 2025-2935 that took effect in September 2025.[2]City of Newberg, Oregon, “Ordinance No. 2025-2935, Vacation Rental Home Cap,” City of Newberg Community Development, newbergoregon.gov South Lake Tahoe also enacted a 45-day moratorium on vacation home rental permits in April 2025 while it finalized longer-term restrictions. These measures reduce compliant supply growth, raise entry barriers, and increase the operating value of already permitted inventory. The United States vacation rental market, therefore, faces a more uneven expansion path because locations with tighter rules can support higher pricing while simultaneously limiting the number of legally available listings.
Supply Growth Outpacing Demand Compresses Per-Listing Economics
Supply growth remains a broad concern for the United States vacation rental market because active short-term rental listings reached 1.6 million by December 2025 and are projected to rise to 1.77 million in 2026, while demand growth slowed to 4.1% year over year. This gap is not evenly distributed, as markets with supply growth exceeding 10% were already experiencing lower occupancy levels. The pressure falls most heavily on undifferentiated listings in secondary markets that benefited from earlier demand spikes but lack the same destination pull or pricing power as stronger resort corridors. Hosts without revenue management tools are especially exposed, and the draft noted that 64% of Airbnb hosts in the United States did not use a Property Management System in 2025. This makes the United States vacation rental market more competitive at the listing level, even when top-line market growth still looks healthy on an aggregate basis.
*Our forecasts treat driver/restraint impacts as directional, not additive. The impact forecasts reflect baseline growth, mix effects, and variable interactions.
Segment Analysis
By Accommodation Type: Homes Anchor Revenue, Condominiums Redefine Resort Flexibility
Homes accounted for 40.2% of the United States vacation rental market size in 2025, making them the largest accommodation category. That lead reflects the strength of group travel, where multi-bedroom layouts, full kitchens, and private outdoor space remain difficult for hotel formats to replicate at comparable trip economics. The average party size of 4 to 6 travelers also supports homes, as the cost can compare favorably with two adjacent hotel rooms, while still offering more usable shared space, according to the draft. This gives homes a durable demand base across family trips, reunion travel, and leisure groups in beach and mountain destinations. In the United States vacation rental industry, this segment remains the core revenue anchor because it aligns closely with the way domestic travelers organize shared leisure trips.
Condominiums and Resort Condominiums are forecast to grow at a 7.9% CAGR through 2031, the fastest rate among accommodation formats. AvantStay’s Nexo Residences partnership in North Miami Beach aligns with this direction by combining flexible short-term occupancy with purpose-built operations, smart key access, strong connectivity, and resort-style amenities. This format gives professional managers more scalable operations than scattered single-asset homes while still preserving the home-like flexibility guests want. Apartments continue to serve urban and bleisure travelers, cabins and cottages remain tied to nature-driven demand, and villas and luxury homes cater to the highest-spending travelers. The United States vacation rental market is therefore broadening its supply mix, but homes still account for current revenue, while condominiums are becoming the more scalable growth path.


By Booking Channel: OTA Gravity Intensifies, Direct Bookings Mount a Structural Counter
OTAs and platform-based bookings held 81.4% of the United States vacation rental market share in 2025, underscoring the continued concentration of guest acquisition at the platform layer. This dominance reflects the continued ability of large booking apps to capture first-time demand, support last-minute travel, and hold user attention through strong mobile booking flows. Airbnb alone accounted for 50% of United States short-term rental reservations in Q1 2026, up from 46% a year earlier. With 63% of total nights booked through the mobile app in Q1 2026, Airbnb is also reinforcing the app-based booking habit that supports repeat use and greater platform stickiness. That makes distribution in the United States vacation rental market increasingly dependent on visibility inside platform search systems rather than only on property-level brand building.
Direct Booking Websites are projected to grow at a 8.5% CAGR through 2031, making them the fastest-growing channel, though they still trail OTAs by a large margin. This reflects a split market in which OTAs continue to dominate acquisition while repeat guests increasingly move to direct channels to avoid fees and secure loyalty benefits. Property Management Company portals are also becoming more important as larger operators invest in owned customer relationships after building brand recognition through marketplace platforms. Offline travel agents remain smaller, but they still have a role in luxury and corporate-related bookings where itinerary support matters more than pure self-service booking. The United States vacation rental market is therefore not moving away from OTAs. Still, it is gradually adding more channel diversity as professional managers and repeat guests build alternatives to platform-only dependence.
By Traveler Type: Leisure Leads, Digital Nomads Reshape the Calendar
Leisure Travelers accounted for 33.8% of market revenue in 2025, making them the largest traveler group. This segment is supported by Millennials and Gen X households that book around school breaks, summer travel periods, and long weekends. Family and Group Travelers also remain central because they support multi-bedroom demand and higher-value bookings in the South and Mountain West. These travel patterns keep the United States vacation rental market closely tied to domestic leisure behavior even as booking calendars become more flexible. The largest demand pool is still built on classic leisure travel, but the mix of leisure trips is becoming less concentrated around a single peak period.
Digital Nomads and Remote Workers are the fastest-growing traveler type with an 8.9% CAGR through 2031, and MBO Partners counted more than 18 million Americans identifying as digital nomads in 2024. That figure represented close to 10% of the United States workforce and points to a sizable demand base for stays lasting 14 to 30 days. These travelers help fill shoulder months and weaker booking windows because they do not need to travel only during peak leisure periods. Listings with strong internet, workspaces, and comfortable long-stay layouts attract a more reliable demand profile with lower cancellation risk. The United States vacation rental industry is adjusting to this shift by treating workspace readiness and longer-stay suitability as standard features rather than niche extras.
By Stay Duration: Medium Stay Dominates Volume, Extended Stays Drive Incremental Value
Medium Stays (4-6 nights) accounted for 30.7% of the United States vacation rental market in 2025, aligning with the typical pattern of short domestic leisure breaks. This stay length remains the volume center of the market because it matches school breaks, summer trips, and long weekend extensions without requiring a major time commitment from travelers. It also aligns with the operating model of many hosts that balance turnover efficiency with achievable nightly rates. Short Stay (1-3 nights) still matters in urban and drive-to markets, but it faces greater pricing pressure from fee transparency and hotel competition. That leaves medium stays as the steady base of demand for the United States vacation rental market.
Extended Short-Term Stay 14-30 nights is projected to grow at a 9.3% CAGR through 2031, the fastest rate across the segmentation types. PriceLabs and Rentals United recorded a rise in average stay duration from 4.0 nights to 4.42 nights in 2025, suggesting a broader lengthening trend rather than an isolated niche movement. For hosts, these stays improve economics by reducing cleaning frequency, lowering vacancy gaps, and increasing guest lifetime value within a single booking cycle. This creates a clear incentive to add minimum stay rules, workspace amenities, and pricing structures that appeal to remote workers and longer leisure trips. The United States vacation rental market still depends on medium stays for scale, but extended stays are becoming more important for profitability and seasonal balance.
By Management Type: Individual Hosts Retain Scale, Professional Managers Capture Growth
Individually Managed Properties accounted for 55.9% of market revenue in 2025, indicating that independent hosts still controlled the majority of current supply economics. This reflects the long-standing host entrepreneurship model that large platforms helped build across the United States. However, the same draft also noted that 64% of Airbnb hosts in the United States did not use a Property Management System in 2025, indicating significant operational and pricing gaps across a large share of listings. In practical terms, many independent hosts still have scale, but not always the systems needed to optimize pricing, compliance, and guest operations consistently. This keeps the United States vacation rental market open to further consolidation in management, even though ownership remains widely dispersed.
Professionally Managed Properties are projected to grow at an 8% CAGR through 2031, supported by consolidation and better operating tools. Casago completed its USD 130 million acquisition of Vacasa in May 2025, creating a professional management network of more than 40,000 properties across 41 United States states. Airbnb also said its AI assistant resolved more than 40% of guest support queries without human intervention in Q1 2026, reducing cost per booking by close to 10% year over year. Those tools favor scaled operators that can spread technology and compliance costs across larger portfolios. As city regulations, tax reporting requirements, and guest service expectations become more demanding, the United States vacation rental market is likely to continue shifting toward professionally managed operations.
Geography Analysis
The South accounted for 36.7% of the United States vacation rental market in 2025, making it the largest regional contributor. The region benefits from the Gulf Coast, the Smoky Mountains, the Florida Panhandle, and the Outer Banks, all of which support strong repeat domestic leisure travel. ELP Luxury Vacations surpassed USD 700 million in assets under management by March 2026, and that growth on Florida’s Emerald Coast shows how premium inventory is scaling within the region. Casago also expanded through a franchise partnership across Northeast Florida and Coastal Georgia in February 2026, indicating that professional management is moving deeper into second- and third-tier resort corridors. Drive-to access, long leisure seasons, and more supportive state-level supply conditions keep the South at the center of the United States vacation rental market.
The West is the fastest-growing region, with a 9.2% CAGR through 2031. Growth is tied to California coastal markets, Rocky Mountain resort towns, and Pacific Northwest nature destinations where travelers continue to seek private, experience-led stays. AvantStay’s opening of The Mara Laguna Beach in April 2026 showed how regulated coastal markets can still support asset repositioning when operators have the scale and permitting capability to execute. Mountain destinations in Colorado and Utah also remain important because professional management penetration was reported at below 30% of listings, leaving room for improved occupancy and pricing execution. This makes the West a key expansion zone for the United States vacation rental market, especially where resort demand and supply discipline can coexist.
The Northeast and Midwest trail the South and West in scale, but they serve different demand patterns within the United States vacation rental market. The Northeast was described as a premium ADR region, supported by weekend demand moving outward from New York and Boston into nearby leisure corridors. Princeton, New Jersey, introduced new short-term rental registration rules through Ordinance No. 2025-20, which shows that regulatory compliance matters more sharply in this region than in less tightly controlled leisure markets.[3]Princeton, New Jersey, “Ordinance No. 2025-20, Short-Term Rental Regulation,” Borough of Princeton, princetonnj.gov The Midwest remains the smallest regional segment, but lakefront and national park-adjacent areas still offer room for professionalization because managed supply is less developed relative to domestic leisure demand. Short booking windows and drive-to accessibility from cities such as Chicago, Minneapolis, and Detroit give the Midwest a different demand shape, one that can reward fast pricing response and localized portfolio management.
Competitive Landscape
The United States vacation rental market is moderately concentrated at the platform level but remains fragmented across property ownership and local management. Airbnb accounted for 50% of United States short-term rental reservations and 37% of total revenue in Q1 2026, which shows clear platform influence. However, it does not imply control over supply itself. OTAs also held 81.4% of booking revenue in 2025, so platform-led demand capture continues to shape pricing power, visibility, and conversion across the market. At the same time, Individually Managed Properties still accounted for 55.9% of market revenue in 2025, confirming that the supply base remains widely distributed. This combination means the United States vacation rental market has concentrated demand gateways but a dispersed set of owners and operators behind the inventory.
Consolidation at the management layer is becoming more important as larger operators use acquisitions and partnerships to gain scale. Casago’s USD 130 million acquisition of Vacasa in May 2025 created a professional network of more than 40,000 properties across North America, making it the largest professionally managed vacation rental portfolio in the region. Sonder’s Chapter 7 liquidation of its United States business in November 2025 highlighted the weakness of fixed-rent master-lease models in a volatile occupancy environment. It triggered a rapid reallocation of assets to revenue-sharing operators. AvantStay then repositioned former Sonder assets, including The Mara Laguna Beach, which illustrates how stronger operators are using distressed supply to expand in regulated, high-value coastal markets. Competitive pressure is therefore shifting away from simple listing counts toward execution quality, compliance capabilities, and platform reach.
Technology and product depth are now central competitive tools in the United States vacation rental market. Airbnb’s 2026 Summer Release added boutique hotels, car rentals, grocery delivery, and luggage storage inside the app, while its AI assistant handled more than 40% of guest support queries without human intervention. AvantStay’s January 2026 partnership with Wander focused on cross-distribution of premium homes. It positioned AvantStay as Wander’s preferred operating partner, which shows how curated premium supply is becoming a distinct competitive lane. ELP Luxury Vacations expanded premium distribution through American Express Select Homes and Retreats and Marriott Homes and Villas, which further supports the move toward stronger curation and channel quality at the top end of the market. The competitive landscape is one where scale matters, but the winning model increasingly depends on branded service consistency, advanced technology, and the ability to manage compliance and pricing across multiple local markets.
United States Short-term Vacation Rental Industry Leaders
Airbnb
Vrbo
Booking.com
Vacasa
Evolve
- *Disclaimer: Major Players sorted in no particular order

Recent Industry Developments
- May 2026: Airbnb launched its 2026 Summer Release, adding boutique hotels in 20 global cities, including New York, car rentals, grocery delivery, and luggage storage within the app, alongside expanded AI features. An AI assistant now resolves over 40% of guest support queries without human intervention and handles 63% of total nights booked through the mobile app. The release marked Airbnb's most significant product expansion in years, repositioning it as a full-trip services platform.
- May 2026: AvantStay announced its expansion into South Florida through a partnership with Nexo Residences, a purpose-built 16-story short-term rental condominium development opening in North Miami Beach in Q3 2026. AvantStay will serve as the preferred property manager and technology platform, bringing professional management to a new-build asset class purpose-engineered for flexible short-term occupancy.
- April 2026: AvantStay opened The Mara Laguna Beach, a 66-room boutique property repositioned from a former Sonder-operated hotel, marking its ninth Sonder-asset takeover and reinforcing its dual strategy of vacation rental management and boutique hospitality in Southern California's regulated coastal short-term rental market.
- March 2026: ELP Luxury Vacations surpassed USD 700 million in assets under management. They expanded distribution through American Express Select Homes and Retreats and Marriott Homes and Villas, cementing the institutionalization of luxury-vacation-rental asset management on Florida's Emerald Coast.


United States Short-term Vacation Rental Market Report Scope
| Homes |
| Apartments |
| Condominiums |
| Cabins and Cottages |
| Villas and Luxury Homes |
| Online Travel Agencies |
| Direct Booking Websites |
| Property Management Company Portals |
| Offline Travel Agents |
| Leisure Travelers |
| Family and Group Travelers |
| Digital Nomads and Remote Workers |
| Business and Bleisure Travelers |
| Short Stay |
| Medium Stay |
| Extended Short-Term Stay |
| Individually Managed Properties |
| Professionally Managed Properties |
| South |
| West |
| Northeast |
| Midwest |
| By Accommodation Type | Homes |
| Apartments | |
| Condominiums | |
| Cabins and Cottages | |
| Villas and Luxury Homes | |
| By Booking Channel | Online Travel Agencies |
| Direct Booking Websites | |
| Property Management Company Portals | |
| Offline Travel Agents | |
| By Traveler Type | Leisure Travelers |
| Family and Group Travelers | |
| Digital Nomads and Remote Workers | |
| Business and Bleisure Travelers | |
| By Stay Duration | Short Stay |
| Medium Stay | |
| Extended Short-Term Stay | |
| By Management Type | Individually Managed Properties |
| Professionally Managed Properties | |
| By Region | South |
| West | |
| Northeast | |
| Midwest |


Key Questions Answered in the Report
What is the size of the United States vacation rental market in 2026?
The United States vacation rental market is estimated at USD 71.73 billion in 2026 and is forecast to reach USD 101.59 billion by 2031 at a 7.2% CAGR.
Which region leads revenue generation in this space?
The South led with 36.7% of revenue in 2025, supported by strong domestic leisure corridors such as the Gulf Coast, Smoky Mountains, and Florida Panhandle.
Which booking channel is strongest in the United States?
OTAs and platform-based bookings dominated with 81.4% of booking revenue in 2025, showing the continued strength of large digital platforms
Which accommodation format is most widely used?
Homes held the largest revenue share at 40.2% in 2025 because travelers continue to prefer larger private spaces for group and family trips.
What is the fastest-growing stay pattern?
Extended short-term stays of 14-30 nights are projected to grow at a 9.3% CAGR through 2031, supported by remote work and longer booking behavior.
Why are professional managers gaining ground?
Professionally managed properties are projected to grow at an 8% CAGR through 2031 because they are better positioned to handle pricing tools, compliance, service consistency, and portfolio scale.
Page last updated on:


