United States Short Haul Road Freight Transport Market Size and Share
Market Overview
| Study Period | 2018 - 2031 |
|---|---|
| Forecast Data Period | 2026 - 2031 |
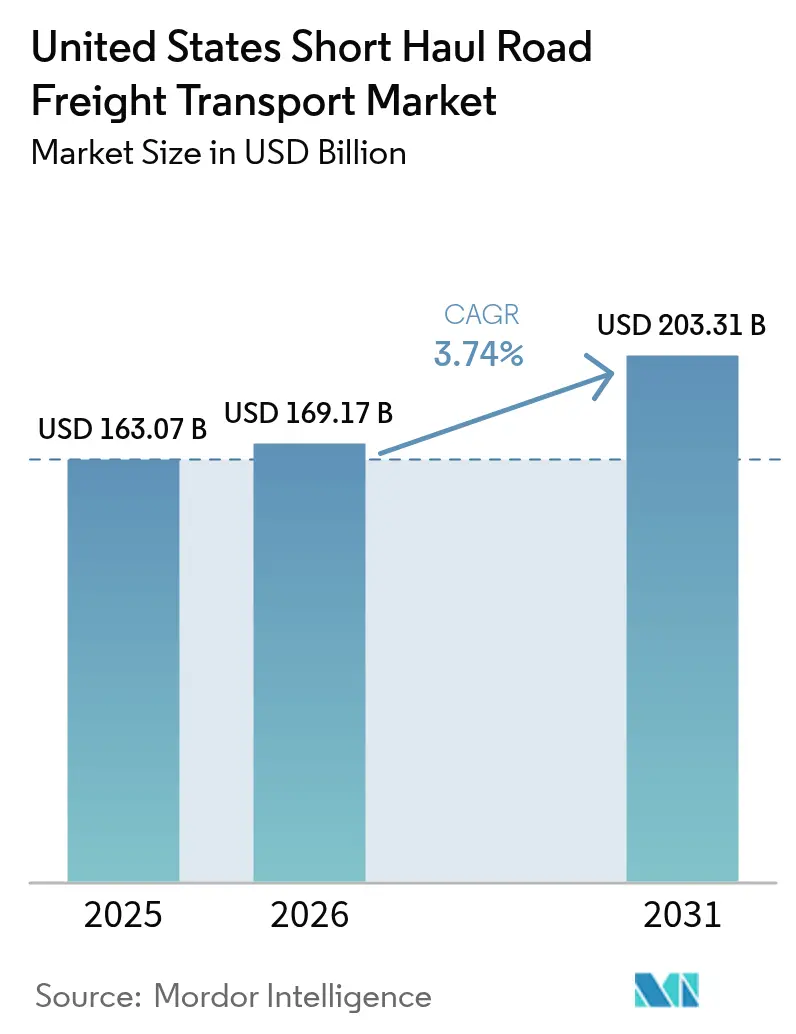
| Base Year Market Size (2025) | USD 163.07 Billion |
| Market Size (2026) | USD 169.17 Billion |
| Market Size (2031) | USD 203.31 Billion |
| Growth Rate (2026 - 2031) | 3.74% CAGR |
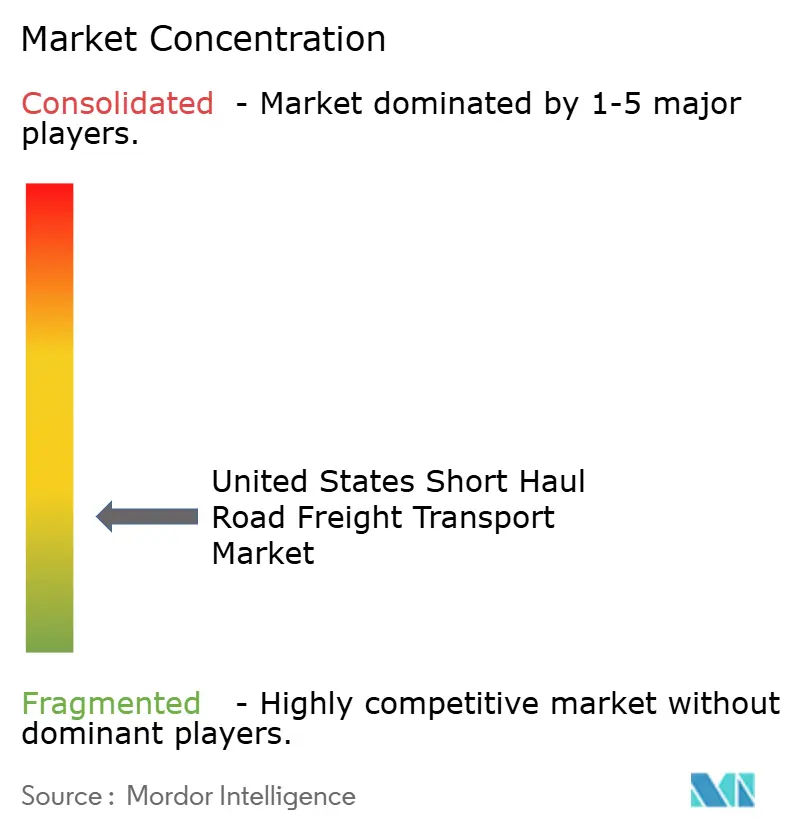
| Market Concentration | Low |
Major Players *Disclaimer: Major Players sorted in no particular order Image © Mordor Intelligence. Reuse requires attribution under CC BY 4.0. | |
United States Short Haul Road Freight Transport Market Analysis by Mordor Intelligence
The United States short haul road freight transport market size is expected to grow from USD 163.07 billion in 2025 to USD 169.17 billion in 2026 and is forecast to reach USD 203.31 billion by 2031 at 3.74% CAGR over 2026-2031. E-commerce-led–led parcel and pallet flows, widespread reshoring of manufacturing, and stepped-up public spending on highways collectively accelerate shipment frequency and tighten delivery windows, favoring road over rail for distances under 300 miles. An unprecedented USD 110 billion allocation for highways under the Bipartisan Infrastructure Law is easing chronic congestion on key freight corridors. At the same time, domestic manufacturing expansion and USMCA-driven cross-border trade are broadening regional demand pockets, while digital freight-matching platforms trim empty miles and expand effective capacity.
Key Report Takeaways
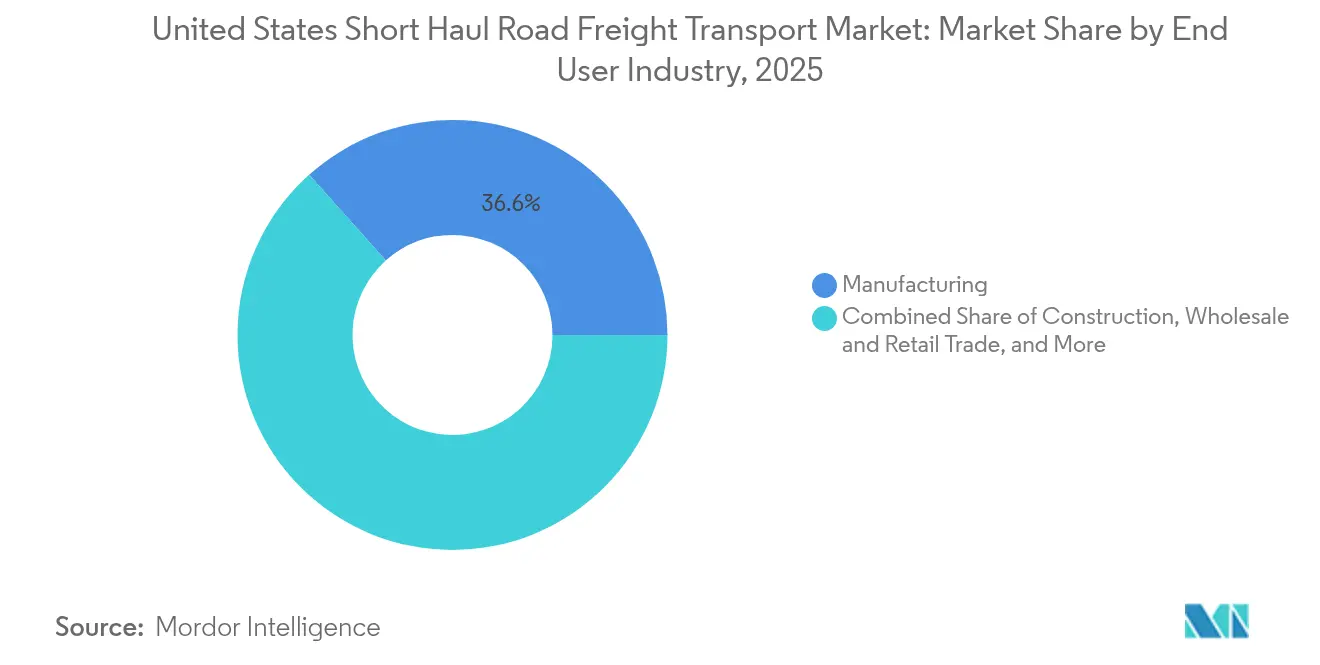
- By end user industry, manufacturing held 36.62% of the United States short haul road freight transport market share in 2025; wholesale and retail trade is forecast to expand at a 4.22% CAGR between 2026-2031.
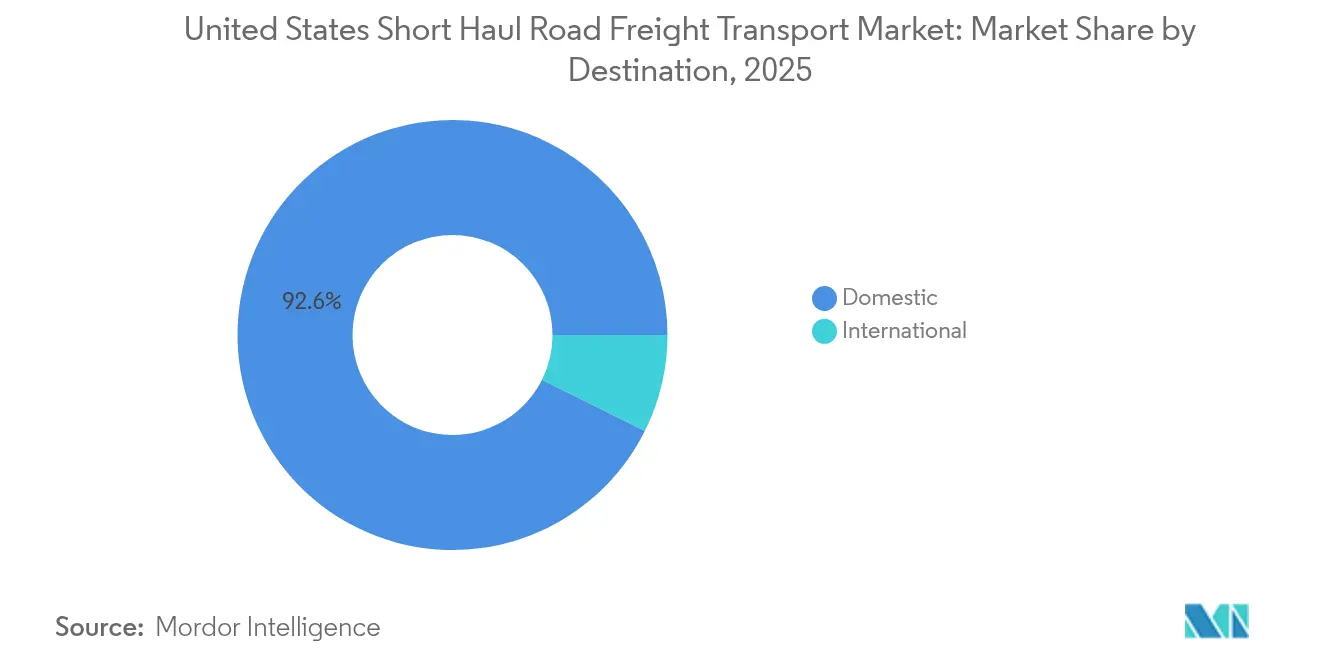
- By destination, domestic movements commanded 92.63% share of the United States short haul road freight transport market size in 2025, while international freight is projected to grow at a 4.11% CAGR between 2026-2031.
Note: Market size and forecast figures in this report are generated using Mordor Intelligence’s proprietary estimation framework, updated with the latest available data and insights as of 2026.
United States Short Haul Road Freight Transport Market Trends and Insights
Drivers Impact Analysis*
| Driver | (~) % Impact on CAGR Forecast | Geographic Relevance | Impact Timeline |
|---|---|---|---|
| Ongoing e-commerce boom accelerating palletized and parcel freight | +1.2% | Major metropolitan areas nationwide | Medium term (2-4 years) |
| Bipartisan Infrastructure Law unlocking highway capacity | +0.8% | National high-traffic corridors | Long term (≥ 4 years) |
| Manufacturing reshoring raising domestic tonnage | +0.7% | Midwest and Southeast hubs | Long term (≥ 4 years) |
| Cross-border USMCA trade growth | +0.5% | Texas, California, Michigan | Medium term (2-4 years) |
| Mid-mile EV truck adoption lowering per-mile costs | +0.4% | Urban and suburban centers with charging | Medium term (2-4 years) |
| AI-powered load-matching cutting empty miles | +0.3% | Tech-forward regions nationwide | Short term (≤ 2 years) |
| Source: Mordor Intelligence | |||


Ongoing E-commerce Boom Accelerating Palletized and Parcel Freight
E-commerce sales reached USD 1.118 trillion in 2024, accounting for 16% of total retail activity and reshaping freight flows toward high-frequency, low-volume deliveries[1]U.S. Census Bureau, “E-commerce Retail Sales,” census.gov. Micro-fulfillment centers, dark stores, and curbside pickup hubs now form dense urban logistics networks that depend on the United States short haul road freight transport market for daily inventory shuttles. Retailers added more than 1,000 new delivery facilities nationwide in the past two years to support same-day and next-day service expectations. These distributed networks favor carriers capable of managing tight delivery windows and frequent route turns. Omnichannel retail strategies further boost intraregional stock transfers, concentrating demand around the top 25 metropolitan areas where population density compresses delivery lead times.
Bipartisan Infrastructure Law Unlocking Highway Capacity
The Federal Highway Administration earmarked USD 52.5 billion through 2026 for interstate modernization, with 40% targeting key truck corridors[2]U.S. Department of Transportation, “President Biden, USDOT Announce $52 Billion in Funding Available to States,” transportation.gov. Replacement of structurally deficient bridges—more than 45,000 nationwide—removes chokepoints that historically added 15-20% to urban trip times for the United States short haul road freight transport market. Expanded lane miles along I-95, I-10, and I-5 improve average speeds on the nation’s busiest freight routes. Multimodal grants also enhance port-to-inland truck connectivity, shortening dwell times for domestic drayage legs. These upgrades, combined with harmonized freight-mobility design standards, are expected to lift effective truck capacity and curb fuel waste, directly supporting carriers’ margin preservation over the long term.
Manufacturing Reshoring Raising Domestic Tonnage
Automotive OEM investments of USD 11.4 billion in new electric-vehicle plants in Tennessee and Kentucky, plus USD 52 billion in semiconductor incentives under the CHIPS and Science Act, are spawning new supplier corridors in Arizona, Ohio, and Texas. By locating production closer to end markets, manufacturers increase intra-regional shipments of parts, sub-assemblies, and finished goods—movements ideally suited to the United States short haul road freight transport market. Compared with the historical import model, reshored production replaces 2-week ocean voyages with daily, sub-300-mile truck runs linking suppliers to final assembly and distribution nodes. Carriers with dedicated fleets positioned near new industrial parks capture steady lane density and backhaul opportunities, stabilizing yields despite cyclical swings in consumer demand.
Cross-Border USMCA Trade Growth
Mexico overtook China as America’s top trading partner in 2024, with bilateral trade topping USD 840 billion. Automotive, electronics, and machinery supply chains increasingly straddle the border, requiring frequent shuttle runs between maquiladoras and U.S. distribution centers. Trusted-trader programs introduced under USMCA trimmed average border-crossing times by 15%, improving asset utilization for the United States short haul road freight transport market. Manufacturing clusters within 200 miles of the border have multiplied, generating reliable drayage demand. Specialized cross-border carriers with bilingual staff, hazmat-compliant fleets, and customs-broker partners are expanding terminal footprints in Laredo, El Paso, and San Diego to tap the higher-growth international segment.
Restraints Impact Analysis*
| Restraint | (~) % Impact on CAGR Forecast | Geographic Relevance | Impact Timeline |
|---|---|---|---|
| Structural truck-driver shortage and high turnover | -0.9% | Nationwide, acute in urban centers | Long term (≥ 4 years) |
| Diesel-price volatility squeezing carrier margins | -0.6% | National, heaviest on independents | Short term (≤ 2 years) |
| Border-inspection bottlenecks for time-sensitive freight | -0.3% | Texas, California, Arizona crossings | Medium term (2-4 years) |
| Cyber-security risks to connected fleets | -0.2% | Technology-advanced carriers nationwide | Short term (≤ 2 years) |
| Source: Mordor Intelligence | |||
Structural Truck-Driver Shortage and High Turnover
The American Trucking Associations pegged the driver shortfall at 78,000 in 2024, with turnover surpassing 90% at large truckload carriers[3]American Trucking Associations, “Driver Shortage Reaches Historic High,” trucking.org. Entry-level training rules, stricter drug-testing enforcement, and the demographic skew toward drivers over 48 constrain labor inflow. In urban short-haul work, multi-stop routes, congestion, and frequent dock delays erode quality of life, intensifying churn. Carriers serving the United States short haul road freight transport market invest in wage premiums, signing bonuses, and flexible scheduling, but still face limited labor elasticity over the next four years. Autonomous-truck technology remains years from scale, leaving the sector structurally understaffed.
Diesel-Price Volatility Squeezing Carrier Margins
Fuel represents up to 30% of operating cost on urban and regional truck runs[4]American Transportation Research Institute, “Operational Costs of Trucking,” truckingresearch.org. Average U.S. on-highway diesel swung between USD 3.60 and USD 4.75 per gallon during 2024. Surcharges often trail price moves by 30-60 days, compressing gross margins when prices spike. Smaller fleets comprising 350,000 owner-operators lack the scale to hedge fuel or negotiate bulk discounts, putting them at a disadvantage within the United States short haul road freight transport market. As California’s renewable diesel mandate expands nationwide, refiners face higher compliance costs, adding another layer of volatility through 2030.
*Our forecasts treat driver/restraint impacts as directional, not additive. The impact forecasts reflect baseline growth, mix effects, and variable interactions.
Segment Analysis
By End User Industry: Manufacturing Anchors Market While Retail Trade Accelerates
Manufacturing contributed 36.62% of the United States short haul road freight transport market share in 2025, underpinned by predictable part flows among suppliers, plants, and distribution centers. High load density on Midwest and Southeast lanes supports consistent fleet utilization and deters modal substitution. Wholesale and retail trade, though smaller in absolute revenue, is expanding fastest at a 4.22% CAGR between 2026-2031, reflecting relentless e-commerce growth and omnichannel inventory strategies that demand sub-24-hour replenishment. The construction sector rides a multiyear public-works cycle, moving aggregates, cement, and prefabricated modules on rigid delivery schedules that suit the United States short haul road freight transport market. Agriculture, fishing, and forestry provide seasonal peaks tied to harvest cycles, while the oil, gas, and mining verticals sustain year-round demand for equipment moves to shale plays and quarries.
Across all verticals, shippers increasingly favor carriers offering real-time visibility and electronic proof-of-delivery. For high-value pharmaceutical loads, GDP-compliant temperature control unlocks premium haul rates. Renewable-energy component moves—turbine blades, battery packs, and solar modules—are rising, diversifying load mixes. Segment diversification cushions carriers against cyclical dips in any single industry and raises the strategic importance of flexible staffing and equipment assignment.


By Destination: Domestic Dominance Reflects Internal Distribution Focus
Domestic freight maintained a 92.63% share of the United States short haul road freight transport market size in 2025, highlighting the network’s core role in connecting regional production to consumption. Distributed inventories following pandemic-era supply-chain shocks prompted retailers to establish multiple fulfillment centers within 200 miles of major metros. These facilities rely on daily truck loops rather than longer-haul replenishment, concentrating volume in intra-state and neighboring-state corridors. Continuous lane density enables carriers to optimize backhauls and reduce empty mile exposure.
International freight is forecast to post a 4.11% CAGR between 2026-2031, slightly outpacing domestic growth but starting from a smaller base. Cross-border drayage at Mexican gateways captures reshoring-driven parts flows, while Canada-U.S. auto and forestry trades sustain northern border traffic. Specialized fleets with bilingual dispatch, border-crossing certifications, and foreign equipment registration stand to gain. Yet customs complexity and equipment dormancy during inspections temper absolute volume, keeping domestic lanes the economic mainstay for most carriers.
Geography Analysis
Regional dynamics mirror population clusters, industrial footprints, and trade-corridor roles. The Northeast Corridor produces the highest freight density per square mile, where daily replenishment among Boston, New York, Philadelphia, and Washington, D.C. relies on the United States short haul road freight transport market for just-in-time store deliveries and parcel drop-offs. California leads in absolute tonnage, linking the nation’s largest port complex to the Central Valley’s agricultural heartland and Silicon Valley’s tech ecosystem; short-haul carriers execute port drays, inter-facility moves, and last-leg distribution within a 250-mile radius of Los Angeles.
Texas is the fastest-growing regional market, buoyed by a surge in nearshored manufacturing and petroleum-sector activity. The I-35, I-10, and SH-130 corridors form a backbone for time-critical auto and electronics loads destined for central U.S. distribution centers. In the Midwest, Chicago’s intermodal yards anchor the nation’s busiest freight hub, where cross-dock LTL operations connect rail ramps to final consignees within hours. Florida’s expanding role as a Southeastern logistics gateway stems from rising Latin American trade and booming tourism retail, sparking new micro-fulfillment nodes in Orlando and Miami. The Pacific Northwest captures agricultural exports and tech hardware imports through Seattle-Tacoma ports, while the Carolinas and Georgia leverage manufacturing reshoring in automotive and textiles. Variations in highway conditions and state fuel taxes create cost differentials; fleets operating in low-tax states like Missouri achieve fuel cost advantages over peers in California, improving margin resilience. Federal freight-corridor designations drive funding toward I-95, I-80, and I-40, supporting regional capacity upgrades that benefit carriers’ service reliability.
Competitive Landscape
The United States short haul road freight transport market remains moderately fragmented. Strategic acquisitions persist: XPO opened new service centers, DHL Supply Chain acquired IDS Fulfillment to deepen e-commerce expertise, and Penske launched Catalyst AI for predictive fleet insights. Technology penetration differentiates competitors; fleets deploying telematics and AI-driven route planning cut empty miles and improve on-time performance, enhancing shipper value propositions.
Specialization offers white-space opportunities. Temperature-controlled carriers command premium rates in pharmaceutical, fresh-produce, and floral supply chains, while flatbed and heavy-haul operators serve booming renewable-energy construction projects. Cross-border drayage specialists leverage C-TPAT and FAST certifications for expedited customs clearance, giving them an edge as USMCA volume grows. Cybersecurity has emerged as a competitive dimension, with larger fleets investing in ISO 27001-compliant systems and incident-response teams to reassure shippers of data integrity.
Labor retention strategies also shape competitive outcomes. Carriers partnering with community colleges to sponsor CDL training pipelines reduce turnover, while multimodal players integrating rail-truck dray offerings secure longer-term customer contracts. Sustainability credentials influence shipper selection as ESG reporting gains prominence; fleets joining EPA SmartWay and piloting electric trucks attract consumer-goods brands seeking carbon-reduced transport options.
United States Short Haul Road Freight Transport Industry Leaders
FedEx
United Parcel Service of America, Inc. (UPS)
XPO, Inc.
Schneider National, Inc.
Knight-Swift Transportation Holdings Inc.
- *Disclaimer: Major Players sorted in no particular order

Recent Industry Developments
- May 2025: Penske rolled out Catalyst AI™, applying machine learning to optimize maintenance and routing decisions.
- May 2025: DHL Supply Chain acquired IDS Fulfillment, expanding small- and mid-size e-commerce client coverage.
- September 2024: FedEx invested in Nimble to deploy autonomous robotics across fulfillment centers and accelerate order processing.
- April 2024: XPO opened service centers in Goodlettsville, TN; Grand Junction, CO; and Nogales, AZ, enhancing access to interstate corridors.


United States Short Haul Road Freight Transport Market Report Scope
Agriculture, Fishing, and Forestry, Construction, Manufacturing, Oil and Gas, Mining and Quarrying, Wholesale and Retail Trade, Others are covered as segments by End User Industry. Domestic, International are covered as segments by Destination.| Agriculture, Fishing, and Forestry |
| Construction |
| Manufacturing |
| Oil and Gas, Mining and Quarrying |
| Wholesale and Retail Trade |
| Others |
| Domestic |
| International |
| End User Industry | Agriculture, Fishing, and Forestry |
| Construction | |
| Manufacturing | |
| Oil and Gas, Mining and Quarrying | |
| Wholesale and Retail Trade | |
| Others | |
| Destination | Domestic |
| International |


Market Definition
- Agriculture, Fishing, and Forestry (AFF) - This end user industry segment captures the external (outsourced) logistics expenditure incurred by the AFF industry players on road freight transport service. The end user players considered are the establishments primarily engaged in growing crops, raising animals, harvesting timber, harvesting fish & other animals from their natural habitats and providing related support activities. Herein, across the value chain, Logistics Service Providers (LSPs) play a crucial role in acquisition, storage, handling, transportation, and distribution activities for the optimal & continuous flow of inputs (seeds, pesticides, fertilizers, equipment, and water) from manufacturers or suppliers to the producers and smooth flow of output (produce, agro-goods) to distributors/ consumers. This includes both termperature controlled and non-temperature controlled logistics, as and when required according to the shelf life of goods being transported or stored.
- Construction - This end user industry segment captures the external (outsourced) logistics expenditure incurred by the construction industry players, on road freight transport service. The end user players considered are the establishments primarily engaged in constructing, repairing and renovating residential & commercial buildings, infrastructure, engineering works, subdividing and developing land. Logistics Service Providers (LSPs) play a crucial role in increasing profitability of construction projects by maintaing the inventory of raw materials & equipment, time-critical supplies and by providing other value added services for effective project management.
- Containerized Road Freight Transport - The segment captures the external (outsourced) logistics expenditure incurred by the road freight transport service end users on Full-Truck-Load (FTL) services. FTL road freight transport is characterized as a full single load not combined with other shipments. It comprises of shipments (i) devoted to the goods of a single shipper (ii) taken directly from a point of origin to one or more destination points (iii) comprising of bulk mail truck transportation (iv) comprising of both Container (Full Container Load, FCL)/Non-Container trucking services (v)comprsing of goods requiring temperature controlled or non-temperature controlled transportation services (vi) comprising of bulk liquid tankering (vii) invoving trucking of waste (viii) hazardous material trucking. Related value added services (VAS) of sorting, consolidation, deconslidation are included in the other services segment of freight and logistics market.
- Export Trends and Import Trends - Overall logistics performance of an economy is positively and significantly (statistically) correlated to its trade performance (exports and imports). Hence, in this industry trend, total value of trade, major commodities/ commodity groups and the major trade partners, for the studied geography (country or region as per the scope of report) have been analysed alongside the impact of major trade/logistics infrastructure investments & regulatory environment.
- Fluid Goods - The segment captures the external (outsourced) logistics expenditure incurred by the road freight transport service end users for the transport of bulk liquids, that are often used in extraction, manufacturing, food processing, agriculture industries among others. It includes transportation of liquids like (i) Chemicals/ hazardous goods (for instance acids) (ii) Water (potable as well as waste) (iii) Oil and gas (upstream as well as downstream like gasoline, fuel, crude oil, or propane), (iv) Food grade bulk liquids (like milk, or juice), (v) Rubber, (vi) Agrichemical products, among others. These goods are generally transported through tanker trucking.
- Fuel Price - Fuel price spikes can cause delays and diruption for logistics service providers (LSPs), while drops in the same can result in higher short-term profitability and increased market rivalry to offer consumers with the best deals. Hence, the fuel price variations have been studied over the review period and presented along with the causes as well as market impacts.
- Full-Truck-Load (FTL) Road Freight Transport - The segment captures the external (outsourced) logistics expenditure incurred by the road freight transport service end users on Full-Truck-Load (FTL) services. FTL road freight transport is characterized as a full single load not combined with other shipments. It comprises of shipments (i) devoted to the goods of a single shipper (ii) taken directly from a point of origin to one or more destination points (iii) comprising of bulk mail truck transportation (iv) comprising of both Container (Full Container Load, FCL)/Non-Container trucking services (v)comprsing of goods requiring temperature controlled or non-temperature controlled transportation services (vi) comprising of bulk liquid tankering (vii) invoving trucking of waste (viii) hazardous material trucking. Related value added services (VAS) of sorting, consolidation, deconslidation are included in the other services segment of freight and logistics market.
- GDP Distribution by Economic Activity - Nominal Gross Domestic Product and distribution of the same, across major economic sectors in the geography studied (country or region as per scope of the report) have been studied and presented in this industry trend. As GDP is positively related to the profitability and growth of logistics industry, this data has been used in adjunction to the input-output tables/ supply-use tables for analyzing the potential major contributing sectors towards the logistics demand.
- GDP Growth by Economic Activity - Growth of Nominal Gross Domestic Product across major economic sectors, for the geography studied (country or region as per scope of the report) have been presented in this industry trend. This data has been utilized for assessing the growth of logistics demand from all the market end users (economic sectors considered here).
- Inflation - Variations in both Wholesale Price Inflation (YoY change in producer price index) and Consumer Price Inflation have been presented in this industry trend. This data has been used to assess the inflationary environment as it plays a vital role in smooth functioning of the supply chain, directly impacting the logistics operational cost components e.g., pricing of tyres, driver wages & benefits, energy/fuel prices, maintenace costs, toll charges, warehousing rents, custom brokerage, forwarding rates, courier rates etc. hence impacting the overall freight and logistics market.
- Key Industry Trends - The report section named "Key Industry Trends" include all the key variables/parameters studied to better analyze the market size estimates and forecasts. All the trends have been presented in the form of data points (time series or latest available data points) along with analysis of the paramter in the form of concise market relevant commentary, for the geography studied (country or region as per the scope of report).
- Key Strategic Moves - The action taken by a company to differentiate from its competitor or used as a general strategy is referred to as a key strategic move (KSM). This includes (1) Agreements (2) Expansions (3) Financial Restructuring (4) Mergers and Acquisitions (5) Partnerships, and (6) Product Innovations. Key players (Logistics Service Providers, LSPs) in the market have been shortlisted, their KSM have been studied and presented in this section.
- Less than-Truck-Load (LTL) Road Freight Transport - The segment captures the external (outsourced) logistics expenditure incurred by the road freight transport service end users on Less than-Truck-Load (LTL) services. LTL road freight transport is characterized as multiple shipments combined onto a single truck for multiple deliveries within a network. It comprises of establishments (i) primarily engaged in general and specialized freight trucking of less than complete truck-loads, (ii) characterized by the use of terminals to consolidate shipments, generally from several shippers, into a single truck for haulage between a load assembly terminal and a disassembly terminal, where the load is sorted and shipments are re-routed for delivery (iv) Less than-Container-Load (LCL) shipping/ Groupage Shipping in case of trucking services. The activities in scope include (i) local pick-up, (ii) line-haul, and (iii) local delivery. Related value added services (VAS) of sorting, consolidation, deconslidation are included in the other services segment of freight and logistics market.
- Logistics Performance - Logistics Performance and Logistics Costs are the backbone of trade, and influences trade costs, making countries compete globally. Logistics performance is influenced by market wide adopted supply chain management strategies, government services, investments & policies, fuel/ energy costs, inflationary environment etc. Hence, in this industry trend, the logistics performance of the geography studied (country/ region as per the scope of report) has been analysed and presented over the review period.
- Major Truck Suppliers - Market share of truck brands is influenced by factors like geographical preferences, portfolio of truck types, truck prices, local production, truck repair & maintenance service peneteration, customer support, technological innovations (like electric vehicles, digitalization, autonomous trucks), fuel efficiency, financing options, annual maintenance costs, availability of substitutes, marketing startegies etc. Hence, the distribution (share % for base year of the study) of truck sales volume for leading truck brands and commentary on current market scenario & market anticipation over the forecast period have been presented in this industry trend.
- Manufacturing - This end user industry segment captures the external (outsourced) logistics expenditure incurred by the Manufacturing industry players, on road freight transport service. The end user players considered are the establishments primarily engaged in the chemical, mechanical or physical transformation of materials or substances into new products. Logistics Service Providers (LSPs) play a crucial role in maintaining a smooth flow of raw materials across the supply chain, enabling timely delivery of finished goods to distributors or end customers and storing & supplying the raw materials to clients for just-in-time manufacturing.
- Modal Share - Freight Modal Share is influenced by factors like modal productivity, government regulations, containerization, distance of shipment, temperature control requirements, type of goods, international trade, terrain, speed of delivery, shipment weight, bulk shipments, etc. Also, modal share by tonnage (tons) and modal share by freight turnover (ton-km) differ as per average distance of shipments, weight of major commodity groups transported in the economy and number of trips. This industry trend represents the distribution of freight transported by mode of transport (tons as well as ton-km), for the study base year.
- Oil and Gas, Mining and Quarrying - This end user industry segment captures the external (outsourced) logistics expenditure incurred by the extraction industry players, on road freight transport service. The end user players considered are the establishments that extract naturally occurring mineral solids, such as coal and ores; liquid minerals, such as crude petroleum; and gases, such as natural gas. Logistics Service Providers (LSPs) covers entire phases from upstream to downstream and plays a crucial role in the transportation of machinery, drilling equipments, extracted minerals, crude oil & natural gas and refined/ processed products from one place to another.
- Other End Users - Other end user segment captures the external (outsourced) logistics expenditure incurred by the financial services (BFSI), real estate, educational services, healthcare, and professional services (administrative, waste management, legal, architectural, engineering, design, consulting, scientific R&D), on road freight transport service. Logistics Service Providers (LSPs) plays a crucial role in the reliable movement of supplies and documents to/from these industries such as transporting any equipment or resources required, shipping confidential documents and files, movement of medical goods & supplies (surgical supplies and instruments, including gloves, masks, syringes, equipment) to name a few.
- Producer Price Inflation - It indicates inflation from viewpoint of the producers viz. the average selling price received for their output over a period of time. Annual change (YoY) of producer price index is reported as wholesale price inflation in the "Inflation" industry trend. As WPI captures dynamic price movements in most comprehensive way, it is widely used by governments, banks, industry, business circles and is deemed important in formulation of trade, fiscal and other economic policies. The data has been used in adjunction to consumer price inflation for better understanding the inflationary environment.
- Road Freight Pricing Trends - Freight pricing by mode of transport (USD/tonkm), over the review period, has been presented in this industry trend. The data has been used in assessing the inflationary environment, impact on trade, freight turnover (tonkm), road freight transport market demand and hence the road freight transport market size.
- Road Freight Tonnage Trends - Freight tonnage (weight of goods in tons) handled by mode of transport, over the review period, has been presented in this industry trend. The data has been used as one of the parameters apart from average distance per shipment (km), freight volume (tonkm), and freight pricing (USD/tonkm) to assess the freight transport market size.
- Road Freight Transport - Hiring a road freight transport logistics service provider (LSP) or haulier (outsourced logistics), for the transport of commodities constitutes road freight transport market. The scope of study includes (i) road transport of goods reported by hauliers registered in the reporting countries (ii) transport of raw materials or manufactured goods (solids as well as fluids) (iii) transport using commerical motor vehicles (rigid trucks or tractor-trailers, (iv) Full-Truck-Load (FTL) or Less than-Truck-Load (LTL) transport (v) containerized or non-containerized transport (vi) temperature controlled or non-temperature controlled trasnport, (vii) short haul or long haul (Over-the-road, OTR) transport, (viii) used office or household goods transport (movers and packers), (ix) other specialized cargo transport (dangerous goods, oversized cargo) and (x) outsourced first mile/ middle mile/last mile delivery shipments undertaken by road freight transport players. The scope does not include (i) transport undertaken by hauliers registered in other countries (ii) last mile meal delivery market (iii) grocery delivery market (iv) transportation via road network undertaken/ reported by Courier, Express, and Parcel (CEP) players.
- Road Length - As infrastructure plays a vital role in an economy's logistics performance, variables like length of roads, distribution of road length by surface category (paved v/s unpaved), distribution of road length by road classification (expressways v/s highways v/s other roads), have been analysed and presented in this industry trend.
- Segmental Revenue - Segmental Revenue has been triangulated or computed and presented for all the major players in the market. It refers to the road freight transport market specific revenue earned by the company, over the base year of study, in the geography studied (country or region as per the scope of report). It is computed through the study and analysis of major parameters like financials, service portfolio, employee strength, fleet size, investments, number of countries present in, major economies of concern, etc. that have been reported by the company in its annual reports, webpage. For companies having scarce financial disclosures, paid databases like D&B Hoovers, Dow Jones Factiva have been resorted to and verified through industry/expert interactions.
- Short Haul Road Freight Transport - The segment captures the external (outsourced) logistics expenditure incurred by the road freight transport service end users on local trucking (less than 100 miles). It includes the road transport of goods (i) within a single administrative area and its hinterland, (ii) by smaller trucks and pickup trucks (iii) via containerized as well as dry bulk services (iv) intermodal from ports, container terminals or airports, and (v) outsourced first mile/ last mile delivery shipments undertaken by road freight transport players.
- Transport and Storage Sector GDP - Value and growth of Transport and Storage Sector GDP has a direct relation to the freight and logistics market size, and hence road freight transport market size. Therefore, this variable has been studied and presented over the review period, in value terms (USD) and as share % of total GDP, in this industry trend. The data has been supported by concise and relevant commentary around the investments, developments, and current market scenario.
- Trends in E-Commerce Industry - Enhanced internet connectivity and boom in smartphone penetration, coupled with increasing disposable incomes, has led to a phenomenal growth in the e-commerce market globally. Online shoppers require fast and efficient delivery of their orders leading to an increase in the demand for logistics services especially e-commerce fulfilment services. Hence, the Gross Merchandise Value (GMV), historial and projected growth, breakup of major commodity groups in e-commerce industry for the studied geography (country or region as per scope of the report) have been analysed and presented in this industry trend.
- Trends in Manufacturing Industry - Manufacturing industry involves the transformation of raw materials into finished products, while logistics industry ensures the efficient flow of raw materials to the factory, and the transport of manufactured products to the distributors & consumers. Demand-Supply of both industries are highly cross-linked and critical for a seamless supply chain. Hence, the Gross Value Added (GVA), breakup of GVA into major manufacturing sectors, and growth of manufacturing industry over the review period have been analysed and presented, in this industry trend.
- Trucking Fleet Size By Type - Market share of truck types is influenced by factors like geographical preferences, major end user industries, truck prices, local production, truck repair & maintenance service peneteration, customer support, technological disruptions (like electric vehicles, digitalization, autonomous trucks) etc. Hence, the distribution (share % for base year of study) of truck parc volume by type of truck, market disruptors, truck manufacturing investments, truck specifications, truck use & import regulations, and market anticipation over the forecast period have been presented in this industry trend.
- Trucking Operational Costs - The prime reasons for measuring/ benchmarking logistics performance of any trucking company are to reduce operational costs and increase profitability. On the other hand, measuring operational costs helps to identify whether and where to make operational changes to control expenses and identify areas for improved performance. Hence, in this industry trend, trucking operational costs and the variables involved viz. driver wages & benefits, fuel prices, repairs & maintenance costs, tyre costs etc. have been studied over the base year of study, and presented for the geography studied (country or region as per the scope of report).
- Wholesale and Retail Trade - This end user industry segment captures the external (outsourced) logistics expenditure incurred by the wholesalers and retailers, on road freight transport service. The end user players considered are the establishments primarily engaged in wholesaling or retailing merchandise, generally without transformation, and rendering services incidental to the sale of merchandise. Logistics Service Providers (LSPs) plays a crucial role in the reliable movement of supplies to and finished products from production houses to the distributors and finally to the end customer covering activites like material sourcing, transportation, order fulfillment, warehousing & storage, demand forecasting, inventory management etc.
| Keyword | Definition |
|---|---|
| Cabotage | Road transport by a motor vehicle registered in a country performed on the national territory of another country. |
| Cross Docking | Cross docking is a logistics procedure where products from a supplier or manufacturing plant are distributed directly to a customer or retail chain with marginal to no handling or storage time. Cross docking takes place in a distribution docking terminal; usually consisting of trucks and dock doors on two (inbound and outbound) sides with minimal storage space. The name ‘cross docking’ explains the process of receiving products through an inbound dock and then transferring them across the dock to the outbound transportation dock. |
| Cross Trade | International road transport between two different countries performed by a road motor vehicle registered in a third country. A third country is a country other than the country of loading/embarkation and than the country of unloading/disembarkation. |
| Dangerous Goods | The classes of dangerous goods carried by Road are those defined by the fifteenth revised edition of the UN Recommendations on the Transport of Dangerous Goods, United Nations, Geneva 2007. They include Class 1: Explosives; Class 2: Gases; Class 3: Flammable Liquids; Class 4: Flammable solids- substances liable to spontaneous combustion; substances which, on contact with water, emit flammable gases; Class 5: Oxidizing substances and organic peroxides; Class 6: Toxic and infectious substances; Class 7: Radioactive material and Class 8: Corrosive substances, Class 9: Miscellaneous dangerous substances and articles. |
| Direct Shipment | Direct shipment is a method of delivering goods from the supplier or the product owner to the customer directly. In most cases, the customer orders the goods from the product owner. This delivery scheme reduces transportation and storage costs, but requires additional planning and administration. |
| Drayage | A drayage is a form of trucking service that connects the different modes of shipping (intermodal), such as ocean freight or air freight. It’s a short-haul trip that transports goods from one place to another, usually before or after its long-haul shipping process. Drayage trucks move cargo to and from various destinations, such as container ships, storage lots, order fulfillment warehouses, and rail yards. Typically, drayage only transports goods in short distances and operates only in one metropolitan area. It also requires only one trucker in a single shift. But despite this, but it plays an important role in long-haul shipping because it gets the goods to the cargo and vice versa. It makes intermodal transport much more efficient and enables the seamless transfer of goods to the end customer. |
| Dry van | A dry van is a type of semi-trailer that's fully enclosed to protect shipments from outside elements. Designed to carry palletized, boxed or loose freight, dry vans aren't temperature-controlled (unlike refrigerated “reefer” units) and can't carry oversized shipments (unlike flatbed trailers). |
| Final Demand | Final demand includes all types of commodities (goods as well as services) consumed as final use and might include personal consumption, or consumption by government, by businesses as capital investment, and as exports. includes all types of commodities (goods as well as services) consumed as final use and might include personal consumption, or consumption by government, by businesses as capital investment, and as exports. |
| Flatbed Truck | A flatbed truck is a type of truck with rigid design. It has a back body that is flatly shaped for easy loading and unloading of goods. The flatbed truck is mostly used to transport heavy, oversized, wide and indelicate goods such as machinery, building supplies or equipment. Due to the truck open body, the goods transported with it must not be vulnerable to rain. By functionality, the flatbed truck is comparable to a flatbed trailer. |
| Inbound Logistics | Inbound logistics is the way materials and other goods are brought into a company. This process includes the steps to order, receive, store, transport and manage incoming supplies. Inbound logistics focuses on the supply part of the supply-demand equation. |
| Intermediate Demand | Intermediate demand includes goods, services, and maintenance and repair construction sold to businesses, excluding capital investment. |
| International Loaded | Place of loading of goods in reporting country (i.e., country in which the vehicle performing the transport is registered) and place of unloading in a different country. |
| International Unloaded | Place of unloading of goods in reporting country (i.e., country in which the vehicle performing the transport is registered) and place of loading in a different country. |
| OOG cargo | Out of Gauge (OOG) cargo is any cargo that can not be loaded into six-sided shipping containers simply because it is too large. The term is a very loose classification of all cargo with dimensions beyond the maximum 40HC container dimensions. That is a length beyond 12.05 meters – a width beyond 2.33 meters – or a height beyond 2.59 meters. |
| Pallets | Raised platform, intended to facilitate the lifting and stacking of goods. |
| Part load | A part load describes goods which only fills a truck partially. In essence, the quantity of the shipment is bigger than the Less Than Truckload (LTL) shipment. Also, the shipment cannot fully occupy a truck i.e. its capacity is much lower than a Full Truckload (FTL) shipment. |
| Paved Road | Road surfaced with crushed stone (macadam) with hydrocarbon binder or bituminized agents, with concrete or with cobblestone. |
| Reverse Logistics | Reverse logistics comprises of the sector of supply chains that process anything returning inwards through the supply chain or traveling ‘backward’ through the supply chain. |
| Road Freight Transport Service | Hiring a trucking agency for transport of commodities (raw materials or manufactured goods including both solids and liquids) form the origin to a destination within the country (domestic) or cross-border (international) constitutes road freight transport market. The service might be Full-Truck-Load or Less than-Truck-Load, containerized or non-containerized, temperature controlled or non temperature controlled, short haul or long haul. |
| Tautliner vehicle | Tautliner and curtainsider are used as generic names for curtain sided trucks/trailers. The curtains are permanently fixed to a runner at the top and detachable rails/poles at front and rear, allowing the curtains to be drawn open and forklifts used all along the sides for easy and efficient loading and unloading. When closed for travel, vertical load restraint straps are attached to a rope rail beneath the truck bed, connecting the truck bed and curtain along both sides. Winches at either end of the curtain tension it, hence the 'Tautliner' name. This stops the curtain from flapping or drumming in the wind and can also help retain light loads from slipping sideways. |
| Transport for hire or reward | The carriage for remuneration of goods. |
| Unpaved Road | Road with a stabilized base not surfaced with crushed stone, hydrocarbon binder or bituminized agents, concrete or cobblestone. |


Research Methodology
Mordor Intelligence follows a four-step methodology in all our reports.
- Step-1: Identify Key Variables: In order to build a robust forecasting methodology, the variables and factors identified in Step-1 are tested against available historical market numbers. Through an iterative process, the variables required for market forecast are set and the model is built on the basis of these variables.
- Step-2: Build a Market Model: Market-size estimations for the forecast years are in nominal terms. Inflation is considered to be a part of the pricing, and the average selling price (ASP) is varying throughout the forecast period for each country
- Step-3: Validate and Finalize: In this important step, all market numbers, variables and analyst calls are validated through an extensive network of primary research experts from the market studied. The respondents are selected across levels and functions to generate a holistic picture of the market studied.
- Step-4: Research Outputs: Syndicated Reports, Custom Consulting Assignments, Databases & Subscription Platforms


