Market Overview
| Study Period | 2020 - 2031 |
|---|---|
| Forecast Data Period | 2026 - 2031 |
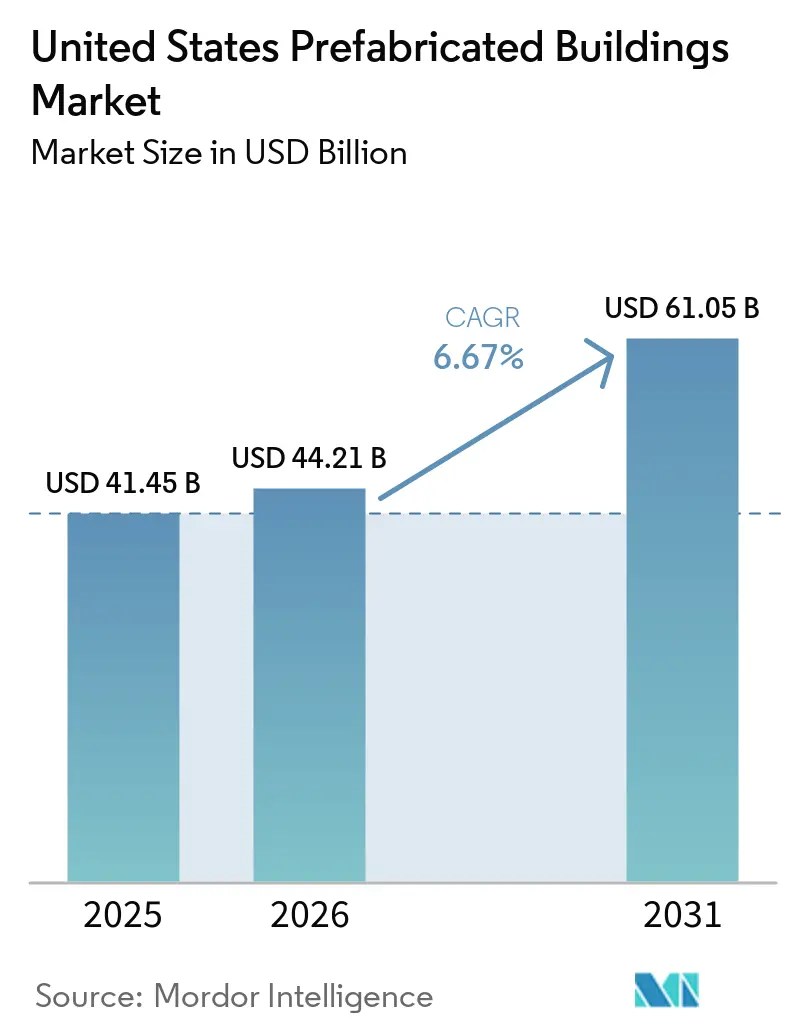
| Base Year Market Size (2025) | USD 41.45 Billion |
| Market Size (2026) | USD 44.21 Billion |
| Market Size (2031) | USD 61.05 Billion |
| Growth Rate (2026 - 2031) | 6.67% CAGR |
| Market Concentration | Medium |
Major Players *Disclaimer: Major Players sorted in no particular order Image © Mordor Intelligence. Reuse requires attribution under CC BY 4.0. | |
United States Prefabricated Buildings Market Analysis by Mordor Intelligence
The United States prefabricated buildings market size was valued at USD 41.45 billion in 2025 and estimated to grow from USD 44.21 billion in 2026 to reach USD 61.05 billion by 2031, at a CAGR of 6.67% during the forecast period (2026-2031). Robust federal net-zero rules, acute labor shortages, and corporate sustainability mandates are encouraging owners and contractors to shift budgets toward factory-built solutions that shorten schedules and curb embodied carbon. Timber remains the dominant material, federal agencies have begun ring-fencing Inflation Reduction Act funds for low-carbon products, and venture capital continues to back robotic volumetric factories that promise repeatable quality. Consolidation among large lessors and fabricators is reshaping competitive dynamics, yet state-level code fragmentation still hampers interstate module flows. Texas anchors demand, California leads growth, and residential applications retain a plural share even as commercial projects accelerate.
Key Report Takeaways
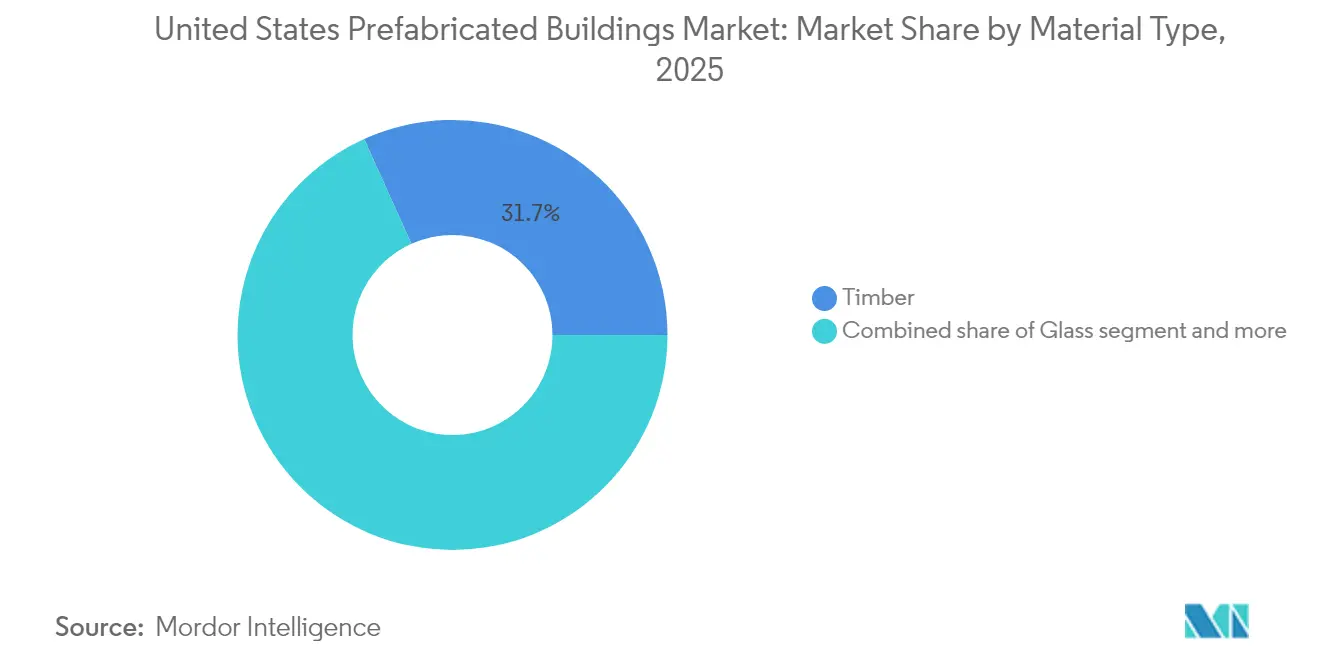
- By material, timber commanded 31.74% of the US prefabricated buildings market share in 2025, while the same material segment is projected to expand at a 7.5% CAGR through 2031.
- By application, residential captured 42.45% of the US prefabricated buildings market size in 2025, and commercial is on track to post the fastest 7.18% CAGR through 2031.
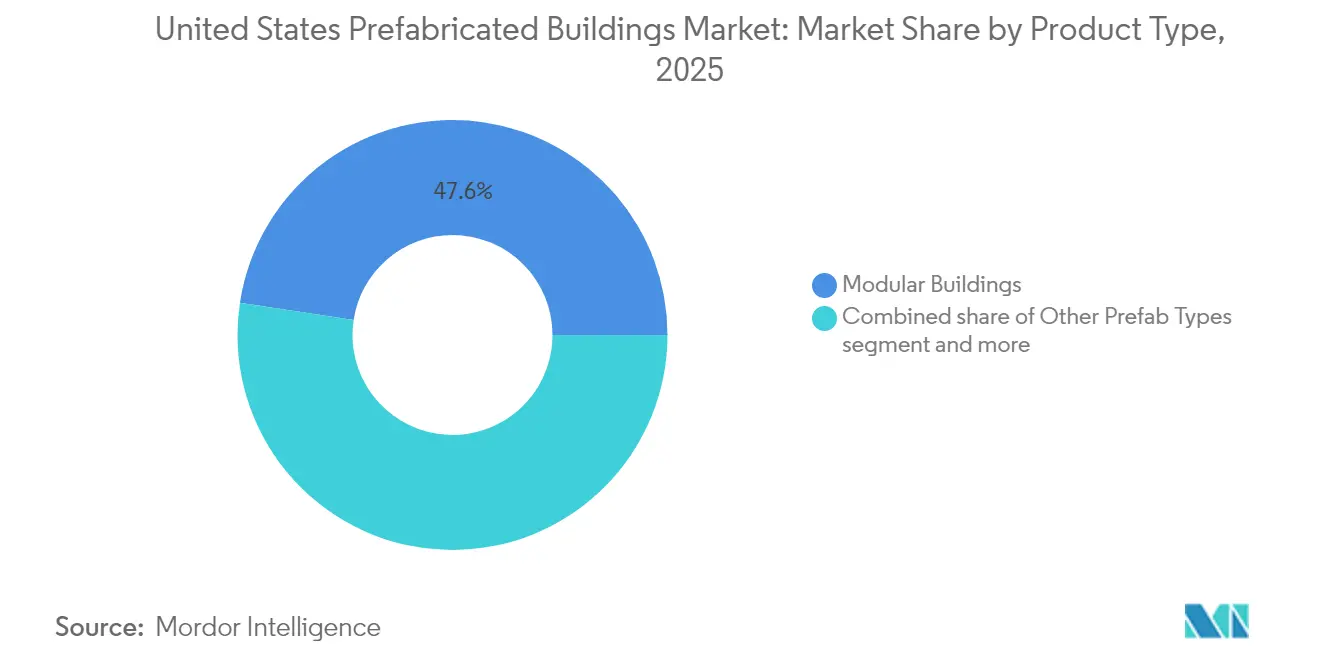
- By product type, modular buildings held 47.60% of the US prefabricated buildings market size in 2025, whereas other prefab types are set to climb at a 7.41% CAGR between 2026 and 2031.
- By geography, Texas accounted for 13.90% of the US prefabricated buildings market share in 2025, and California is forecast to record the quickest 7.62% CAGR during the same horizon.
Note: Market size and forecast figures in this report are generated using Mordor Intelligence’s proprietary estimation framework, updated with the latest available data and insights as of 2026.
United States Prefabricated Buildings Market Trends and Insights
Drivers Impact Analysis*
| Driver | % Impact on CAGR Forecast | Geographic Relevance | Impact Timeline |
|---|---|---|---|
| Rising labour shortages in skilled trades accelerating factory-built adoption | +1.8% | National, acute in high-growth states | Short term (≤ 2 years) |
| Federal-level net-zero mandates pulling forward modular demand | +1.2% | National, concentrated in federal facility-dense regions | Medium term (2-4 years) |
| Corporate ESG targets favouring low-waste off-site construction | +0.9% | National, led by California, New York, Illinois | Medium term (2-4 years) |
| "Made in America" incentives for domestically-sourced mass-timber panels | +0.8% | Pacific Northwest, Southeast timber regions | Medium term (2-4 years) |
| Disaster-recovery funding allocating FEMA prefab housing kits | +0.7% | Disaster-prone coastal and wildfire regions | Short term (≤ 2 years) |
| VC capital inflow into robotic volumetric factories | +0.6% | California, Texas, concentrated tech hubs | Long term (≥ 4 years) |
| Source: Mordor Intelligence | |||
Federal Net-Zero Mandates Accelerate Modular Adoption
Washington’s push for 90% fossil-fuel cuts in new federal buildings from fiscal year 2025 sets a clear preference for turnkey envelopes and pre-integrated systems that are easier to deliver in a plant than on a site. Updated General Services Administration standards add embodied-carbon limits, channeling Inflation Reduction Act dollars directly to suppliers able to verify low-emission outputs. Pilot funding under the Green Proving Ground is testing 17 off-site technologies, and results due in 2026 are likely to codify prefabricated solutions as the default for future public work. Together, these measures formalize a pipeline that lifts baseline volumes for modular factories while reducing finance risk for private developers piggybacking on federal specifications[1]U.S. Department of Energy, “Clean Energy for New Federal Buildings Final Rule,” U.S. Department of Energy, energy.gov.
Rising Labor Shortages Drive Factory-Built Solutions
Contractors enter 2025 needing 439,000 additional workers, with deficits mounting as older tradespeople retire and fewer entrants choose construction careers. Tight labor markets spike overtime premiums and lengthen schedules, so project teams look to assembly-line environments where automation handles repetitive tasks. With construction unemployment at 4.6% and job-opening ratios stubbornly high, factories that require 30% to 50% fewer skilled onsite hours become a hedge against cost overruns. State workforce programs will help, but training pipelines lag present demand, placing the US prefabricated buildings market in a favorable position to capture near-term starts[2]Andrew J. Brown, “2025 Construction Workforce Shortage Update,” Associated Builders and Contractors, abc.org.
Corporate ESG Mandates Favor Low-Waste Construction
Listed companies now file granular climate disclosures, and internal carbon-pricing thresholds often reward building methods that demonstrate tangible emissions cuts. Factory floors achieve material-yield rates above 90%, well ahead of typical site-built projects, and enable full traceability for environmental product declarations. Mass-timber systems sequester carbon, enhance biophilic design, and allow owners to showcase climate leadership. As procurement teams embed life-cycle metrics in bid scoring, suppliers that can certify low-waste, high-recycled-content assemblies gain a competitive edge, fueling momentum across the US prefabricated buildings market.
“Made in America” Timber Incentives Strengthen Domestic Supply
The administration’s mass-timber preference acts as an industrial-policy lever that pulls more volume into domestic mills. USD 80 million in Wood Innovation Grants and new Section 301 investigations into softwood imports are stimulating line expansions for cross-laminated timber within the United States. By locking in federal demand for home-grown panels, policymakers reduce currency fluctuation risk and shorten lead times, encouraging architects to specify engineered wood on both public and private projects. The result is a virtuous loop in which rising capacity meets ramping order books, pushing the US prefabricated buildings market toward greater timber penetration.
Restraints Impact Analysis*
| Restraint | % Impact on CAGR Forecast | Geographic Relevance | Impact Timeline |
|---|---|---|---|
| Bank underwriting bias against non-traditional collateral | -1.1% | National, concentrated in rural markets | Short term (≤ 2 years) |
| Patchwork state codes limiting interstate module movement | -0.8% | National, acute at state borders | Medium term (2-4 years) |
| Perception gap on long-term resale value of prefab homes | -0.7% | Residential markets nationwide | Long term (≥ 4 years) |
| Shortfall of heavy-lift carriers for oversize coastal shipments | -0.4% | Coastal states, major ports | Short term (≤ 2 years) |
| Source: Mordor Intelligence | |||
Patchwork State Codes Create Interstate Barriers
Fifty sets of modular rules add paperwork and extra inspections when a factory ships a bathroom pod across state lines. Virginia’s 2024 adoption of ICC/MBI off-site standards offers a template, but most jurisdictions still enforce unique plan-review protocols that drain time and inflate cost. Lenders and insurers price these frictions into premiums, and some small plants choose to serve only local counties, limiting scale benefits that would otherwise lower unit prices nationwide.
Bank Underwriting Bias Constrains Financing Access
Although the Federal Housing Finance Agency expanded manufactured-home support under Duty-to-Serve, many lenders classify factory-built dwellings as personal property, steering buyers toward higher-rate chattel loans. Appraisers lack comps that capture energy and quality premiums, reducing valuation headroom, and Freddie Mac still bars personal-property mortgages from its pools. Until broader acceptance emerges, capital costs remain higher for many buyers, a headwind the US prefabricated buildings market must offset with efficiency gains and policy advocacy[3]U.S. Federal Housing Finance Agency, “2025–2027 Duty to Serve Manufactured Housing Plan,” Federal Housing Finance Agency, fhfa.gov.
*Our forecasts treat driver/restraint impacts as directional, not additive. The impact forecasts reflect baseline growth, mix effects, and variable interactions.
Segment Analysis
By Material: Timber Captures Share on Sustainability Gains
Timber held a 31.74% US prefabricated buildings market share in 2025, translating to the single-largest material block in dollar terms. Cross-laminated timber and glue-laminated beams now underpin military barracks, higher-education dorms, and mid-rise offices, all helped by federal sourcing preferences that discount domestically produced mass-timber against carbon-intensive steel. The segment’s 7.5% CAGR stems from capacity additions in Oregon, Arkansas, and Alabama, where integrated sawmill-to-panel campuses cut logistics miles and embed rural jobs. Modest price declines expected from these new lines should buffer contractors against commodity swings and extend adoption into price-sensitive multifamily projects.
Growth across metals and concrete remains steady, but these incumbents face stiffer embodied-carbon thresholds under updated GSA material rules. Specialized concrete blends employing slag and fly-ash cut emissions and keep the material competitive, while cold-formed steel framing enjoys popularity in hurricane-prone regions. Glass and composites sit in a smaller niche but benefit from ultra-high-performance façades demanded by tech tenants. Regulatory certainty around timber incentivizes architects to pair wood superstructures with hybrid cores, a trend that sustains volume expansion for engineered panels well beyond the forecast window.


By Application: Commercial Momentum Builds on ESG Targets
Residential accounted for 42.45% of the US prefabricated buildings market size in 2025, but commercial projects are projected to log the quicker 7.18% CAGR to 2031. Corporate tenants chase lower operational emissions and compress build cycles for offices, data centers, and retail shells, making factory-finished modules attractive for both cost and sustainability metrics. Federal agencies, guided by the Green Proving Ground, also direct IRA funds into prefabricated retrofits of legacy stock, anchoring a multiyear demand tail for commercial suppliers.
On the residential front, FEMA now embeds modular units in its Direct Housing Program, most recently delivering 167 long-life homes in Lahaina, Hawaii, within eight months of the wildfire, establishing proof of speed and durability. Innovative builders add solar, battery storage, and heat-pump systems in the factory to hit Zero Energy Ready specifications, broadening appeal among climate-aware buyers. Student housing, healthcare, and light-industrial users populate the “other” slice, each exploiting factory precision to meet stringent infection-control or clean-room standards.
By Product Type: Modular Retains Lead as Hybrids Scale
Modular buildings represented 47.60% of the US prefabricated buildings market size in 2025, maintaining leadership on the back of mature supply chains and broad code familiarity. Standard box dimensions match highway and rail constraints, enabling nationwide distribution without excessive escort fees. Meanwhile, hybrid systems that blend volumetric modules with panelized façades show a 7.41% CAGR, buoyed by robotics that enable component-level customization at scale.
Micro-factories pioneered in California roll a trailer-mounted line onto sites, printing structural walls within a 50-mile service radius and slashing haulage emissions. Established contractors launch in-house module shops, such as Boldt’s Bildt brand, to secure proprietary capacity and embed design-for-manufacture principles upstream. Component suppliers increasingly offer plug-and-play mechanical racks and bathroom pods that integrate seamlessly into both volumetric and panel projects, pushing the US prefabricated buildings market toward a kit-of-parts future.
Geography Analysis
Texas held 13.90% of national demand in 2025, anchored by ample land, light regulation, and robust disaster-recovery spending. Permissive transport rules lower the cost of shipping oversize loads, and an active industrial pipeline, especially in renewable-energy manufacturing, pulls incremental volume into factory-built offices and warehouses. Incentive packages at the state and municipal levels further entice producers to open plants near Interstate 35, facilitating two-day delivery into markets as far north as Kansas or as far east as Georgia.
California’s 7.62% CAGR through 2031 leads all states. Wildfire rebuilding, aggressive Title 24 energy codes, and sizable venture-capital inflows converge to reward advanced off-site methods. Robotic micro-factories in Los Angeles County demonstrate 70% schedule cuts and 30% cost savings, proving viability in a region where labor and permitting costs rank among the nation’s highest. Additionally, state-level zero-net-energy mandates for new commercial buildings after 2030 create a pipeline of projects that naturally align with factory-preassembled envelopes and energy systems.
Florida, New York, and Illinois round out the top five markets. Hurricane-exposed Florida values factory-installed hurricane straps and impact glazing that meet stringent wind codes. New York’s density incentivizes contractors to lift fully finished modules overnight and minimize noise pollution. Illinois benefits from central trucking corridors and reliable grid power that supports climate-controlled plants. Elsewhere, Virginia’s adoption of ICC/MBI standards signals the first meaningful step toward nationwide code reciprocity, a shift that could unlock broader interstate trade and lift smaller-state volumes over the medium term.
Competitive Landscape
The industry is moderately fragmented but is increasingly consolidating due to intensifying scale advantages. In 2024, WillScot Mobile Mini acquired McGrath RentCorp for USD 3.8 billion, adding over 130,000 units and broadening the fleet's geographic reach. This move underscores the premium placed on rental inventories and national service networks. Similarly, Wells bolstered its envelope-to-structure integration with the acquisition of GATE Precast, now boasting 20 plants and a workforce of 2,200 across varied climate zones. In a strategic move, Safe & Green Holdings merged with Olenox and Machfu, integrating renewable energy and IoT monitoring into modular fabrication, underscoring the pivotal role of data in enhancing asset performance.
Technological advancements are creating pronounced disparities between established players and newcomers. Facilities utilizing six-axis robots achieve millimeter-level precision in welding, cutting, and finishing, leading to fewer reworks and reduced warranty claims. The adoption of digital twins facilitates remote quality audits, expediting approvals and payment cycles. At the same time, smaller regional firms are finding success in niche areas like specialty panels, mass-timber shells, and disaster-response units. In the US prefabricated buildings market, buyers prioritize track records, bonding capacity, and expertise in navigating multi-state codes, favoring seasoned operators.
United States Prefabricated Buildings Industry Leaders
Clayton Homes, Inc.
Skyline Champion Corporation
Cavco Industries, Inc.
Katerra Inc. (assets under Volumetric Building Companies)
Entekra LLC
- *Disclaimer: Major Players sorted in no particular order


Recent Industry Developments
- February 2025: Safe & Green Holdings Corp. agreed to merge with New Asia Holdings, adding Olenox Corp. and Machfu.com to integrate sustainable energy and industrial IoT capabilities across its modular portfolio.
- February 2025: FEMA completed 167 modular homes in Lahaina for wildfire survivors, its first deployment of long-life prefabricated units built to International Building Code standards.
- January 2025: LMC added Franklin Homes to its modular unit, enlarging nationwide factory capacity and strengthening distribution to independent retailers.
- January 2025: The Boldt Group launched Bildt as a dedicated fabrication and modular firm, reflecting traditional contractors’ shift toward vertical integration of off-site capabilities.


United States Prefabricated Buildings Market Report Scope
The US prefabricated buildings market covers the growing trends and projects in prefab building markets, like commercial construction, residential construction, and industrial construction. The report also covers the industry along with the type of material used, like concrete, timber, glass, metal, and others. Along with the report's scope, it also analyses the key players and the competitive landscape in the US prefabricated buildings market. The impact of COVID-19 has also been incorporated and considered during the study.
The United States prefabricated buildings industry is segmented by material type (concrete, glass, metal, timber, and other material types) and application (residential, commercial, and other applications (infrastructure and industrial)). The report offers the market size of prefabricated buildings in the United States and forecasts in value (USD) for all the above segments.
By Material
| Concrete |
| Glass |
| Metal |
| Timber |
| Other Materials |
By Application
| Residential |
| Commercial |
| Others |
By Product Type
| Modular Buildings |
| Panelized & Componentized Systems |
| Other Prefab Types |
By States
| Texas |
| California |
| Florida |
| New York |
| Illinois |
| Rest of US |
| By Material | Concrete |
| Glass | |
| Metal | |
| Timber | |
| Other Materials | |
| By Application | Residential |
| Commercial | |
| Others | |
| By Product Type | Modular Buildings |
| Panelized & Componentized Systems | |
| Other Prefab Types | |
| By States | Texas |
| California | |
| Florida | |
| New York | |
| Illinois | |
| Rest of US |


Key Questions Answered in the Report
How large is the US prefabricated buildings market today?
It totaled USD 41.45 billion in 2025 and is projected to cross USD 44.21 billion in 2026 on its way to USD 61.05 billion by 2031.
What CAGR is forecast for US prefabricated building revenues through 2031?
The sector is expected to post a 6.67% CAGR between 2026 and 2031.
Which state offers the biggest revenue pool?
Texas led with a 13.90% share of 2025 sales owing to pro-business rules and robust disaster-recovery spending.
Which application segment is growing fastest?
Commercial projects, driven by corporate ESG targets and federal decarbonization funds, are on track for a 7.18% CAGR.
Page last updated on:


