Market Overview
| Study Period | 2020 - 2031 |
|---|---|
| Forecast Data Period | 2026 - 2031 |
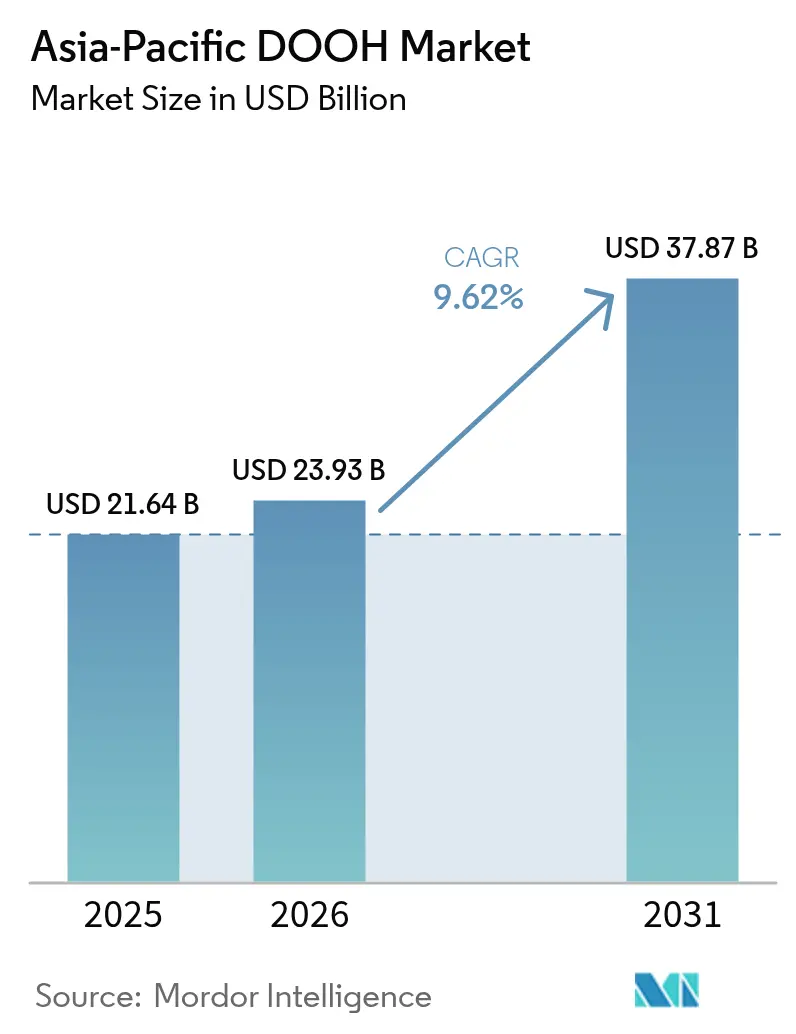
| Base Year Market Size (2025) | USD 21.64 Billion |
| Market Size (2026) | USD 23.93 Billion |
| Market Size (2031) | USD 37.87 Billion |
| Growth Rate (2026 - 2031) | 9.62% CAGR |
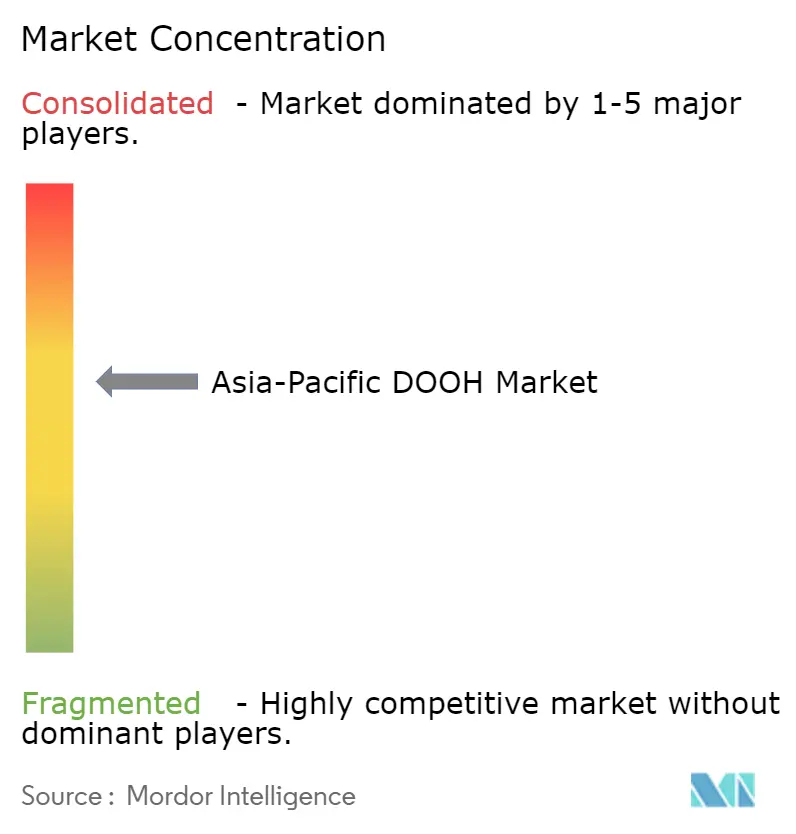
| Market Concentration | Medium |
Major Players *Disclaimer: Major Players sorted in no particular order Image © Mordor Intelligence. Reuse requires attribution under CC BY 4.0. | |
Asia-Pacific DOOH Market Analysis by Mordor Intelligence
The Asia-Pacific DOOH market size is expected to grow from USD 21.64 billion in 2025 to USD 23.93 billion in 2026 and is forecast to reach USD 37.87 billion by 2031 at a 9.62% CAGR over 2026-2031. Advertisers are redirecting budgets to location-verified inventory that operates without third-party cookies, and this shift is increasing demand for programmatic bidding across transit, airport and retail screens. Real-time data feeds enabled by 5G bandwidth are allowing automotive and consumer-electronics brands to run motion-graphic creative that was previously impractical. Carbon-efficient LED panels are widening digital conversion in tier-2 cities as falling component prices reduce capital outlay. Multinational firms are also favoring the Asia-Pacific DOOH market because campaign-level carbon-footprint reporting shows lower emissions than online display.
Key Report Takeaways
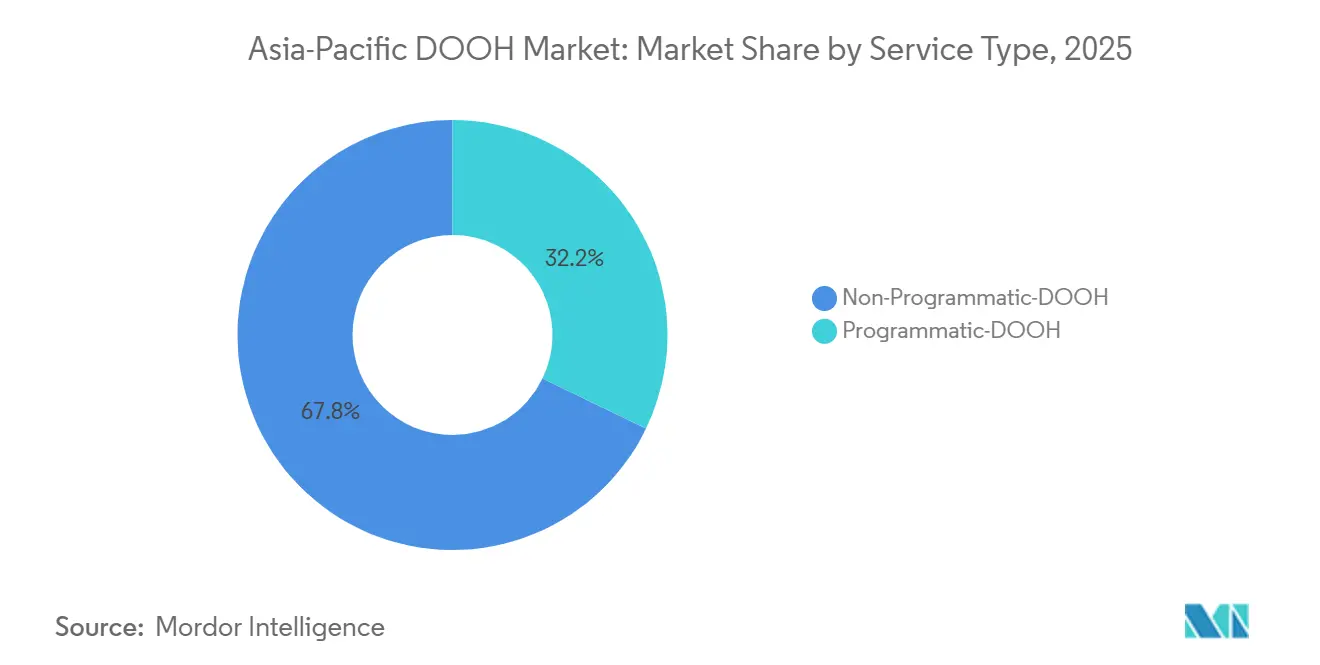
- By service type, non-programmatic formats led with 67.83% revenue share in 2025 while programmatic recorded the fastest 10.12% CAGR through 2031.
- By application, billboards commanded 45.96% of the Asia-Pacific DOOH market size in 2025 and transit screens are advancing at an 11.67% CAGR to 2031.
- By location environment, roadside inventory held 30.74% share of the Asia-Pacific DOOH market size in 2025; airport venues are projected to expand at a 12.23% CAGR during the same horizon.
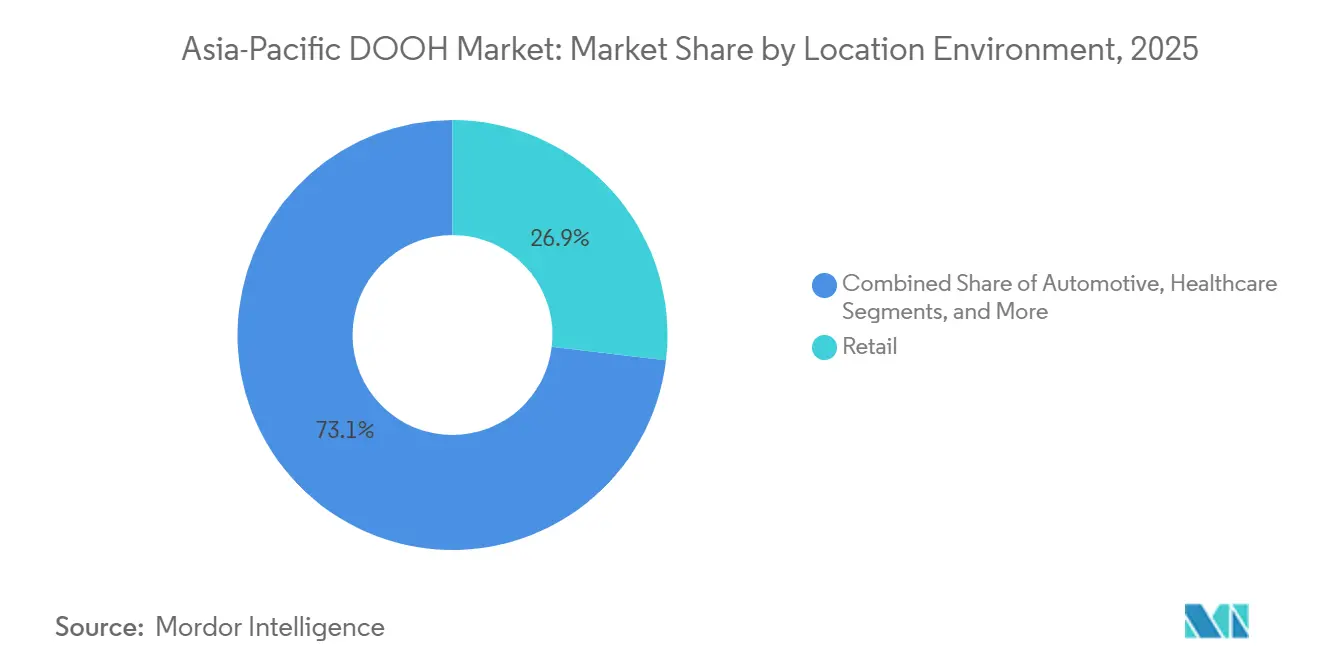
- By end-user industry, retail led with 26.87% share in 2025, whereas healthcare is forecast to grow at a 13.46% CAGR through 2031.
- By geography, China captured 50.79% of the Asia-Pacific DOOH market share in 2025 and India is set to grow the fastest at a 12.38% CAGR between 2026-2031.
Note: Market size and forecast figures in this report are generated using Mordor Intelligence’s proprietary estimation framework, updated with the latest available data and insights as of 2026.
Asia-Pacific DOOH Market Trends and Insights
Drivers Impact Analysis*
| Driver | (~) % Impact on CAGR Forecast | Geographic Relevance | Impact Timeline |
|---|---|---|---|
| 5G Roll-Out Enabling High-Bandwidth Creative | +1.8% | China, South Korea, Japan, Australia, Singapore | Medium term (2-4 years) |
| Rapid Urban Rail Expansion Opening Premium Inventory | +2.1% | India, China, Thailand, Indonesia | Long term (≥ 4 years) |
| Programmatic DOOH Integration with Retail Media Networks | +1.6% | Australia, Singapore, Japan, China | Short term (≤ 2 years) |
| LED Cost Decline Accelerating Digital Conversion | +1.4% | India, Thailand, Rest of Asia-Pacific | Medium term (2-4 years) |
| Carbon-Efficient Screens Appealing to ESG-Driven Advertisers | +0.9% | Global, early adoption in Australia, Japan, Singapore | Long term (≥ 4 years) |
| Brand-Safety Shift from Cookies to Location-Verified DOOH | +1.2% | Australia, Singapore, Hong Kong, Japan | Short term (≤ 2 years) |
| Source: Mordor Intelligence | |||
5G Roll-Out Enabling High-Bandwidth Creative
China deployed more than 3.6 million 5G base stations by late 2025, giving outdoor screens the connectivity needed for live data overlays and 4K video.[1]Ministry of Industry and Information Technology, “China 5G Base Station Deployment Statistics 2025,” miit.gov.cn South Korea reached nationwide 5G coverage the same year, which allowed transit operators to stream motion graphics during peak commutes.[2]Korea Communications Commission, “South Korea Nationwide 5G Coverage Achievement 2025,” kcc.go.kr Australia’s major carriers extended 5G to regional corridors, supporting roadside programmatic video billboards targeted at long-distance travelers. Japan’s NTT Docomo paired 5G positioning services with DOOH networks so campaigns can trigger automatically when pedestrian density rises. The result is a creative canvas that mirrors online video quality while preserving location context, giving the Asia-Pacific DOOH market a distinctive edge over static display formats.
Rapid Urban Rail Expansion Opening Premium Inventory
Delhi Metro’s 455-kilometer network generated INR 4.2 billion (USD 50 million) in advertising revenue in FY 2024-25, with digital screens accounting for 68% of inventory.[3]Delhi Metro Rail Corporation, “Delhi Metro Network Expansion,” delhimetrorail.com Mumbai Metro Phase III added 33.5 kilometers of track and awarded platform concessions to Times Innovative Media, raising digital penetration in India’s commercial capital. China surpassed 10,000 kilometers of urban rail by 2025, and Focus Media now controls digital rights at more than 2,000 stations. Thailand’s MRT Blue Line extension and Jakarta’s MRT Phase II together installed nearly 500 new screens, creating fresh inventory for brands targeting commuters. High dwell times inside stations are producing CPMs 40-60% above roadside panels, making transit the fastest-growing slice of the Asia-Pacific DOOH market.
Programmatic DOOH Integration with Retail Media Networks
Coles and Woolworths embedded 1,800 supermarket screens into their retail media platforms, enabling brands to align store promotions with external placements. Singapore’s FairPrice linked 150 supermarket screens to Moving Walls, letting advertisers swap creative instantly when inventory levels or weather patterns change. Japan’s Aeon Mall integrated 500 displays with Yahoo Japan’s DSP, bridging off-site reach with on-premise conversions. Research from TNL Mediagene forecasts that retail media networks will take 15% of Asia-Pacific digital ad spend by 2027, and DOOH is the offline anchor for that rise. This trend upgrades the Asia-Pacific DOOH market from a pure branding medium to a performance channel with closed-loop attribution.
LED Cost Decline Accelerating Digital Conversion
Outdoor-rated LED panels fell to USD 800-2,500 per m² in 2025, down roughly 30% from 2023, because of supply surpluses in Chinese manufacturing hubs and driver-IC efficiency gains. Indian firms like Laqshya Media used the lower prices to digitize billboards in Pune, Ahmedabad and Jaipur. Thailand’s Plan B Media converted 120 static sites and now recoups its capital spending in under three years. Sharp’s 2025 LED range cuts power draw by 25%, which further reduces total cost of ownership. The falling entry barrier is widening participation, injecting fresh supply into the Asia-Pacific DOOH market and spurring competition across secondary cities.
Restraints Impact Analysis*
| Restraint | (~) % Impact on CAGR Forecast | Geographic Relevance | Impact Timeline |
|---|---|---|---|
| Fragmented Media Ownership Inflating Buying Complexity | -1.3% | India, Thailand, Indonesia, Rest of Asia-Pacific | Medium term (2-4 years) |
| Power-Price Volatility Raising Operating Costs | -1.1% | Australia, India, Japan | Short term (≤ 2 years) |
| Data-Privacy Regulations Limiting Mobile Retargeting | -0.8% | Singapore, China, India, Australia | Long term (≥ 4 years) |
| Shortage of DOOH-Skilled Creatives in Emerging Markets | -0.6% | India, Thailand, Indonesia, Rest of Asia-Pacific | Medium term (2-4 years) |
| Source: Mordor Intelligence | |||
Fragmented Media Ownership Inflating Buying Complexity
India hosts more than 200 regional operators, none with more than 8% national share, forcing advertisers to negotiate multiple contracts and adapt artwork for divergent screen specs. Thailand shows similar dispersion, with Plan B, Master Ad and VGI controlling different venues and selling in silos. Indonesia counts roughly 150 operators, many still offline, and lacks uniform measurement protocols. The fragmentation raises the minimum viable budget and slows programmatic scale, tempering growth in the Asia-Pacific DOOH market. Consolidation, or third-party aggregators that pool inventory, is emerging as a prerequisite for frictionless buying.
Power-Price Volatility Raising Operating Costs
Australian commercial tariffs climbed 18.3% year on year in 2025, adding USD 8,000-12,000 of extra energy costs per billboard.[4]Australian Energy Regulator, “Australian Commercial Electricity Price Trends 2025,” aer.gov.auIndian industrial rates rose 6.5% as states levied surcharges for renewable subsidies. Japan’s rates increased 9% because of higher LNG import costs, squeezing margins for rail-based screen networks. Screens typically consume 200-500 W per m², equating to USD 1,500-4,000 in annual electricity per display. Operators are responding with solar add-ons and time-of-use billing, yet volatility remains a structural headwind for the Asia-Pacific DOOH market.
*Our forecasts treat driver/restraint impacts as directional, not additive. The impact forecasts reflect baseline growth, mix effects, and variable interactions.
Segment Analysis
By Service Type: Programmatic Automation Reshapes Buying
Programmatic inventory represented 32.17% of 2025 revenue, and its 10.12% CAGR positions it to capture a growing slice of the Asia-Pacific DOOH market size through 2031. Australia leads adoption, with 31% of national spend transacted programmatically after oOh!media and QMS Media launched self-serve portals. Singapore follows at 22% as Moving Walls links to The Trade Desk and Google DV360. China remains under 10% because Focus Media favors direct deals, but AI-assisted dynamic creative is laying groundwork for gradual change.
Non-programmatic formats retain 67.83% share because premium airport and transit contracts demand guaranteed impression volumes. JCDecaux’s long-term concessions at Changi and Hong Kong International exemplify this preference for exclusivity. The Asia-Pacific DOOH market share split is therefore evolving into a hybrid model where programmatic drives incremental roadside and mall yield while direct sales secure high-value hubs.


By Application: Transit Captures Commuter Attention
Billboard screens accounted for 45.96% of 2025 spend, but transit inventory is closing the gap quickly as metro-rail density rises. Delhi Metro’s 286 stations generated USD 50 million in ad revenue, and digital screens supplied 68% of that total. Bangkok’s Blue Line and Jakarta’s MRT added nearly 500 new displays in the last two years. As a result, the Asia-Pacific DOOH market size for transit is projected to jump at an 11.67% CAGR through 2031.
The captive dwell time in stations averages over five minutes, letting advertisers deliver sequential storytelling or QR-code activations. Street-furniture formats, while smaller in share, knit together roadside and transit reach by filling hyper-local gaps. Their granular targeting will keep them relevant even if they never match the scale of billboards and transit.
By Location Environment: Airports Command Premium CPMs
Roadside panels held 30.74% revenue share in 2025, supported by national highway expansion and regulatory easing on digital brightness limits. Airports, however, are expected to outpace every other venue with a 12.23% CAGR, driven by 5G networking and duty-free retail tie-ins. JCDecaux installed 250 high-resolution displays across Singapore Changi’s four terminals and the upcoming Terminal 5. Hong Kong International boosted its screen count 40% and now offers dynamic creative based on flight origin data.
Airport CPMs run three-to-five times higher than roadside equivalents, reflecting affluent traveler demographics and constrained inventory supply. Malls and indoor retail spaces sit between the two extremes, providing both shopper intent and commuter scale. The Asia-Pacific DOOH market share is likely to rebalance toward airports and malls as advertisers chase premium audiences and first-party retail data.

By End-User Industry: Healthcare Emerges as Growth Leader
Retail was the largest spender at 26.87% in 2025, capitalizing on loyalty data and in-store promotions to link screens with point-of-sale activity. Healthcare spending is rising the fastest, set to grow 13.46% annually as hospital networks in Australia and India deploy waiting-area screens. Healthscope installed displays across 120 Australian hospitals, and Apollo Hospitals deployed 300 screens in India for pharmaceutical education.
Asia-Pacific’s population aged 65+ will reach 580 million by 2030, lifting demand for wellness campaigns that require contextual, privacy-compliant channels. Banking, automotive and entertainment remain core buyers, but the strong demographic tailwind means healthcare’s slice of the Asia-Pacific DOOH market size will continue to expand.
Geography Analysis
China contributed 50.79% of total 2025 spend, fueled by Focus Media’s 700,000-screen footprint and exclusive elevator concessions. The country’s 10,000-kilometer urban-rail grid provides a closed network where advertisers can follow commuters from home elevators to subway platforms, reinforcing message frequency. Personal-information rules restrict phone-level retargeting, yet aggregated location signals are still permissible, keeping growth on track.
India is the fastest-growing territory, rising 12.38% annually on the back of metro-rail digitization in Delhi, Mumbai and Bangalore. Programmatic start-ups such as AdOnMo are stitching together tier-2 city screens, using lower LED costs to make the upgrade economics viable. Although media ownership is fragmented, new aggregators are starting to streamline buying, and the Asia-Pacific DOOH market share captured by India will rise steadily through 2031.
Australia enjoys the region’s highest programmatic penetration at 31%, thanks to oOh!media and QMS Media integrations with Vistar, The Trade Desk and Google DV360. High energy prices have nudged operators toward solar retrofits, but those costs are offset by premium CPMs in airport and roadside corridors. Singapore, South Korea, Thailand and Hong Kong each occupy niche leadership positions in programmatic adoption, 5G creative or transit density, complementing the broader Asia-Pacific DOOH market growth trajectory.
Competitive Landscape
The Asia-Pacific DOOH market is moderately fragmented. The top five operators control 42% of revenue, leaving ample headroom for regional challengers and niche specialists. Focus Media dominates China through elevator and cinema contracts, while JCDecaux leads in cross-border airport concessions. In Australia, oOh!media and QMS Media differentiate through self-serve programmatic stacks that shorten booking cycles and expose long-tail advertisers to premium screens.
Technology investment is redrawing boundaries. Operators acquiring CMS vendors like Broadsign gain recurring software income and tighter control over performance data. JCDecaux’s 2025 patent filing for blockchain impression verification aims to reassure brands about ad delivery and could become a de-facto standard if widely licensed. Carbon-footprint reporting, pioneered through Broadsign-Scope3 integrations, has also emerged as a competitive lever with multinationals under net-zero mandates.
Mergers and stakes are increasing: Clear Channel’s 25% purchase of Thailand’s Master Ad opened Bangkok’s BTS network, and similar deals are brewing in Indonesia and Vietnam where operator counts top 300. New entrants such as Moving Walls aggregate fragmented inventory via software, allowing them to compete without owning physical assets. The shifting mix of consolidation, technology and ESG transparency will determine future winners across the Asia-Pacific DOOH market.
Asia-Pacific DOOH Industry Leaders
JCDecaux Group
Clear Channel Outdoor Holdings Inc.
BroadSign International LLC
Outfront Media Inc.
Times Innovative Media Limited
- *Disclaimer: Major Players sorted in no particular order

Recent Industry Developments
- February 2026: JCDecaux unveiled a single interface that lets brands run programmatic DOOH across 80 countries, integrating real-time bidding, dynamic creative and carbon reporting.
- September 2025: New Zealand’s oOh!media, JCDecaux and QMS Media launched knOOH, a joint measurement platform using mobile and transit footfall data.
- June 2025: QMS Media added 240 roadside panels and equipped them with solar arrays to offset energy costs.
- May 2025: QMS Media selected Broadsign’s cloud CMS for real-time creative updates across 1,800 displays.


Asia-Pacific DOOH Market Report Scope
Digital Out-Of-Home (DOOH) is a marketing channel where promotional media is dynamically and digitally displayed in indoor/outdoor public areas. In other words, it integrates offline out-of-home advertising with digital elements. This trend of Digital OOH has created its dominance over traditional offline out-of-home advertising.
The Asia-Pacific DOOH Market Report is Segmented by Service Type (Programmatic-OOH and Non-Programmatic-OOH), Application (Billboard, Transit, Street Furniture, and Other Applications), Location Environment (Roadside Outdoor, Airports, Malls and Transit Hubs, In-Store and Indoor Venues, and Other Location Environments), End-User Industry (Automotive, Retail, Healthcare, Banking and Financial Services, Media and Entertainment, and Other End-User Industries), and Geography (China, Japan, India, South Korea, Australia, Singapore, Thailand, Hong Kong, and Rest of Asia-Pacific). The Market Forecasts are Provided in Terms of Value (USD).
By Service Type
| Programmatic-DOOH |
| Non-Programmatic-DOOH |
By Application
| Billboard |
| Transit |
| Street Furniture |
| Other Applications |
By Location Environment
| Roadside Outdoor |
| Airports |
| Malls and Transit Hubs |
| In-Store and Indoor Venues |
| Other Location Environments |
By End-User Industry
| Automotive |
| Retail |
| Healthcare |
| Banking and Financial Services (BFSI) |
| Media and Entertainment |
| Other End-User Industries |
By Geography
| China |
| Japan |
| India |
| South Korea |
| Australia |
| Singapore |
| Thailand |
| Hong Kong |
| Rest of Asia-Pacific |
| By Service Type | Programmatic-DOOH |
| Non-Programmatic-DOOH | |
| By Application | Billboard |
| Transit | |
| Street Furniture | |
| Other Applications | |
| By Location Environment | Roadside Outdoor |
| Airports | |
| Malls and Transit Hubs | |
| In-Store and Indoor Venues | |
| Other Location Environments | |
| By End-User Industry | Automotive |
| Retail | |
| Healthcare | |
| Banking and Financial Services (BFSI) | |
| Media and Entertainment | |
| Other End-User Industries | |
| By Geography | China |
| Japan | |
| India | |
| South Korea | |
| Australia | |
| Singapore | |
| Thailand | |
| Hong Kong | |
| Rest of Asia-Pacific |


Key Questions Answered in the Report
How large will Asia-Pacific DOOH advertising be by 2031?
Forecasts put the Asia-Pacific DOOH market size at about USD 37.87 billion by 2031, expanding at a 9.62% CAGR from 2026.
Which venue type is growing the fastest within regional DOOH?
Airport screens are projected to post a 12.23% CAGR through 2031 because of duty-free partnerships and 5G-driven creative optimization.
Why is programmatic adoption higher in Australia than other markets?
Australia's oOh!media and QMS Media integrated with Vistar, The Trade Desk and Google DV360 early, so 31% of national DOOH spend was programmatic by late 2025.
What challenges slow DOOH roll-outs in India and Indonesia?
Highly fragmented media ownership forces advertisers to negotiate many small contracts, raising campaign costs and delaying programmatic scale.
How does DOOH compare with online display on carbon emissions?
Broadsign-Scope3 data show a DOOH impression produces around 0.35 g of CO₂ equivalent, versus 3.6 g for an online display ad, attracting ESG-minded brands.
Which end-user vertical is the fastest-growing?
Healthcare is set to rise at a 13.46% CAGR as hospitals and pharmacies adopt waiting-area screens for wellness and pharmaceutical education.
Page last updated on:


