
United States Industrial Wood Coatings Market Size and Share
Market Overview
| Study Period | 2020 - 2031 |
|---|---|
| Forecast Data Period | 2026 - 2031 |
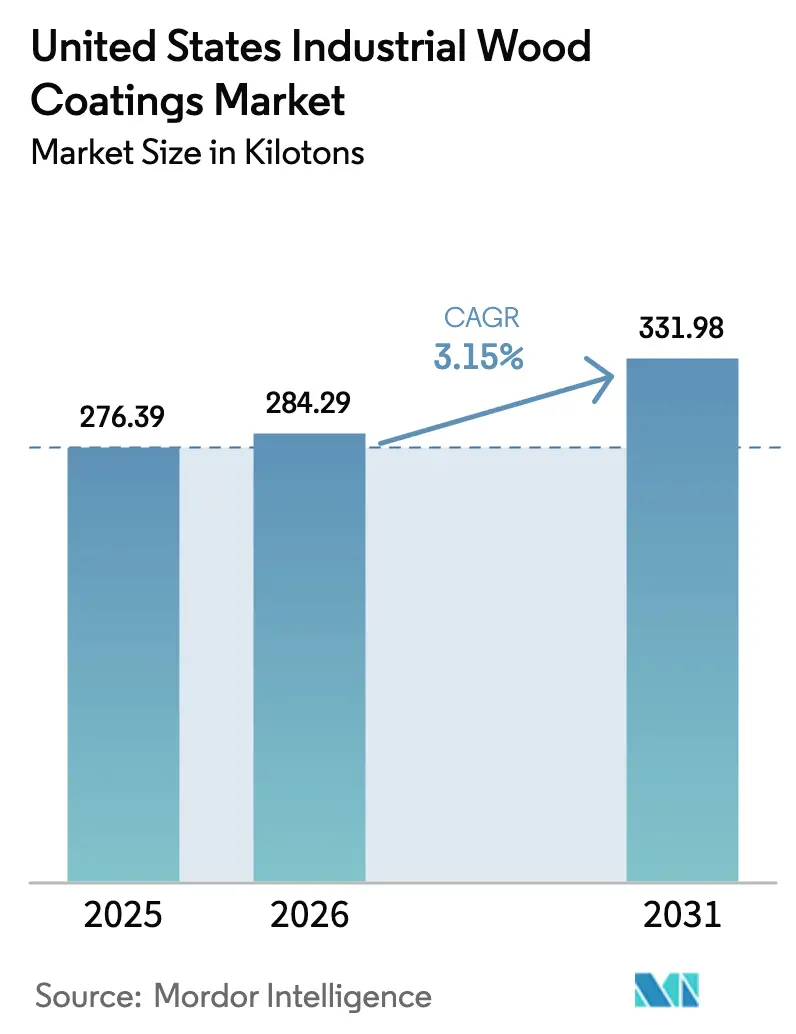
| Base Year Market Size (2025) | 276.39 kilotons |
| Market Volume (2026) | 284.29 kilotons |
| Market Volume (2031) | 331.98 kilotons |
| Growth Rate (2026 - 2031) | 3.15 % |
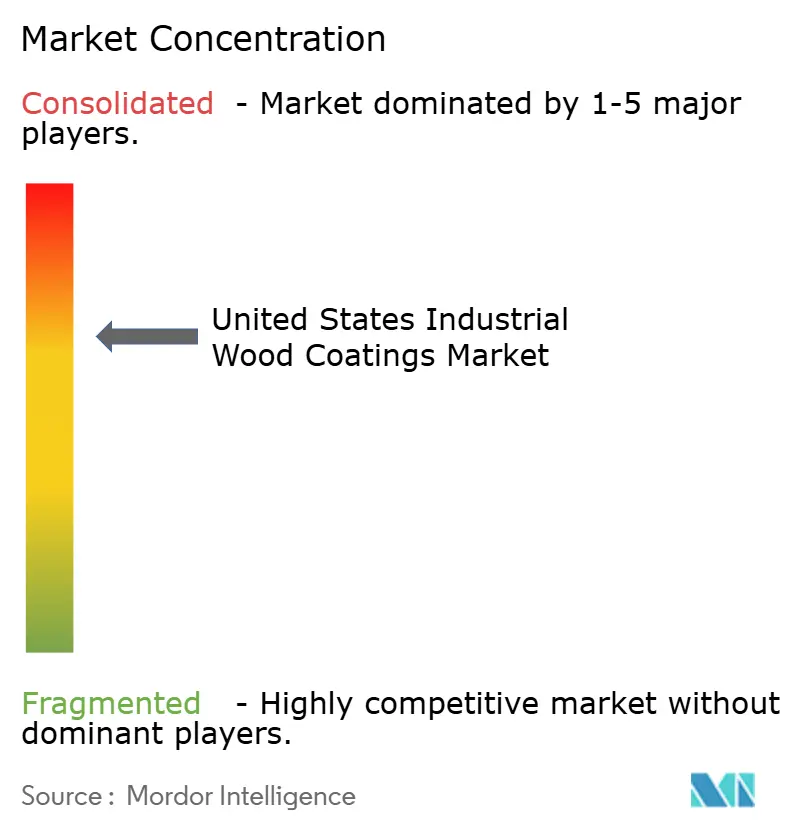
| Market Concentration | Medium |
Major Players *Disclaimer: Major Players sorted in no particular order Image © Mordor Intelligence. Reuse requires attribution under CC BY 4.0. | |
United States Industrial Wood Coatings Market Analysis by Mordor Intelligence
The United States Industrial Wood Coatings Market size is expected to grow from 276.39 kilotons in 2025 to 284.29 kilotons in 2026 and is forecast to reach 331.98 kilotons by 2031 at a 3.15% CAGR over 2026-2031. A steady housing pipeline, resilient remodeling spend, and regulatory pressure for low-VOC finishes are reshaping product demand and supply-chain economics. Water-borne chemistries are eroding the historical dominance of solvent-borne polyurethanes as California’s 275 g/L ceiling and the EPA’s 45 % weight limit accelerate formulation change-outs. Furniture makers and cabinet refinishers are gravitating toward quick-cure, low-flammability systems that cut floor time and insurance premiums, while joinery OEMs leverage conveyorized UV lines to bypass on-site compliance. Rising automation, raw-material volatility, and a widening gap between national and regional formulators are setting the stage for a slow but decisive technology shift across the industrial wood coatings market.
Key Report Takeaways
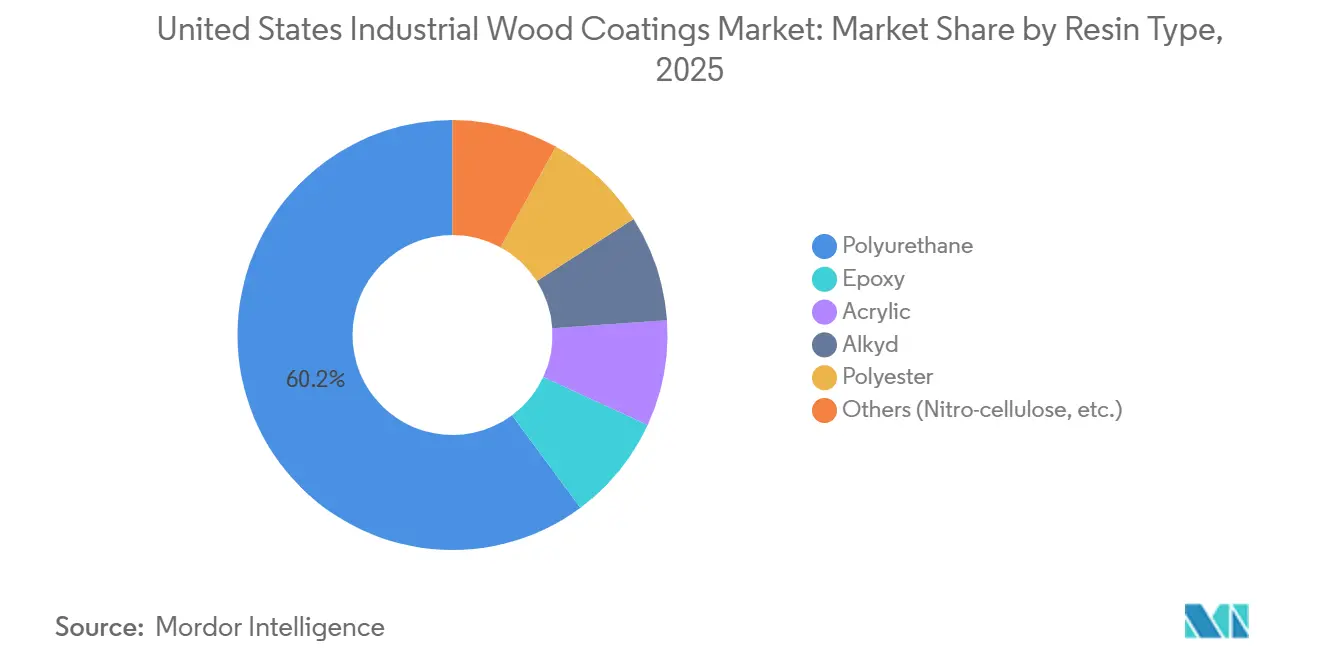
- By resin type, polyurethane commanded 60.15 % of the United States industrial wood coatings market share in 2025, expanding at a 3.69 % CAGR through 2031.
- By technology, water-borne formulations are projected to register the fastest growth at 3.82 % CAGR between 2026-2031, while solvent-borne systems retained 65.27 % share in 2025.
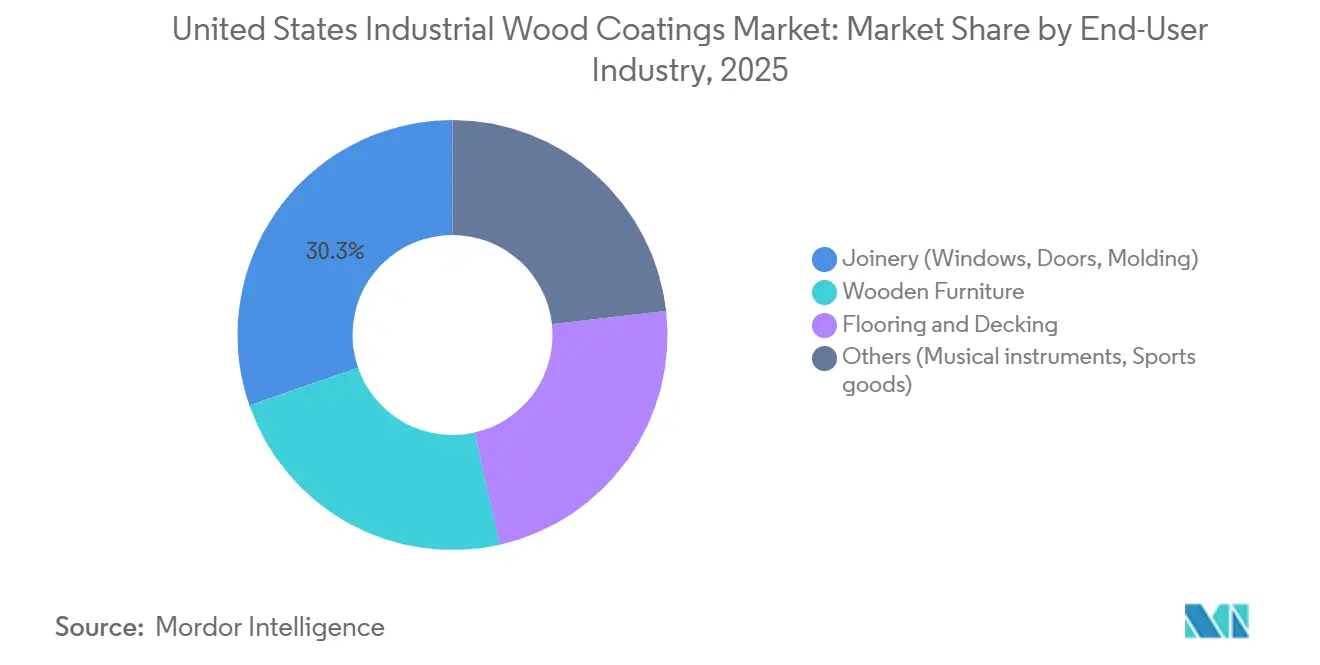
- By end-user industry, joinery led with 30.32 % of 2025 volume, whereas wooden furniture is forecast to grow the quickest at 3.61 % CAGR to 2031.
Note: Market size and forecast figures in this report are generated using Mordor Intelligence’s proprietary estimation framework, updated with the latest available data and insights as of 2026.
United States Industrial Wood Coatings Market Trends and Insights
Drivers Impact Analysis*
| Drivers | (~) % Impact on CAGR Forecast | Geographic Relevance | Impact Timeline |
|---|---|---|---|
| Rising U.S. furniture and cabinetry production | +0.8% | National, with concentration in North Carolina, California, Texas | Medium term (2-4 years) |
| Residential remodeling boom post-COVID | +0.6% | National, strongest in Sun Belt metros (Phoenix, Austin, Charlotte) | Short term (≤ 2 years) |
| Regulatory push toward low-VOC formulations (OTC/EPA) | +0.7% | National, with California and Northeast leading adoption | Long term (≥ 4 years) |
| Adoption of robotics and conveyorised spray lines | +0.4% | National, early gains in Michigan, Wisconsin, Indiana furniture clusters | Medium term (2-4 years) |
| "Build-to-Rent" housing boosts pre-finished millwork | +0.5% | National, concentrated in Atlanta, Dallas, Phoenix, Denver BTR hubs | Medium term (2-4 years) |
| Source: Mordor Intelligence | |||
Rising U.S. Furniture and Cabinetry Production
Domestic furniture output slipped 4.6 % between Q3 2024 and Q3 2025, yet commercial office furniture and custom cabinetry volumes expanded 3-5 %, underscoring a shift toward made-to-order programs that favor fast-cure water-borne coats[1]. Mill shops are shortening order-to-ship windows to 24-48 hours, leaving little tolerance for solvent flash-off. As a result, wooden furniture demand is tracking a 3.61 % CAGR and steadily widening its contribution to overall industrial wood coatings market growth. Suppliers are reallocating research and development budgets toward high-solids acrylics and low-temperature UV systems that cure in minutes, enabling shops to reclaim floor space and accelerate cash cycles. The production bifurcation also incentivizes inventory-light business models that require universally compliant, multi-substrate products.
Residential Remodeling Boom Post-COVID
Remodeling outlays stayed elevated through 2025, buoyed by accumulated home-equity gains even as borrowing costs edged higher[2]. Cabinet-refacing contractors—now 12-15 % of total coating volume—prefer water-borne acrylics and LED-UV systems that allow same-day re-installation. The Congressional Budget Office’s forecast of 1.68 million annual housing starts from 2025-2029 underpins sustained millwork demand well into the next decade. The remodeling channel’s appetite for zero-VOC, odor-free finishes is accelerating the transition away from solvent-heavy legacies within the industrial wood coatings market. Regional paint makers with agile tinting infrastructure are capitalizing on this shift, picking up share from national brands encumbered by big-box distribution.
Regulatory Push Toward Low-VOC Formulations (OTC/EPA)
California’s 275 g/L limit and the EPA’s 2025 aerosol rule are forcing a systematic reformulation cycle, with nationwide implications once other states harmonize standards. SCAQMD’s pending Rule 1136 amendment could pivot 10-15 % of Los Angeles Basin volume from solvent-borne to water-borne systems within two years. Large formulators amortize compliance costs across national volumes, safeguarding share, while smaller players struggle with per-SKU certification expenses that run three to five times higher. The resulting regulatory arbitrage is creating twin supply chains—compliant for coastal metros and legacy for inland states—boosting working-capital needs by 12-18 % for multi-state distributors yet protecting gross margins in both segments of the industrial wood coatings market.
Adoption of Robotics and Conveyorized Spray Lines
Furniture hubs in Michigan, Wisconsin, and Indiana are automating spray booths to offset labor scarcity and cut material waste. Robotic cells slash overspray 20-30 % and demand “robot-ready” coatings with eight-hour pot life, compelling suppliers to redesign rheology profiles. Capital outlays of USD 0.5-2 million per line concentrate adoption among mid-sized OEMs, widening a technology gap with small shops. UV lines integrated with robotics now cure topcoats in under a minute, freeing the factory floor for secondary assembly. This manufacturing upgrade is tightening service expectations and propelling specialized product introductions throughout the industrial wood coatings market.
Restraints Impact Analysis*
| Restraints | (~) % Impact on CAGR Forecast | Geographic Relevance | Impact Timeline |
|---|---|---|---|
| Stringent federal and state VOC/HAP ceilings (SCAQMD, CARB) | -0.5% | National, most acute in California, Northeast Ozone Transport Region | Long term (≥ 4 years) |
| Volatile petro-resin and TiO₂ prices | -0.4% | National, with pass-through constraints in commodity furniture segments | Short term (≤ 2 years) |
| Intermittent polyester-polyol shortages | -0.3% | National, supply concentrated in Gulf Coast petrochemical complexes | Medium term (2-4 years) |
| Source: Mordor Intelligence | |||
Stringent Federal and State VOC/HAP Ceilings (SCAQMD, CARB)
Maintaining discrete SKUs for California, the Northeast OTR, and the broader U.S. fragments production runs and lifts unit costs. Each new formulation cycle demands 12-18 months and USD 50,000-150,000 in lab, field, and emissions testing. Smaller brands consequently withdraw from complex jurisdictions or cede toll-manufacturing to national competitors, hastening consolidation. The regulatory squeeze weighs heaviest on solvent-borne polyurethanes, nudging specifiers toward water-borne systems that meet limits yet trade off peak durability. Over time, the compliance gap will narrow the addressable solvent-borne pool inside the industrial wood coatings market.
Volatile Petro-Resin and TiO₂ Prices
TiO₂ hovered near USD 3,200 per ton in 2024 following Chinese capacity curtailments, while polyester shortages in Q1 2025 raised UV-formulation costs. PPG cited a USD 200 million raw-material headwind for 2025; Sherwin-Williams reported pricing lags of two to three quarters. OEMs faced with razor-thin margins resist pass-through hikes, compressing supplier spreads to single digits. Larger formulators are securing long-term TiO₂ and polyol contracts, effectively locking in 8-12 % cost advantages over spot buyers and protecting leading positions in the industrial wood coatings market.
*Our forecasts treat driver/restraint impacts as directional, not additive. The impact forecasts reflect baseline growth, mix effects, and variable interactions.
Segment Analysis
By Resin Type: Polyurethane Anchors Durability-Critical Applications
Polyurethane held 60.15 % of 2025 volume and will track a 3.69 % CAGR to 2031, sustained by abrasion-resistant flooring and sun-fast exterior joinery. The industrial wood coatings market size for polyurethane is projected to expand in tandem with Build-to-Rent demand for durable, factory-finished millwork. Water-borne acrylics, though faster curing, cede high-traffic niches to polyurethanes but win interior cabinetry jobs where odor and insurance costs matter more than ultimate scratch resistance. Alkyds persist in decorative glazing, while epoxies protect laboratory benches and food-service tables from chemical abuse. Polyester resins, paired with UV-cure and low-temperature powder, are opening throughput gains five to ten times higher than legacy bake systems, creating sub-segments where performance and sustainability align.
Specialty nitrocellulose lacquers remain staples for musical instruments, enabling thin-film builds that resonate acoustically and ease refinishing. These niche chemistries command two to three times the per-gallon price of mainstream products, sustaining robust margins despite negligible volume. Overall, polyurethanes will retain the largest slice of the industrial wood coatings market share, yet the value growth narrative will steadily migrate toward water-borne, UV, and powder innovations that carry higher price points and regulatory headroom.

By Technology: Water-Borne Systems Gain on Regulatory Tailwinds
Solvent-borne technologies represented 65.27 % of 2025 consumption, while water-borne systems are growing at a CAGR of 3.82%. The industrial wood coatings market size for water-borne chemistries is poised to climb alongside California’s compliance premium and nationwide aerosol limits. Furniture manufacturers adopting water-borne lines report 10-15 % lower fire-insurance premiums and faster plant turns due to reduced flash-off times. UV-curable topcoats, though still a niche, are posting double-digit growth on conveyorized lines that reach full hardness in seconds, eliminating bake ovens and trimming energy bills.
Powder coatings remain constrained by wood’s thermal sensitivity, yet low-bake formulations curing at 120-140 °C are opening new MDF and engineered-wood frontiers. Solvent-borne systems will not disappear; their unbeatable flow and edge-coverage keep them entrenched in architectural doors and exterior joinery. However, the share gap is narrowing: by 2031 water-borne chemistries could tip past 40 % of the industrial wood coatings market if performance parity on early-block and stain resistance is attained, a horizon realistic given current research and development trajectories.
By End-User Industry: Joinery Leads, Furniture Grows Fastest
Joinery maintained 30.32 % of 2025 volume, fueled by BTR housing starts that favor factory-finished doors, windows, and trim. The industrial wood coatings market share for joinery will edge downward as furniture accelerates, but absolute tonnage remains bullish given steady residential completions. Wooden furniture is charting a 3.61 % CAGR through 2031, energized by hybrid-work lifestyles driving home-office upgrades and by consumer pivots to customizable cabinetry. Fast-dry, low-odor coatings align with just-in-time production, elevating water-borne and UV lines that fit 48-hour ship windows.
Flooring and decking keep solvent-borne polyurethanes relevant, as foot-traffic and UV exposure override VOC priorities. Specialty segments—musical instruments, sports goods—represent demand for high-quality coatings. Guitar OEMs refuse to abandon nitrocellulose despite flammability hurdles, while high-end bat makers demand flexible topcoats that withstand impact shocks. Suppliers able to straddle both high-volume commodity and low-volume boutique applications position themselves for balanced growth across the industrial wood coatings market.
Geography Analysis
California, the Northeast Ozone Transport Region, and Texas collectively accounted for a significant national volume, establishing the tri-core of regulatory and consumption weight within the industrial wood coatings market. California’s 275 g/L cap marginally boosts per-gallon pricing—an 8-12 % premium that customers absorb due to limited supplier alternatives and prohibitive re-qualification costs. Los Angeles Basin formulators thus sustain higher gross margins even as SKU complexity rises.
The Midwest furniture belt—Michigan, Wisconsin, Indiana, North Carolina—leverages proximity to Gulf Coast resin plants, shaving USD 0.15-0.25 per gallon in freight relative to West Coast peers. Automation adoption is highest here, with robotic spray lines elevating finish uniformity and lowering scrap. These gains are channeling incremental volume to coatings optimized for eight-hour pot life and tight viscosity windows, setting new performance baselines for the industrial wood coatings market.
Sun Belt metros such as Phoenix, Austin, Charlotte, and Atlanta are posting the fastest demand upticks, tied to BTR construction and sustained remodeling. The Congressional Budget Office’s 1.68 million annual start projection (2025-2029) anchors long-run volume growth even as financing costs normalize. Regional players equipped with agile logistics and direct contractor relationships are exploiting this growth pocket, while national brands rely on distribution heft to defend share.
Regulatory Landscape
Industrial wood coating operations in the United States are governed primarily by Clean Air Act-based VOC and hazardous air pollutant (HAP) controls. For wood building products, the US EPA regulates HAP emissions under NESHAP for Surface Coating of Wood Building Products (40 CFR Part 63, Subpart QQQQ), covering compounds such as xylenes, toluene, and formaldehyde, and driving ongoing investments in compliant formulations, capture, and recordkeeping systems.
At the state and regional level, low-VOC requirements shape product specifications and SKU strategies, with California acting as a key reference point through a 275 g/L VOC ceiling for relevant categories and South Coast Air Quality Management District (SCAQMD) Rule 1136 used as a benchmark for stricter compliance in parts of Southern California. Ongoing and pending rule updates under SCAQMD and broader harmonization dynamics between coastal and inland jurisdictions influence reformulation cadence, qualification timelines, and the pace of conversion toward water-borne and other lower-emission technologies.
Value Chain Analysis
The value chain starts with upstream feedstocks and intermediates such as resins (polyurethane, acrylic, polyester), pigments (including titanium dioxide), solvents, and performance additives, then moves into formulation, blending, and quality control at coatings manufacturers. Large suppliers such as Sherwin-Williams, PPG, Akzo Nobel, Axalta, and RPM typically operate multi-plant networks and procurement programs that can reduce exposure to spot volatility for critical inputs, while regional formulators compete through shorter lead times, niche chemistries (UV-curable and low-temperature powder), and localized technical service.
Downstream, industrial wood coatings flow through a mix of direct-to-OEM supply (joinery and furniture plants), distributors, and finishing-system integrators serving cabinet refinishers and smaller shops. Compliance obligations tied to NESHAP (40 CFR Part 63, Subpart QQQQ) and tighter VOC rules in jurisdictions such as California and SCAQMD affect packaging, labeling, emissions documentation, and the need to maintain multiple compliant SKUs, which raises working-capital requirements for multi-state distributors. Application and curing equipment providers (spray automation and UV/LED-UV lines) also play an increasingly central role, since line speed, pot life, and cure-window requirements shape which coating technologies can be adopted at scale.
Competitive Landscape
The United States industrial wood coatings market is moderately consolidated. Regional specialists—Stiles Industrial Coatings, ICP Industrial Solutions Group, Diamond Vogel—are seizing niche volume in UV-curable and low-temperature powder lines, extracting 15-25 % price premiums in guitar, sports-goods, and bespoke cabinetry niches. Technology moats are widening: suppliers deploying digital color-matching and AI-formulation tools can quote custom shades inside 24 hours, a decisive edge over slower rivals. Backward integration into resin and pigment supply is also expanding; long-term TiO₂ deals shield majors from spot spikes, preserving 8-12 % margin advantages and reinforcing their leadership in the industrial wood coatings market.
White-space innovation sits in low-bake powders for MDF and in bio-based polyols that cut Scope 3 emissions 30-40 %. Players that crack 120-140 °C cure windows could unlock a USD 150-200 million opportunity in flat-pack furniture. Meanwhile, distributor consolidation continues: Teknos added 12 new Midwestern outlets in 2024, improving service density and pressuring independents to seek acquisition or strategic alliance.
United States Industrial Wood Coatings Industry Leaders
-
The Sherwin William Company
-
PPG Industries Inc.
-
Akzo Nobel N.V.
-
Axalta Coating Systems
-
RPM International Inc.
- *Disclaimer: Major Players sorted in no particular order
Market Opportunities and Future Outlook
A key opportunity is in conversion programs where wood finishers replace solvent-borne systems to meet lower-VOC and HAP compliance requirements while maintaining throughput. In the United States, the regulatory anchor is clear, with EPA oversight of wood building product surface coating emissions under 40 CFR Part 63, Subpart QQQQ, alongside stringent state and regional VOC requirements such as California limits and SCAQMD Rule 1136. These constraints support water-borne, high-solids, and UV/LED-UV solutions that reduce solvent handling, simplify permitting in stricter air districts, and align with fast-turn production in cabinetry and made-to-order furniture.
Another whitespace area involves productivity-led finishing upgrades that pair coatings with automation and faster curing, particularly for plants targeting 24-48 hour ship windows and for refinishers working to short recoat schedules. Recent product activity supports this shift, including Benjamin Moore introducing a water-borne cabinet enamel positioned around a four-hour recoat window (December 2024), and broader supplier emphasis on innovation capacity, illustrated by Sherwin-Williams opening the Morikis Global Technology Center in Ohio (July 2026). Low-bake powder and UV-curable systems for engineered wood and MDF also provide a pathway to reduce VOC exposure and improve line economics where thermal limits can be met, creating room for suppliers to deliver performance parity on early-block resistance, stain resistance, and edge coverage across joinery and furniture applications.
Recent Industry Developments
- July 2026: The Sherwin-Williams Company opened Morikis Global Technology Center in Brecksville, Ohio to advance coatings R&D, product development, and process engineering. The launch strengthens US industrial coatings R&D capacity and accelerates innovation in wood coatings formulations.
- July 2026: The Sherwin-Williams Company - Officially opened the 55,742-square-metre Morikis Global Technology Center in Brecksville, Ohio, to advance coatings research, product development, and process engineering. The capacity addition strengthens the company\'s innovation ecosystem and supports faster development of wood coatings formulations.
- August 2024: PPG Industries, Inc. announced a $300 million investment in North American advanced manufacturing, including a Tennessee facility to support automotive and industrial coating production. The investment expands NA coating capacity and regional supply chain, improving service to industrial wood coatings end-users.
Research Methodology Framework and Report Scope
Market Definition and Coverage
For this study, the market covers industrial wood coatings sold and used in the United States to protect and finish wood and engineered wood parts made in factory settings, and it is tracked in volume terms based on coatings consumed by industrial users.
Scope exclusions: We exclude decorative DIY wood paints and stains sold mainly through retail for household application, and we also exclude coatings used primarily for non-wood substrates.
Segmentation Overview
- By Resin Type
- Epoxy
- Acrylic
- Alkyd
- Polyurethane
- Polyester
- Others (Nitrocellulose, etc.)
- By Technology
- Water-Borne
- Solvent-Borne
- UV-Curable
- Powder
- By End-User Industry
- Wooden Furniture
- Joinery (Windows, Doors, Molding)
- Flooring and Decking
- Others (Musical instruments, Sports goods)
Data Sources, Market Sizing, and Validation
Desk Research
Desk research started with building a grounded view of US wood manufacturing activity and coating demand signals that can be checked over time. Public sources such as the US Census Bureau (manufacturing and construction series), Bureau of Labor Statistics (producer prices and employment), US International Trade Commission trade data (selected resin and chemical flows), EPA and state air-quality programs (VOC rules and compliance direction), and industry bodies such as AWI and KCMA helped us set the demand context and the likely shift toward lower-VOC technologies.
We then reviewed manufacturer announcements, technical data sheets, investor materials, and credible press coverage to understand how product mixes are changing and where capacity or lead times can influence volumes. In parallel, we used paid subscriptions for company financials and intelligence, patent databases for formulation and cure technology signals, and a shipment-level import export database to sanity-check select upstream movements. The desk research sources listed here are illustrative, and we used other public and paid references as well to collect data, validate assumptions, and clarify open questions.
Primary Interviews and Surveys
Primary work focused on confirming how much coating is used per unit of output in key wood product lines, and how technology choices are moving because of regulations and line productivity needs. We spoke with a mix of formulators, distributors, contract finishers, and industrial wood product manufacturers, with coverage that reflects where production and finishing capacity is concentrated across the country. These discussions were used to fill gaps left by public data, check volume trends, and align final assumptions with real purchasing behavior.
Distribution of primary research fieldwork respondents
| Company type | Respondent position |
|---|---|
| Top tier: 36% | CXOs: 16% |
| Mid tier: 46% | Functional/Unit leaders: 25% |
| Smaller Players: 18% | Managers: 59% |
Market-Sizing & Forecasting
Sizing was built using top-down and bottom-up logic, where a demand pool was reconstructed from US production indicators for finished wood goods and then translated into coating volume using application intensity ranges. To keep the model practical, we leaned on variables that can be tracked each year, such as cabinets and furniture output trends, housing starts and remodeling activity as a pull-through signal, typical wet-to-dry transfer and solids assumptions by technology, the mix shift between water-borne, solvent-borne, and radiation-cured systems, and regulatory pressure points that change product selection.
Those totals were then corroborated with selective bottom-up approximations, including sampled supplier and channel checks, and volume consistency checks by end-use manufacturing clusters, before the final number was adjusted. Where direct volume signals were thin, gaps were handled by using conservative ranges from interviews and then stress-testing them against observed changes in production activity.
For forecasting, we used scenario analysis supported by a simple multivariate structure, where volumes move with manufacturing output and construction demand, and the technology mix is adjusted based on expected compliance timelines and line conversion plans. The final forecast path was reviewed with practitioners so that input trajectories, such as conversion pace and utilization shifts, stayed realistic for the United States context.
Data Validation & Update Cycle
Validation was done through multiple checks that look for mismatches between model outputs and independent signals, before conclusions were signed off. We compared implied coating intensity against known finishing practices, reviewed year-to-year step changes versus macro indicators, and rechecked any large swings by going back to interview notes and source data.
If the model produced unusual movements, follow-up outreach was triggered to confirm whether the change was real, timing-driven, or caused by mix shifts. Reports are refreshed annually, and interim updates are completed when material events occur, such as major regulatory changes or sudden shifts in production activity. Before delivery, an analyst performs a fresh pass so clients receive the latest updated view.
Mordor Intelligence's United States Industrial Wood Coatings Market Estimate Compared With Other Published Estimates
Published market sizes for this space can vary because the boundary is not always set the same way, and some sources also switch between value and volume without clearly explaining the bridge between them. Differences in base year choice, whether industrial-only demand is isolated, and how technology mix is treated are also common reasons totals do not line up.
By tracking line-level technology shifts and refreshing mix assumptions with callbacks, Mordor Intelligence keeps the United States industrial wood coatings total tied to industrial consumption volumes rather than blending in retail wood finishes or value-only price narratives.
Benchmark comparison
| Source | Market Size | Gaps in Research Methodology |
|---|---|---|
| Mordor Intelligence | USD 0.00 B (2025) | |
| Industry Report A | USD 0.95 B (2025) | Value-based sizing that can include a broader wood coatings basket, and results can move depending on assumed average selling prices and whether contractor or retail channels are blended with industrial demand. |
| Trade Journal B | USD 0.00 B (2024) | Often discussed at a regional level with mixed currency timing and pricing assumptions, which can overstate short-term growth when resin and solvent input costs spike, even if underlying volumes are stable. |
Across the three numbers, the spread mainly comes from whether the estimate is anchored in industrial consumption volume or in revenue that is sensitive to price cycles and channel coverage. When the scope is kept strictly to US industrial wood finishing demand and the mix is updated with practical checks, the market size becomes easier to trace back to repeatable inputs.
Key Questions Answered in the Report
How large is the United States industrial wood coatings market today?
It is estimated at 284.29 kilotons in 2026 and is on course to hit 331.98 kilotons by 2031.
What is the forecast CAGR for U.S. industrial wood coatings between 2026-2031?
The market is projected to grow at a 3.15 % CAGR over the forecast period.
Which resin segment dominates U.S. demand?
Polyurethane coatings led with a 60.15 % share in 2025 due to their abrasion and UV resistance.
Why are water-borne coatings gaining traction?
California’s 275 g/L VOC limit and the EPA’s 45 % weight cap are accelerating adoption while also cutting fire-insurance costs for manufacturers.
Which end-user segment is expanding the fastest?
Wooden furniture applications are advancing at a 3.61 % CAGR as made-to-order cabinetry and home-office upgrades proliferate.
Who are the leading suppliers?
PPG, Sherwin-Williams, and Akzo Nobel collectively control roughly 45-50 % of national volume, with regional firms such as Diamond Vogel excelling in niche UV and powder lines.