
United States Industrial Asset Inspection Services Market Size and Share
Market Overview
| Study Period | 2021 - 2032 |
|---|---|
| Forecast Data Period | 2027 - 2032 |
| Base Year Market Size (2026) | USD 7.71 Billion |
| Market Size (2027) | USD 8.25 Billion |
| Market Size (2032) | USD 11.90 Billion |
| Growth Rate (2027 - 2032) | 7.60 % |
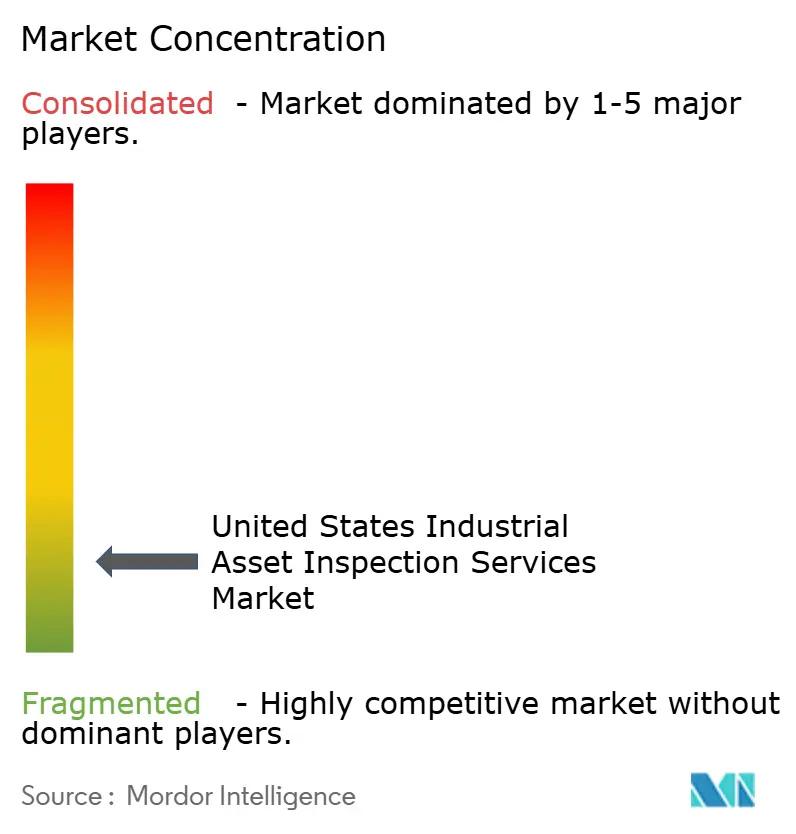
| Market Concentration | Low |
Major Players *Disclaimer: Major Players sorted in no particular order Image © Mordor Intelligence. Reuse requires attribution under CC BY 4.0. | |
United States Industrial Asset Inspection Services Market Analysis by Mordor Intelligence
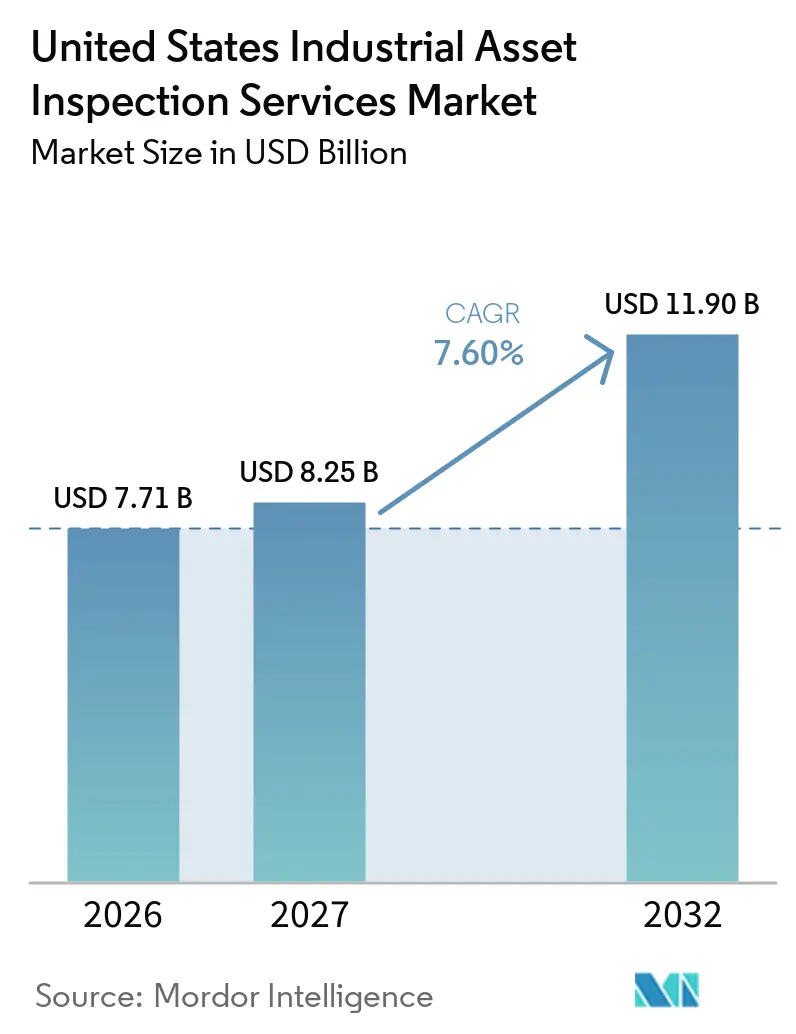
The United States Industrial Asset Inspection Services Market size is projected to be USD 7.71 billion in 2026, USD 8.25 billion in 2027, and reach USD 11.90 billion by 2032, growing at a CAGR of 7.60% from 2027 to 2032.
Growth in the United States industrial asset inspection services market rests on aging industrial assets, mandatory inspection requirements, grid investment, and new domestic manufacturing facilities. The market also benefits as operators adopt remote inspection technologies and digital data platforms to assess equipment condition without requiring planned shutdowns. Grid expansion and semiconductor construction increase the workload for firms with the right technical certifications and specialized inspection capabilities. Infrastructure modernization is creating additional opportunities across power generation, transmission networks, pipelines, chemical processing facilities, and industrial plants, where asset owners require periodic condition assessments to maintain operational reliability and reduce unplanned downtime. Inspection providers are also expanding their capabilities in non-destructive testing, risk-based inspection, predictive maintenance, and automated data collection, helping asset owners identify defects, prioritize maintenance activities, and improve equipment life-cycle management. Digital inspection records and analytics are becoming increasingly important for customers managing geographically dispersed facilities and complex regulatory obligations.
Key Report Takeaways
- By asset type, pipelines and piping systems held 22% of the United States industrial asset inspection services market share in 2026, while electrical and power equipment is forecast to grow at an 8.5% CAGR through 2032.
- By end-use industry, oil and gas, refining, and petrochemicals held 26% of the United States industrial asset inspection services market size in 2026, while power generation, renewable energy, and electrical utilities are forecast to grow at a 9% CAGR through 2032.
- The United States industrial asset inspection services market is benefiting from stricter safety and environmental compliance requirements, aging industrial infrastructure, and rising investment in asset integrity management.
- The market is witnessing increased adoption of digital inspection platforms, remote inspection technologies, and predictive maintenance solutions as operators seek to reduce unplanned downtime, improve inspection efficiency, and extend asset service life.
Note: Market numbers in this report are based on Mordor Intelligence's proprietary estimation framework, which combines nine months of actuals with Q4 projections for base year 2026.
United States Industrial Asset Inspection Services Market Trends and Insights
Drivers Impact Analysis*
| Driver | (~) % Impact on CAGR Forecast | Geographic Relevance | Impact Timeline |
|---|---|---|---|
| Aging Industrial, Energy, and Infrastructure Assets | +2.0% | National, concentrated in Gulf Coast, Midwest, and Mid-Atlantic industrial corridors. | Long-term (≥ 4 years) |
| Mandatory Mechanical Integrity and Industry Code Compliance | +1.6% | National, with the greatest density in the petrochemical-rich Gulf Coast and power-heavy Southeast | Medium term (2-4 years) |
| Federal Infrastructure, Energy-Transition, and Grid-Modernization Investment | +1.3% | National, with early capital activity in Texas, California, and the Mountain West | Medium term (2-4 years) |
| Reshoring, Semiconductor, and Advanced-Manufacturing Capacity Expansion | +0.9% | Arizona, Ohio, New York, Texas, and other CHIPS Act recipient states | Short term (≤ 2 years) |
| Robotics, Remote Visual Inspection, and AI-Assisted NDT Adoption | +0.7% | National, with early adoption in the Permian Basin, Rocky Mountains, and offshore Gulf of Mexico | Medium term (2-4 years) |
| Inspection-Data Interoperability as a Condition for Predictive Maintenance | +0.5% | National, with early gains in large integrated refinery-petrochemical complexes | Long term (≥ 4 years) |
| Source: Mordor Intelligence | |||
Aging Industrial, Energy, and Infrastructure Assets
A large base of aging industrial and civil assets supports the United States industrial asset inspection services market. The American Society of Civil Engineers (ASCE) identified a USD 3.7 trillion infrastructure investment gap in 2025, including energy, water, and industrial-adjacent systems. This gap was USD 1.1 trillion higher than the figure cited four years earlier, highlighting the continuing need for infrastructure rehabilitation, modernization, and maintenance. Assets operating beyond their original design life can face stress-corrosion cracking, hydrogen attack, flow-accelerated corrosion, and fatigue-related deterioration. These conditions can shorten inspection intervals as risk profiles deteriorate and increase the need for non-destructive testing, thickness measurements, structural assessments, and remaining-life evaluations. Gulf Coast refining units and Midwest steam systems are important examples because their operating histories, exposure to demanding process conditions, and changing duty cycles can increase inspection requirements. Operators are increasingly prioritizing risk-based inspection programs to identify high-consequence defects, allocate maintenance budgets more effectively, and reduce the likelihood of unexpected equipment failures.
Mandatory Mechanical Integrity and Industry Code Compliance
The United States industrial asset inspection services market has a recurring revenue base because many inspections are required by law or code. OSHA requires covered facilities to establish written inspection procedures, document inspections, and correct deficiencies before equipment returns to service. OSHA’s 2024 enforcement directive identified mechanical integrity inspection and testing as the most frequently cited PSM element at covered petroleum and chemical facilities. PHMSA’s July 2025 rule allowed UAS and satellite methods for pipeline right-of-way patrols, resolving a barrier to drone use without reducing inspection obligations. API 510 and API 653 also support recurring programs for pressure vessels and tanks. These requirements help providers maintain contracted work through periods of lower operator capital spending.
Federal Infrastructure, Energy-Transition, and Grid-Modernization Investment
The United States industrial asset inspection services market gains momentum as new energy and water infrastructure enters commissioning and service. Investor-owned electric companies plan nearly USD 208 billion in investment in 2025, with 91 GW under construction and 488 GW planned or proposed over the following five years. New generation needs inspection of electrical equipment, foundations, and mechanical systems before energization. The Grid Deployment Office administers USD 10.5 billion through the GRIP program for grid resilience and renewable integration. EPA received USD 12 billion in FY 2025 appropriations across drinking water, wastewater, and Superfund programs. These programs extend demand beyond oil, gas, and power facilities.
Reshoring, Semiconductor, and Advanced-Manufacturing Capacity Expansion
The United States industrial asset inspection services market is also expanding with domestic semiconductor and advanced-manufacturing construction. The CHIPS and Science Act directs USD 50 billion toward semiconductor manufacturing, and CHIPS for America proposed more than USD 32 billion in facility funding across 16 states. TSMC began construction on a third Arizona fabrication facility in April 2025, while Micron announced USD 200 billion in United States semiconductor investment. These campuses require construction inspection, verification of ultra-high-purity piping, and continued electrical and instrumentation inspection. Intel’s Ohio One site had USD 28 billion in planned investment and more than 6.4 million construction labor hours through early 2025. Automotive, defense, and specialty chemical reshoring adds demand outside CHIPS-funded projects.
Restraints Impact Analysis*
| Restraint | (~) % Impact on CAGR Forecast | Geographic Relevance | Impact Timeline |
|---|---|---|---|
| Shortage and Retirement of Qualified Level II and Level III Inspectors | -1.8% | National, most acute in rural and inland markets distant from training centers | Long term (≥ 4 years) |
| High Capital and Qualification Cost of Advanced Inspection Systems | -1.0% | National, with a disproportionate effect on mid-tier and independent service firms | Medium term (2-4 years) |
| Inconsistent Acceptance Criteria for AI-Generated Inspection Findings | -0.6% | National, concentrated in petrochemicals, nuclear, and pressure equipment | Medium term (2-4 years) |
| Fragmented Asset Records and Poor Data Lineage Across Brownfield Sites | -0.4% | National, most severe in the Gulf Coast refinery corridor and aging Midwest manufacturing complexes | Long term (≥ 4 years) |
| Source: Mordor Intelligence | |||
Shortage and Retirement of Qualified Level II and Level III Inspectors
The United States industrial asset inspection services market faces a structural constraint in the availability of certified labor. The United States non-destructive testing (NDT) workforce numbers approximately 89,800 professionals, and 30% are over 55 years old, creating concerns about knowledge transfer and replacement hiring as experienced technicians approach retirement. Level II technicians represent 55% of the active workforce, yet demand for personnel qualified to perform inspections, interpret results, and document findings can exceed available capacity in specialized applications. Achieving Level III certification requires substantial field experience, technical examinations, and ongoing professional qualification, limiting the speed at which providers can develop senior-level expertise. New entrants are not keeping pace with retirements and rising demand from energy infrastructure, refining, power generation, and industrial maintenance projects. Consequently, turnaround periods can face scheduling constraints, reduced inspection scope, higher labor costs, and increased competition for experienced contractors.
High Capital and Qualification Cost of Advanced Inspection Systems
Advanced inspection methods impose significant equipment, training, and qualification costs on the United States industrial asset inspection services market. Phased array ultrasonic testing (PAUT), total focusing method (TFM), computed tomography, and robotic crawlers require capital investment, specialized personnel, and ongoing procedure qualification to ensure reliable results across different asset types and operating conditions. Qualification under applicable ASME Boiler and Pressure Vessel Code Section V requirements can involve reference-standard testing, technical review, and extensive documentation, with complex procedures potentially taking more than a year to validate and implement. These requirements create a higher entry barrier for smaller inspection providers, which may lack the financial resources to acquire advanced equipment, maintain certified specialists, and support customer-specific qualification programs. Large testing, inspection, and certification (TIC) firms are generally better positioned to spread these costs across multiple projects and industrial clients. In addition, regulated asset owners need consistent acceptance criteria for AI-assisted inspection findings, traceable inspection records, and reliable historical data integration at brownfield sites where legacy systems and incomplete documentation can complicate assessments.
*Our forecasts treat driver/restraint impacts as directional, not additive. The impact forecasts reflect baseline growth, mix effects, and variable interactions.
Segment Analysis
By Asset Type: Pipelines Anchor Revenue and Power Equipment Leads Growth
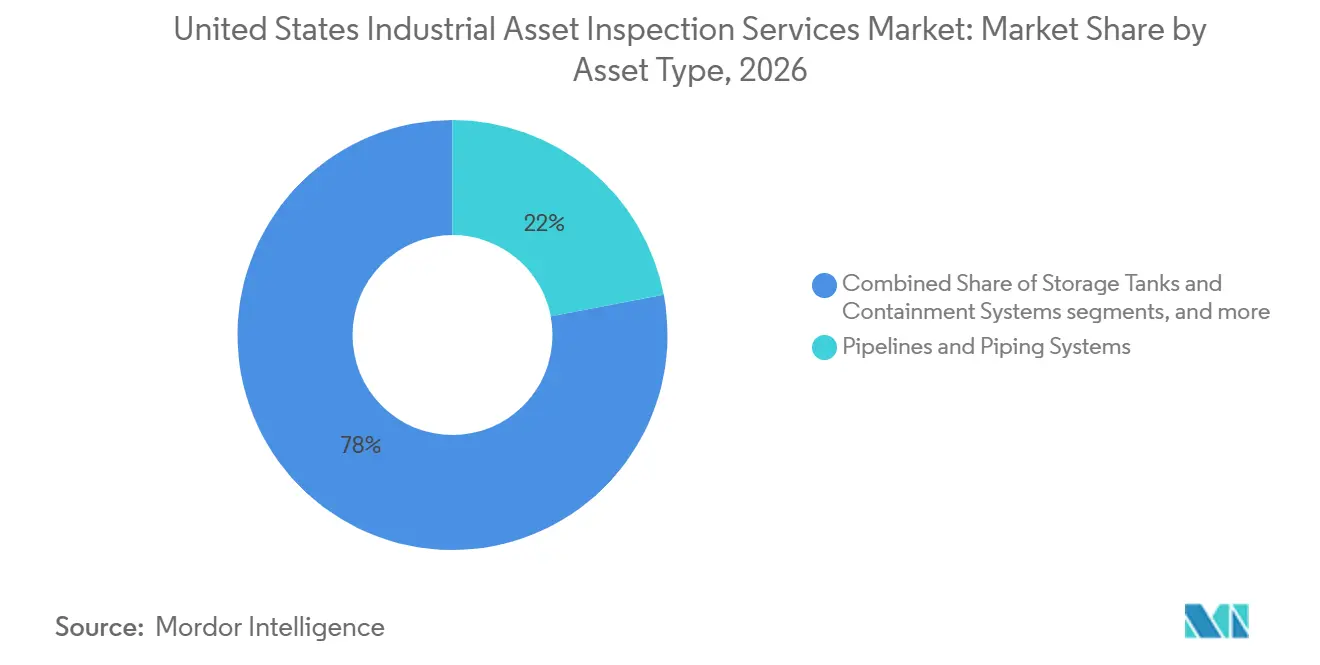
Pipelines and piping systems held 22% of the United States industrial asset inspection services market share in 2026. This segment is supported by the density of transmission and process piping that falls under PHMSA and API integrity programs. Oil, gas, and industrial transmission pipelines generate work through inline inspection, external corrosion direct assessment, and cathodic protection surveys. PHMSA reassessment requirements under 49 CFR Parts 192 and 195 provide a recurring inspection base. The 2025 remote-sensing rule broadens the available patrol methods while retaining the underlying inspection requirement. Pressure vessels, boilers, heat exchangers, tanks, and containment systems add large volumes of plant work. Industrial structures include steelwork, offshore platforms, and towers, while offshore wind foundations extend this asset class.
Electrical and power equipment has the fastest projected growth at an 8.5% CAGR from 2027 to 2032. The United States industrial asset inspection services market size for this asset type grows with grid spending and new generating capacity. Transformers, switchgear, and distribution equipment require thermography, power-factor testing, and dissolved-gas analysis. Generators and electrical installations require combined visual, mechanical, and electrical testing. Transmission assets increasingly use drone surveys and LiDAR measurements under reliability standards. Rotating machinery creates demand through vibration monitoring and condition assessment. This supports recurring data services alongside periodic field inspections.

By End-Use Industry: Hydrocarbons Provide the Base and Utilities Drive Growth
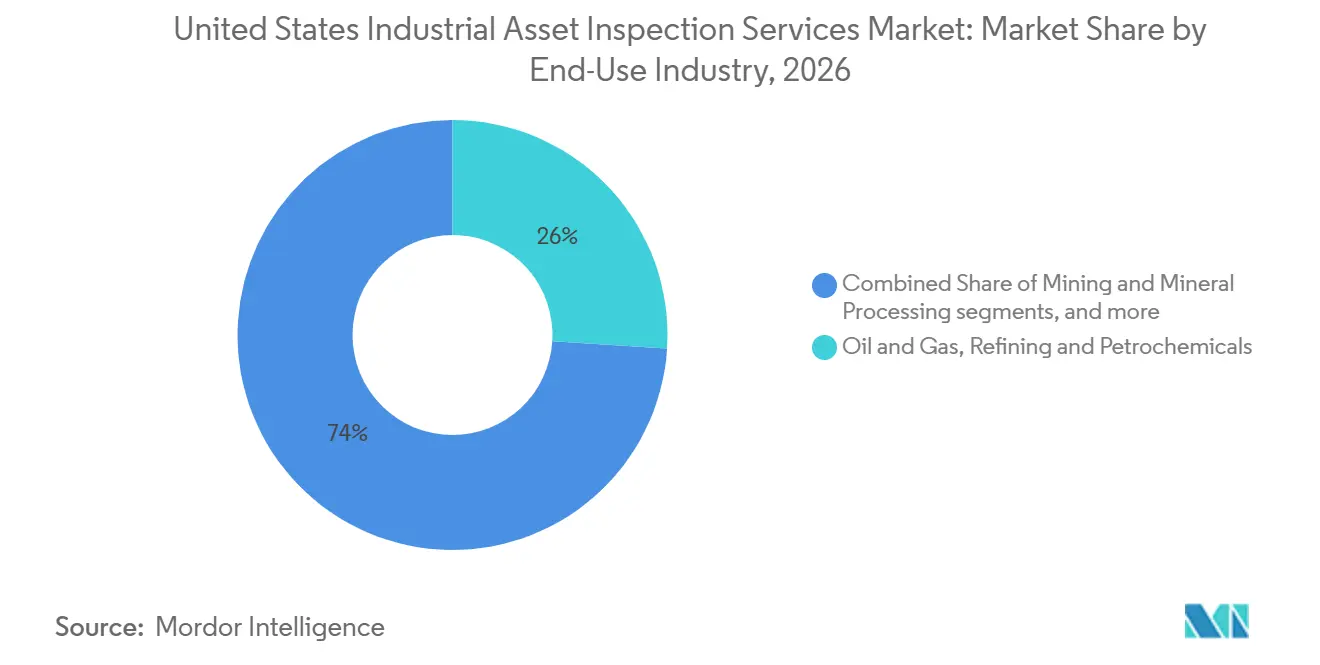
Oil and gas, refining, and petrochemicals accounted for 26% of the United States industrial asset inspection services market share in 2026. Refineries contain thousands of pressure vessels, long process-piping systems, and large tank inventories. OSHA PSM, PHMSA, EPA RMP, and API codes create layered inspection obligations for these sites. Required risk-based inspection and mechanical-integrity work continues regardless of throughput or margins. Chemical manufacturing, metals, industrial manufacturing, and mining also require inspection of pressure equipment, structures, and rotating machinery. Food and beverage processing requires hygienic piping and vessel inspection, while pharmaceutical facilities require validated records. Transportation, logistics, and ports add work for cranes, conveyors, and related infrastructure.
Power generation, renewable energy, and electrical utilities are projected to grow at a 9% CAGR from 2027 to 2032. This part of the United States industrial asset inspection services market benefits from 91 GW under construction and a further 488 GW in development. Wind-blade inspection and solar thermographic surveys create newer service categories. Conventional plants also need intensive work to maintain boiler and steam-system compliance. Water and wastewater utilities add inspection demand through lead service line replacement and remediation work. Data center construction is becoming another end-use opportunity, supported by MISTRAS Group’s September 2025 partnership with Batchelor & Kimball.
Geography Analysis
The Gulf Coast across Louisiana, Texas, and Mississippi has the largest concentration of refinery, LNG, and petrochemical inspection work. MISTRAS Group received an NDT contract for Woodside’s USD 17.5 billion Louisiana LNG terminal in December 2025. These sites carry OSHA, PHMSA, and EPA requirements at the same time. Their inspection load supports premium prices and multiyear contracts. The Midwest contributes through steel, automotive manufacturing, and legacy power assets that require fitness-for-service review.
The Northeast includes chemical, pharmaceutical, and nuclear assets that require detailed documentation and validation work. The Southwest and Pacific Coast are growing as semiconductor, renewable-energy, and grid projects move forward. TSMC’s Arizona expansion and Micron’s announced investment support construction and commissioning inspections before facilities move into service. California’s grid hardening and renewable projects create work for solar, wind, and battery-storage inspections. The Mountain West also supports pipeline inspection under PHMSA priorities and new transmission work through GRIP funding.
The United States industrial asset inspection services market has uneven regional service capacity. Rural and inland areas, including Appalachia, the Plains, and remote Gulf Coast locations, have fewer Level II and Level III professionals. This raises mobilization costs and encourages remote visual inspection and data-management platform use. EPA funding and grid programs have directed capital toward locations where inspector availability is limited. The result is a difference between well-served industrial centers and dispersed locations with limited coverage. The latter can offer higher-margin work for providers that can mobilize qualified teams. This regional difference will remain important as new assets enter service.
Competitive Landscape
The United States industrial asset inspection services market exhibits a low level of market concentration. This structure creates competition for routine programs but leaves room for specialists in high-risk work. Acuren completed its USD 1.7 billion merger with NV5 Global in August 2025, creating TIC Solutions with more than USD 2 billion in revenue and 230 locations. SGS agreed to acquire Applied Technical Services for USD 1.325 billion in July 2025.
Technology is a key competitive difference in the United States industrial asset inspection services market. MISTRAS partnered with Villari in October 2025 to offer wireless crack-detection sensors for steel assets. This move extends monitoring between planned outage inspections. Larger firms can also finance advanced equipment, qualification work, and field-data platforms. Smaller providers may remain focused on conventional methods or regional client relationships. The United States industrial asset inspection services market rewards digital capability when it is paired with credible field execution.
The United States industrial asset inspection services market also has opportunities in rural coverage, explainable AI services, and inspection subscriptions for new energy assets. Automation can reduce field exposure and improve data collection, but it does not remove the need for certified personnel. Providers must also keep records that work across operators, sites, and equipment histories. Stronger data lineage can improve predictive maintenance decisions at integrated facilities. Consolidation can broaden geographic reach and add specialist capability. It may also increase the bargaining position of large providers in advanced work. Providers capable of deploying qualified teams across dispersed industrial sites may address underserved regional demand, subject to mobilization costs and certification requirements.
United States Industrial Asset Inspection Services Industry Leaders
-
SGS SA
-
Bureau Veritas SA
-
Intertek Group plc
-
MISTRAS Group, Inc.
-
Acuren
- *Disclaimer: Major Players sorted in no particular order
Recent Industry Developments
- December 2025: MISTRAS Group was awarded an NDT services contract by Bechtel for Woodside's USD 17.5 billion Louisiana LNG terminal in Sulphur, Louisiana, covering RT, MT, PT, PMI, UT, and leak testing. The facility is expected to produce up to 27.6 million tons per annum of LNG when operational.
- October 2025: MISTRAS Group announced a partnership with Villari to offer Villari's passive magnetic flux leakage wireless crack-detection sensor, the only technology capable of continuously detecting fatigue crack growth in steel structures, enabling structural health monitoring between scheduled outage-based inspection intervals.
- August 2025: Acuren Corporation completed its USD 1.7 billion merger with NV5 Global, forming TIC Solutions with over USD 2 billion in revenue, 11,000+ employees, and 230+ locations in three segments: Inspection and Mitigation, Engineering and Lab, and Geospatial.
United States Industrial Asset Inspection Services Market Report Scope
The United States Industrial Asset Inspection Services Market Report is Segmented by Asset Type (Pipelines and Piping Systems, Pressure Vessels, Boilers and Heat Exchangers, and More), and by End-Use Industry (Oil and Gas, Refining and Petrochemicals, Mining and Mineral Processing, Water and Wastewater Utilities, Food and Beverage Processing, and More). The Market Forecasts are Provided in Terms of Value (USD).
| Pipelines and Piping Systems | Oil, Gas and Industrial Transmission Pipelines |
| Process Piping and Industrial Utility Piping | |
| Offshore Pipelines, Risers and Flowlines | |
| Pressure Vessels, Boilers and Heat Exchangers | Pressure Vessels and Process Reactors |
| Industrial Boilers and Steam Systems | |
| Heat Exchangers and Pressurized Thermal Equipment | |
| Storage Tanks and Containment Systems | Aboveground and Underground Industrial Storage Tanks |
| Industrial Containment and Bulk Storage Systems | |
| Rotating and Mechanical Equipment | Pumps, Compressors and Industrial Turbines |
| Conveyors, Drives and Fixed Production Machinery | |
| Other Installed Mechanical Equipment | |
| Electrical and Power Equipment | Transformers, Switchgear and Power Distribution Equipment |
| Generators and Electrical Installations | |
| Power Transmission and Electrical Utility Assets | |
| Industrial Structures and Fixed Installations | Industrial Structural Steel and Equipment Supports |
| Offshore Platforms and Fixed Energy Installations | |
| Industrial Towers, Stacks and Supporting Structures | |
| Other Fixed Industrial Assets | Process Furnaces and Refractory Systems |
| Industrial Instrumentation and Control Installations | |
| Other Specialized Installed Industrial Assets |
| Oil and Gas, Refining and Petrochemicals |
| Power Generation, Renewable Energy and Electrical Utilities |
| Chemical Manufacturing (Excluding Petrochemicals) |
| Metals and Other Industrial Manufacturing |
| Mining and Mineral Processing |
| Water and Wastewater Utilities |
| Food and Beverage Processing |
| Pharmaceuticals and Bioprocessing |
| Transportation, Logistics and Port Operations |
| Other Industrial End Users |
| By Asset Type | Pipelines and Piping Systems | Oil, Gas and Industrial Transmission Pipelines |
| Process Piping and Industrial Utility Piping | ||
| Offshore Pipelines, Risers and Flowlines | ||
| Pressure Vessels, Boilers and Heat Exchangers | Pressure Vessels and Process Reactors | |
| Industrial Boilers and Steam Systems | ||
| Heat Exchangers and Pressurized Thermal Equipment | ||
| Storage Tanks and Containment Systems | Aboveground and Underground Industrial Storage Tanks | |
| Industrial Containment and Bulk Storage Systems | ||
| Rotating and Mechanical Equipment | Pumps, Compressors and Industrial Turbines | |
| Conveyors, Drives and Fixed Production Machinery | ||
| Other Installed Mechanical Equipment | ||
| Electrical and Power Equipment | Transformers, Switchgear and Power Distribution Equipment | |
| Generators and Electrical Installations | ||
| Power Transmission and Electrical Utility Assets | ||
| Industrial Structures and Fixed Installations | Industrial Structural Steel and Equipment Supports | |
| Offshore Platforms and Fixed Energy Installations | ||
| Industrial Towers, Stacks and Supporting Structures | ||
| Other Fixed Industrial Assets | Process Furnaces and Refractory Systems | |
| Industrial Instrumentation and Control Installations | ||
| Other Specialized Installed Industrial Assets | ||
| By End-Use Industry | Oil and Gas, Refining and Petrochemicals | |
| Power Generation, Renewable Energy and Electrical Utilities | ||
| Chemical Manufacturing (Excluding Petrochemicals) | ||
| Metals and Other Industrial Manufacturing | ||
| Mining and Mineral Processing | ||
| Water and Wastewater Utilities | ||
| Food and Beverage Processing | ||
| Pharmaceuticals and Bioprocessing | ||
| Transportation, Logistics and Port Operations | ||
| Other Industrial End Users | ||
Key Questions Answered in the Report
What is the forecast growth rate for United States industrial asset inspection services?
The United States industrial asset inspection services market is forecast to grow at a 7.6% CAGR from 2027 to 2032, reaching USD 11.9 billion by 2032.
Which asset type accounts for the largest share of demand?
Pipelines and piping Systems led with a 22% share in 2026, supported by recurring federal and API integrity programs.
Which end-use sector is growing fastest?
Power generation, renewable energy, and electrical utilities are projected to record a 9% CAGR through 2032.
Why are inspection services important for refineries and petrochemical sites?
These sites have dense pressure equipment and piping systems subject to OSHA PSM, PHMSA, EPA, and API requirements.
What is limiting service capacity?
The main constraint is the retirement and shortage of qualified Level II and Level III inspectors.
How are digital tools changing asset inspections?
Remote visual methods, drones, analytics, and connected data platforms can improve coverage and support maintenance planning.