Market Overview
| Study Period | 2020 - 2031 |
|---|---|
| Forecast Data Period | 2026 - 2031 |
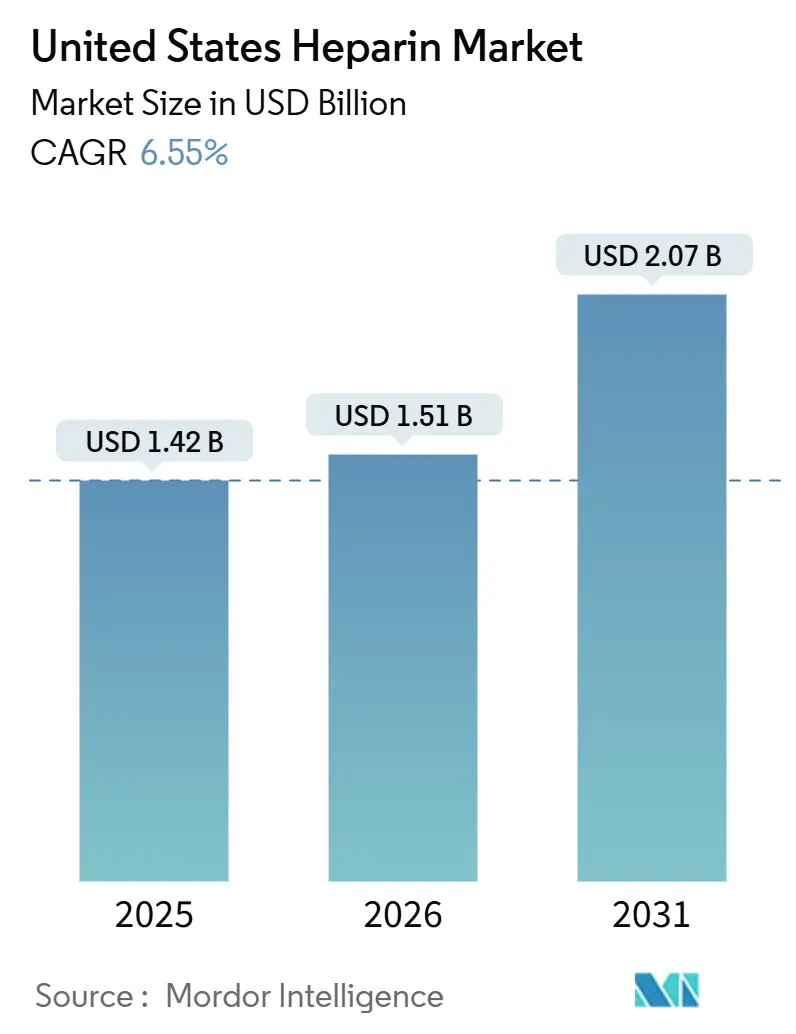
| Base Year Market Size (2025) | USD 1.42 Billion |
| Market Size (2026) | USD 1.51 Billion |
| Market Size (2031) | USD 2.07 Billion |
| Growth Rate (2026 - 2031) | 6.55% CAGR |
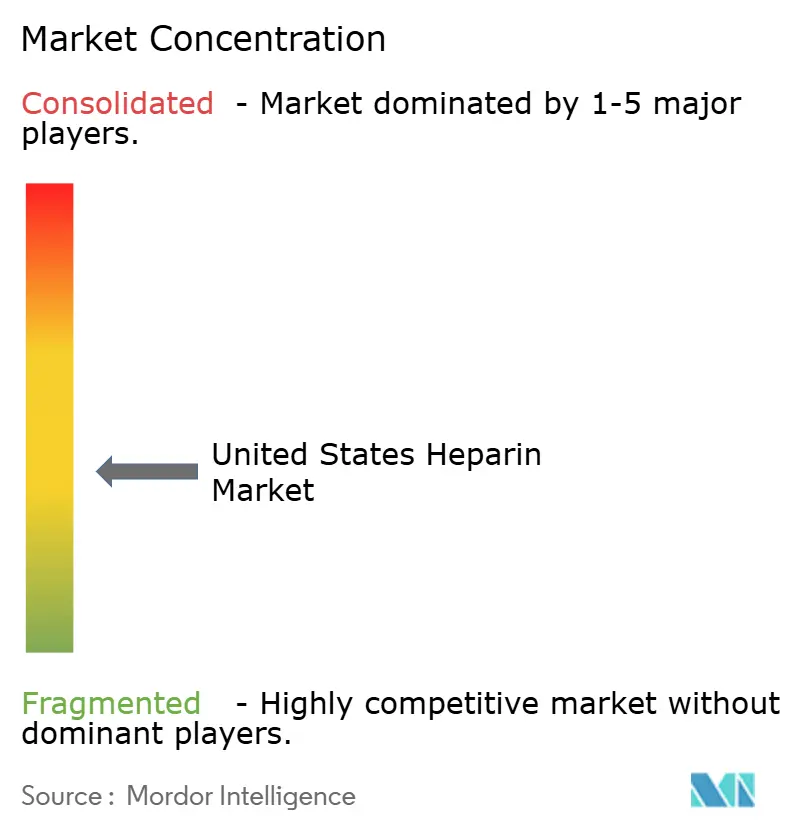
| Market Concentration | Medium |
Major Players *Disclaimer: Major Players sorted in no particular order Image © Mordor Intelligence. Reuse requires attribution under CC BY 4.0. | |
United States Heparin Market Analysis by Mordor Intelligence
The United States Heparin Market size is projected to be USD 1.42 billion in 2025, USD 1.51 billion in 2026, and reach USD 2.07 billion by 2031, growing at a CAGR of 6.55% from 2026 to 2031.
Demand remains anchored in cardiovascular and thrombotic care, where heparin is pivotal for surgical anticoagulation, dialysis, and the management of venous thromboembolism. Supply-chain vulnerabilities linked to porcine APIs are accelerating regulatory and technological diversification, including renewed interest in bovine sources and bioengineered products. Competitive pressure from direct oral anticoagulants (DOACs) is reshaping long-term therapy choices, yet hospitals continue to rely on heparin for procedures requiring rapid, reversible anticoagulation. Innovations such as Defencath and ultra-low-molecular-weight heparins illustrate the market’s drive toward safety, efficacy, and supply resilience.
Key Report Takeaways
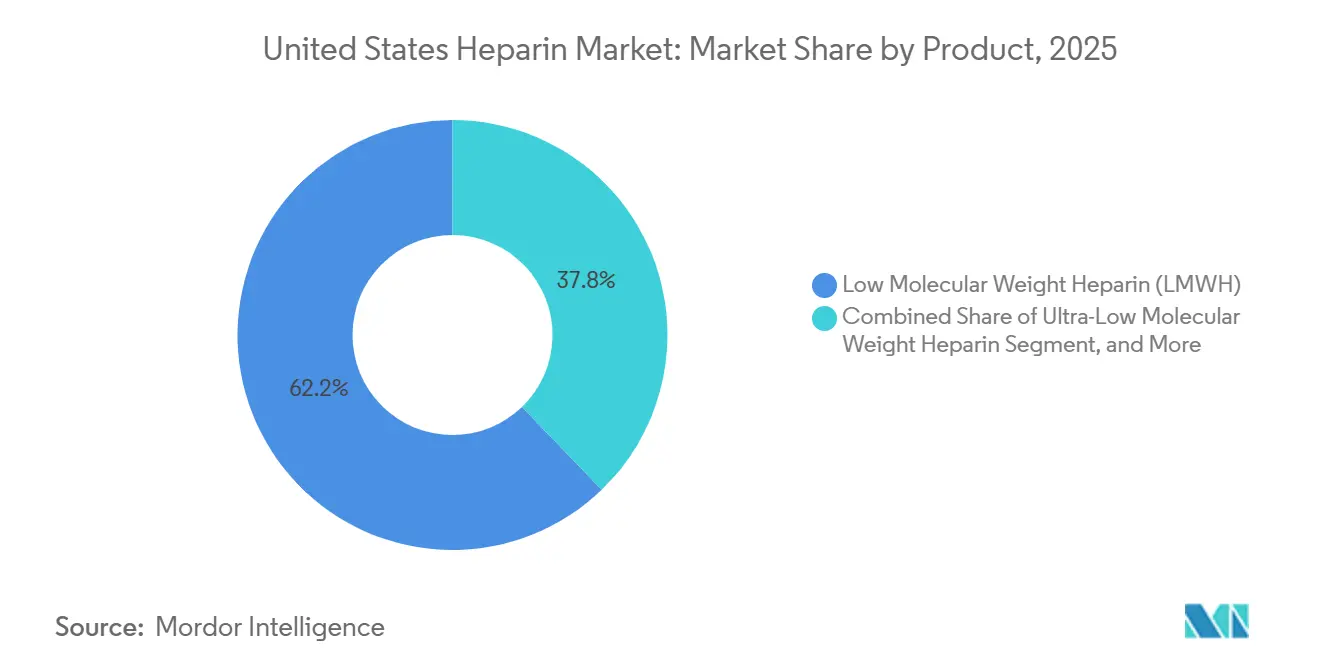
- By product, low-molecular-weight heparin led the United States heparin market with 62.22% share in 2025, and ultra-low-molecular-weight heparin is projected to grow at a 6.90% CAGR through 2031.
- By source, porcine intestinal mucosa accounted for 89.30% of the United States heparin market size in 2025, while bovine APIs are advancing at a 7.40% CAGR to 2031.
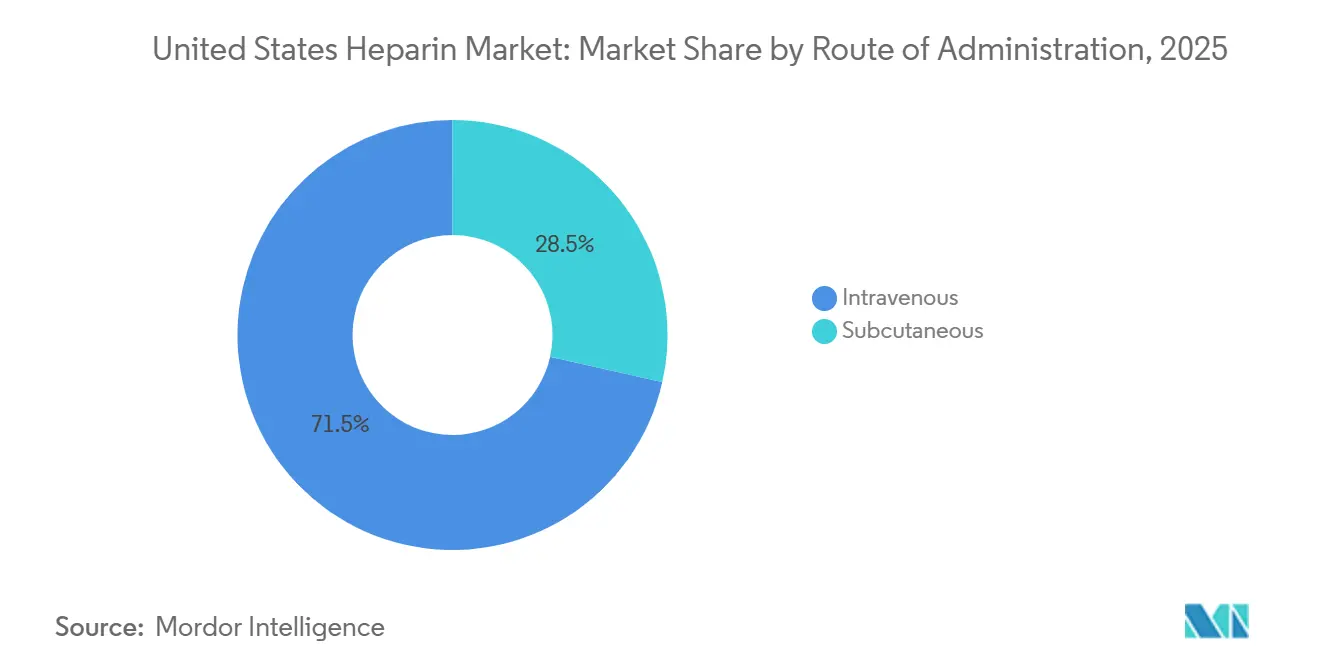
- By route of administration, intravenous formulations held a 71.50% share of the United States heparin market in 2025, whereas subcutaneous formulations are expanding at a 6.80% CAGR through 2031.
- By formulation, vials and ampoules commanded 68.20% revenue in 2025, yet prefilled syringes are pacing at a 7.20% CAGR to 2031.
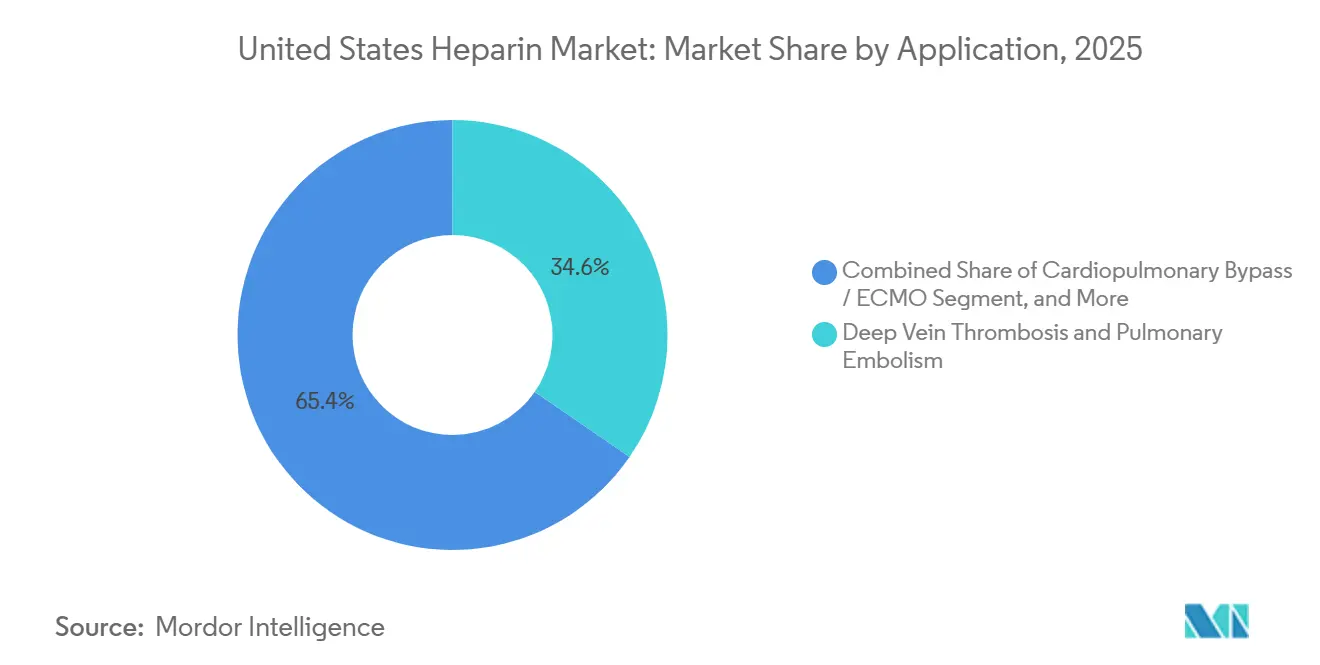
- By application, cardiopulmonary bypass and ECMO indications will record the fastest CAGR of 8.10% between 2026 and 2031.
- By end user, hospitals accounted for 79.40% of spending in 2025, but ambulatory surgical centers are growing at 7.30% annually through 2031.
Note: Market size and forecast figures in this report are generated using Mordor Intelligence’s proprietary estimation framework, updated with the latest available data and insights as of January 2026.
United States Heparin Market Trends and Insights
Drivers Impact Analysis*
| DRIVER | (~) % IMPACT ON CAGR FORECAST | GEOGRAPHIC RELEVANCE | IMPACT TIMELINE |
|---|---|---|---|
| High burden of cardiovascular & thrombotic diseases | +1.2% | United States | Long term (≥ 4 years) |
| High surgical & dialysis procedure volumes | +1.1% | United States | Medium term (2-4 years) |
| Advances in heparin formulations & delivery devices | +0.9% | United States | Medium term (2-4 years) |
| FDA-led diversification to bovine-sourced APIs | +0.8% | United States | Long term (≥ 4 years) |
| Bio-engineered, animal-free heparin trial roll-outs | +0.7% | United States | Long term (≥ 4 years) |
| Bed-side anti-Xa POC monitoring drives safe-use protocols | +0.6% | United States | Short term (≤ 2 years) |
| Source: Mordor Intelligence | |||
High Burden of Cardiovascular & Thrombotic Diseases
Each year, venous thromboembolism (VTE) impacts nearly 900,000 individuals across the U.S., leading to 60,000 to 100,000 fatalities and incurring close to USD 10 billion in direct medical expenses. Over a third of these cases occur in hospital settings, many of which could be prevented with timely pharmacologic prophylaxis. In 2024, the prevalence of atrial fibrillation (AF) reached 6.1 million adults in the U.S., with projections indicating a doubling by 2030, driven primarily by an aging population. Oncology patients are particularly at risk, facing a 4- to 7-fold increased likelihood of VTE, which accounts for approximately 20% of all thrombotic events. Additionally, nearly 30% of these patients experience recurrent clots within a decade, highlighting a sustained demand for rapid-acting, reversible treatment agents. Given these market dynamics, the U.S. heparin market remains a critical segment, particularly in scenarios where a rapid onset and the ability to be reversed with protamine are prioritized over the convenience of oral medications.
High Surgical & Dialysis Procedure Volumes
Rising procedure volumes are driving increased prophylactic heparin use. The Centers for Disease Control and Prevention reports 51.4 million inpatient and 28.6 million outpatient surgeries annually, all of which require perioperative anticoagulation. Dialysis demand also climbs, with 809,103 patients in 2024 and 69.8% receiving in-center hemodialysis. FDA-approved Defencath is eligible for TDAPA reimbursement from July 2024, improving adoption in dialysis settings.[1]Centers for Medicare & Medicaid Services, “ESRD PPS Transitional Drug Add-on Payment Adjustment,” cms.gov
Advances in Heparin Formulations & Delivery Devices
Hospitals are increasingly adopting standardized prefilled syringes to eliminate manual vial withdrawals. This shift reduces dosing errors and minimizes nurse exposure incidents. Features such as passive safety shields, color-coded plungers, and barcode scanning align with regulatory bodies' medication-safety objectives while also improving nursing efficiency by reducing time per dose. Ultra-low molecular weight variants with average weights below 3,000 daltons provide consistent anti-Xa activity, potentially eliminating the need for routine monitoring. Additionally, smart infusion pumps now incorporate heparin calculators and enforce strict dose limits, reducing supratherapeutic rates by up to 40% in early-adopting ICUs. These advancements in devices and formulations enhance patient safety and operational efficiency, driving greater adoption across the U.S. heparin market.
FDA-Led Diversification to Bovine-Sourced APIs
FDA deliberations in 2024 aim to diversify supply beyond porcine APIs.[2]U.S. Food and Drug Administration, “Appendix B – Product Name Sorted by Applicant,” fda.gov OECD analyses support source diversification to avert shortages. Regulatory clarity could accelerate market entry for bovine products within two years. Brazilian and Australian processors are scaling up lung-tissue extraction that can supply 10-15 trillion IU per year, roughly equal to one-third of U.S. demand. Bioequivalence studies under species-specific calibration rules add development time but are progressing, helped by improved prion-screening assays and the absence of BSE outbreaks in key cattle regions. Early adopters report pilot-scale dual-species formularies that hedge risk and may lower heparin-induced thrombocytopenia rates, pending definitive trials due in 2027. The initiative strengthens supply security across the United States heparin market.
Restraint Impact Analysis*
| RESTRAINT | (~) % IMPACT ON CAGR FORECAST | GEOGRAPHIC RELEVANCE | IMPACT TIMELINE |
|---|---|---|---|
| Porcine-supply swings from African swine fever | −1.3% | Facilities lacking diversified supply chains | Medium term (2-4 years) |
| Rising competition from alternative anticoagulants | −0.8% | Advanced health-care markets | Long term (≥ 4 years) |
| Strict regulations and recall risks tied to contaminants | −0.6% | Manufacturers and large hospital networks | Medium term (2-4 years) |
| CMS reimbursement compression on inpatient anticoagulant bundles | −0.5% | Hospitals with heavy Medicare caseloads | Short term (≤ 2 years) |
| Source: Mordor Intelligence | |||
Porcine-Supply Volatility from African Swine Fever
African Swine Fever continues to disrupt Chinese pig herds that supply about 80% of the crude heparin used in the United States.[3]Office of the Assistant Secretary for Planning and Evaluation, “Drug Shortages and Medical Supply Chain Resilience,” aspe.hhs.gov The August 2024 Baxter recall for endotoxin contamination shows how tight supply chains can strain quality controls. Previous raw-material shocks raised hospital heparin error rates by 152% and prompted conservation protocols. Most facilities keep contingency formularies and plan supplier changes once new sources reacthe implementation of h scale. FDA review of bovine heparin offers a near-term path to diversify supply, provided manufacturers meet the required safety standards.
Competition From Direct Oral Anticoagulants
Direct oral anticoagulants such as rivaroxaban and apixaban are gaining market share in long-term care for venous thromboembolism and atrial fibrillation because they require no routine monitoring. Argatroban remains the only FDA-approved drug for heparin-induced thrombocytopenia, while bivalirudin is preferred in some ECMO cases for steadier circuit management. A 2024 systematic review found that factor Xa inhibitors resulted in 4.56% recurrent thrombosis and 2.80% major bleeding in patients with HIT, supporting their wider use. January 2025 FDA Breakthrough status for Baebies’ rapid Anti-Factor Xa test may ease heparin monitoring, yet is unlikely to reverse the outpatient shift to oral options.
*Our forecasts treat driver/restraint impacts as directional, not additive. The impact forecasts reflect baseline growth, mix effects, and variable interactions.
Segment Analysis
By Product: LMWH Anchors Revenue, ULMWH Gains Traction
Low molecular weight heparin controlled 62.22% of the United States heparin market share in 2025, supported by once-daily prophylaxis that usually avoids lab monitoring. Enoxaparin remains the workhorse in orthopedic and abdominal surgery protocols, and its generic status keeps per-dose costs below USD 10 for group-purchasing contracts. Unfractionated heparin sustains a vital procedural niche where real-time dose adjustment is critical, such as cardiopulmonary bypass and ECMO, ensuring steady baseline demand. Ultra-low molecular weight heparin is forecast to post a 6.90% CAGR to 2031 as refined fractionation lowers bleeding risk without sacrificing anti-Xa potency. Investment in chromatographic technologies under the FDA 505(b)(2) pathway signals an incremental shift toward precision molecules within the United States heparin market.


By Source: Porcine Dominance Faces Bovine Challenge
Porcine intestinal mucosa supplied 89.30% of heparin APIs in 2025, yet bovine alternatives are expanding at a 7.40% CAGR on the back of Brazilian and Australian extraction capacity. FDA encouragement and improved prion testing reduce regulatory friction, though potency calibration changes and label updates extend timelines. Formulary committees at academic medical centers are piloting dual-species strategies to hedge against swine disease shocks, underscoring a growing resilience mindset in the United States heparin market.
By Route of Administration: IV Holds Acute Care, Subcutaneous Expands Outpatient
Intravenous administration generated 71.50% of revenue in 2025, reflecting dominance in ICUs, cath labs, and operating theaters where activated clotting time or anti-Xa monitoring guides minute-to-minute dosing. Subcutaneous injections are rising 6.80% annually as ambulatory surgical centers discharge patients with prefilled syringes and dialysis centers favor fixed boluses. Early-discharge VTE protocols reinforce this outpatient tilt, broadening the customer base for the United States heparin market.
By Formulation: Prefilled Syringes Capture Workflow Gains
Vials and ampoules accounted for 68.20% of revenue in 2025, driven by low unit costs and flexible compounding. Prefilled syringes and cartridges, however, are growing at a 7.20% CAGR as health systems chase zero-defect medication goals and nurse-time savings. Color-coded safety devices, barcode integration, and reduced sharps injuries support value-based purchasing, driving a packaging evolution within the United States heparin market.
By Application: DVT/PE Leads, ECMO Surges
Deep vein thrombosis and pulmonary embolism accounted for 34.60% of demand in 2025, underpinned by clinical guidelines that favor LMWH for hospitalized and cancer patients. Cardiopulmonary bypass and ECMO indications are on track for an 8.10% CAGR through 2031 as surgical volumes climb and centers retain pandemic-era ECMO capacity. Longer circuit run times and aging demographics boost high-dose UFH consumption, bolstering the procedural slice of the United States heparin market.
By End-User: Hospitals Dominate, ASCs Accelerate
Hospitals accounted for 79.40% of spending in 2025, leveraging bundled contracts that deliver double-digit discounts from leading suppliers. Ambulatory surgical centers are forecast to expand at a 7.30% CAGR as orthopedics and bariatrics migrate to outpatient settings that still mandate perioperative LMWH. Dialysis facilities form a mature but stable segment, while home-care infusion programs grow slowly due to nursing-staff constraints. These shifts underscore a gradual care-site redistribution inside the United States heparin market.
Geography Analysis
Regional demand for heparin tracks demographic age profiles and health-system capacity. The Northeast and Midwest, rich in academic medical centers and older populations, consume high volumes of advanced heparin formulations. California and other West Coast states are early adopters of ECMO and cardiopulmonary bypass, boosting growth for ultra-low-molecular-weight products. Hospitals in these regions implement robust stewardship programs after supply disruptions boosted medication errors by 152%.
Reimbursement policy shapes geographic adoption rates. National TDAPA coverage for Defencath, adequate from July 2024, encourages uniform uptake across dialysis networks. At the same time, the Inflation Reduction Act pricing provisions add uncertainty to regional procurement strategies. States accelerating outpatient care see stronger movement toward prefilled syringes and subcutaneous heparin, aligning with broader health-system cost controls.
Healthcare hubs in the Sun Belt witness growing procedure volumes, pushing institutional demand even as outpatient migration continues. Regional supply-chain diversification projects, including corporate investments in local crude heparin capacity, aim to buffer future shortages. Collectively, these regional dynamics shape a nuanced growth pattern across the United States heparin market.
Competitive Landscape
Market leadership rests with a cluster of multinational and specialized firms pursuing supply security and formulation innovation. ROVI invests to become self-sufficient in crude and sodium heparin by 2026, signaling an integrated approach. Amphastar’s Chinese subsidiary expands semi-purified heparin production, ensuring upstream control for the United States heparin industry. CorMedix commercialized Defencath in April 2024 and secured supply agreements covering 60% of outpatient dialysis centers, illustrating niche expansion through combination products.
Patent expiries encourage generic LMWH competition, yet branded products retain share through clinician familiarity and delivery-system advantages. Academic reviews highlight novel monitoring tools, anti-factor Xa assays, and viscoelastic testing supporting precise anticoagulation management. Companies working on direct thrombin and factor Xa inhibitors further intensify therapeutic competition, particularly where the risk of heparin-induced thrombocytopenia is high.
Supply-chain fragility remains a strategic battleground. FDA deliberations on bovine heparin and NIH grants for synthetic glycan research create new entry points that could redraw competitive lines. Vertical integration, collaborative R&D, and targeted acquisitions are expected to dominate strategic agendas as firms navigate pricing pressures and evolving clinical preferences across the United States heparin market.
United States Heparin Industry Leaders
Pfizer Inc.
Baxter International Inc.
Amphastar Pharmaceuticals, Inc.
Fresenius Kabi USA LLC
B Braun SE
- *Disclaimer: Major Players sorted in no particular order

Recent Industry Developments
- July 2025: B. Braun launched 25,000-unit heparin sodium premixed bags, creating the largest premix portfolio in the country.
- April 2025: Baebies secured FDA Breakthrough Device Designation for its Anti-Factor Xa test, delivering ≤15-minute heparin monitoring on the FINDER platform.
- January 2025: CorMedix Inc. partnered with WSI PBG to promote DefenCath within VA and other federal facilities, enhancing veteran access to the therapy


Research Methodology Framework and Report Scope
Market Definitions and Key Coverage
Our study defines the United States heparin market as the sale of unfractionated, low-molecular-weight, and ultra-low-molecular-weight heparin preparations that are approved for therapeutic or prophylactic anticoagulation across hospital, ambulatory, dialysis, and home-care settings. Products are valued at manufacturer ex-factory prices before purchaser-level rebates, thereby aligning with typical contract structures in the U.S. injectables space.
Scope exclusions: The sizing purposefully leaves out fondaparinux, synthetic pentasaccharides, direct oral anticoagulants, and compounding service revenues, as these fall outside heparin's molecular class.
Segmentation Overview
- By Product
- Unfractionated Heparin (UFH)
- Low Molecular Weight Heparin (LMWH)
- Ultra-Low Molecular Weight Heparin (ULMWH)
- By Source
- Porcine
- Bovine
- By Route of Administration
- Intravenous
- Subcutaneous
- By Formulation
- Vials & Ampoules
- Prefilled Syringes & Cartridges
- By Application
- Atrial Fibrillation & Acute Myocardial Infarction
- Stroke & Transient Ischemic Attack
- Deep Vein Thrombosis & Pulmonary Embolism
- Renal Dialysis & CRRT
- Cardiopulmonary Bypass / ECMO
- By End-User
- Hospitals
- Ambulatory Surgical Centers
- Dialysis Centers
- Home-care & Specialty Pharmacies
Detailed Research Methodology and Data Validation
Primary Research
Interviews with hospital pharmacy directors, dialysis nurses, group purchasing organization (GPO) buyers, and hematology specialists across the Northeast, Midwest, South, and West validated dose intensity, wastage rates, and expected biosimilar uptake. Follow-up email surveys captured outpatient prescription trends that remain underreported in secondary datasets.
Desk Research
Mordor analysts first mapped the treatment universe using open datasets such as CDC National Center for Health Statistics discharge tables, CMS procedure volumes, and FDA adverse-event listings, which frame real-world heparin usage patterns. Trade bodies, including the American Heart Association and the National Kidney Foundation, offered disease prevalence and dialysis counts, while U.S. International Trade Commission import codes helped back-calculate domestic supply. Annual reports and 10-Ks from leading injectable suppliers clarified average selling prices and channel splits.
Subscription resources: D&B Hoovers for company sales, Dow Jones Factiva for price-change reportage, and Questel for patent expiry timelines provided further context that fed baseline inputs.
The references above are illustrative; many other public and proprietary sources informed the evidence stack.
Market-Sizing & Forecasting
A top-down demand pool was established by reconciling inpatient heparin doses per DRG with national procedure counts, which were then cross-checked against port-of-entry shipment data. Select bottom-up checks, supplier revenue roll-ups and sampled ASP x volume estimates, tempered outliers before totals were locked. Key variables include coronary angioplasty volumes, chronic dialysis population, cardiopulmonary bypass caseloads, porcine raw material yields, and average vial strength migration toward pre-filled syringes. A multivariate regression with ARIMA overlays projects each driver, allowing scenario analysis around elective surgery rebounds and future FDA re-entry of bovine heparin. Data gaps in outpatient self-injection volumes were bridged by applying validated substitution ratios gathered from primary interviews.
Data Validation & Update Cycle
Outputs face a two-step analyst peer review, followed by variance checks against quarterly earnings snapshots. Any anomaly beyond three percentage points triggers model re-runs. The study refreshes every twelve months, with interim updates should raw material shocks, safety recalls, or major reimbursement changes arise.
Why Mordor's United States Heparin Baseline Earns Decision-Makers' Trust
Published estimates differ because firms vary pricing tiers, include or omit outpatient channels, and refresh models on different cadences. These choices widen the spread of publicly quoted numbers.
Primary gap drivers emerge when some publishers fold biosimilar LMWH or broader anticoagulant classes into headline figures, apply list prices without GPO discounts, or exclude home infusion usage that our team captures. Mordor's scoped definition, dual-path modeling, and annual refresh reduce such distortions, yielding a balanced baseline that policy planners and procurement leads can rely on.
Benchmark comparison
| Market Size | Anonymized source | Primary gap driver |
|---|---|---|
| USD 1.42 B (2025) | Mordor Intelligence | - |
| USD 1.32 B (2024) | Regional Consultancy A | Narrow hospital-only scope and wholesaler sell-in valuation |
| USD 4.85 B (2023) | Global Consultancy B | Bundles non-heparin injectables and applies list prices without rebate adjustments |
In sum, the disciplined scope choices, transparent variable selection, and continuous validation steps that underpin Mordor's numbers deliver a dependable benchmark amid a fragmented evidence landscape.


Key Questions Answered in the Report
How large United States heparin Market?
The United States heparin market is value at USD 1.51 billion in 2026 and projected to advance at a 6.55% CAGR between 2026 and 2031.
Which product captures the largest revenue today?
Low molecular weight heparin leads with 62.22% share in 2025 thanks to predictable once-daily dosing.
What is driving the shift toward bovine APIs?
FDA encouragement and African Swine Fever risks are prompting manufacturers to diversify beyond porcine sources.
Why are prefilled syringes gaining traction?
Prefilled devices reduce dosing errors, save nursing time, and align with Joint Commission medication-safety goals.
Where is heparin most heavily used?
Hospitals account for roughly 79% of spending, primarily in cardiac surgery, ICUs, and dialysis units.
Are oral anticoagulants a threat to injectable heparin?
DOACs dominate outpatient therapy, but heparin still holds procedural and critical-care niches that require rapid reversibility.
Page last updated on:


