Market Overview
| Study Period | 2017 - 2030 |
|---|---|
| Base Year For Estimation | 2024 |
| Forecast Data Period | 2025 - 2030 |
| Market Size (2025) | USD 448.65 Billion |
| Market Size (2030) | USD 534.86 Billion |
| Growth Rate (2025 - 2030) | 3.58% CAGR |
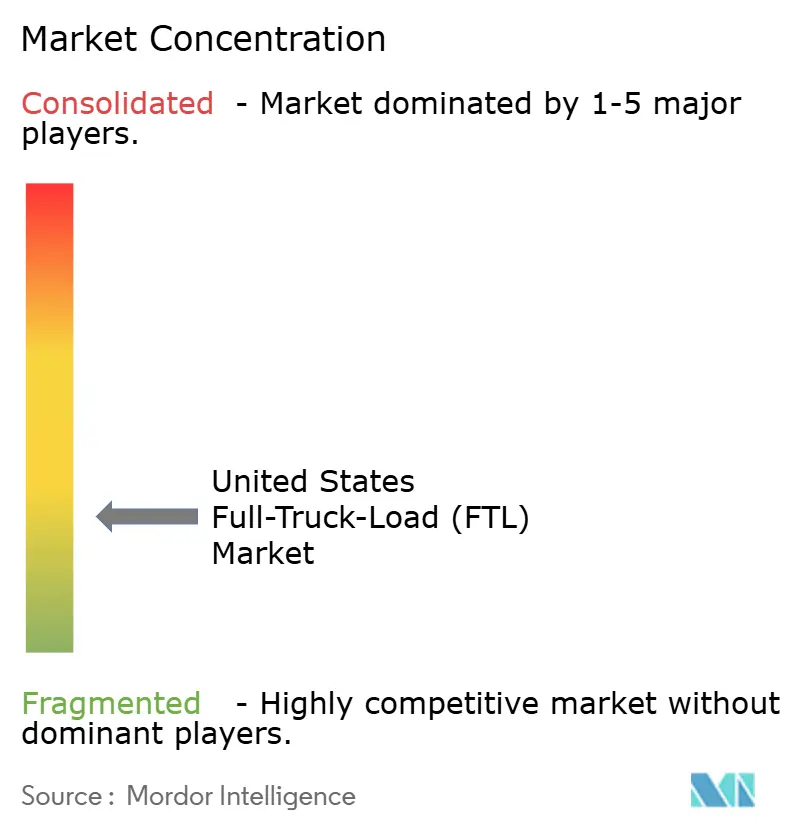
| Market Concentration | Low |
Major Players
*Disclaimer: Major Players sorted in no particular order Image © Mordor Intelligence. Reuse requires attribution under CC BY 4.0. |
|

United States Full-Truck-Load (FTL) Market Analysis by Mordor Intelligence
The United States full-truck-load market size stands at USD 448.65 billion in 2025 and is projected to reach USD 534.86 billion by 2030, translating to a 3.58% CAGR between 2025-2030. This growth arises from a resilient freight mix shaped by e-commerce parcelization, near-shore manufacturing, and the escalating use of dedicated contract carriage. Carriers continue adjusting networks to serve dense fulfillment corridors that replenish distribution centers on predictable schedules, even as driver shortages and diesel-price volatility persist. Federal infrastructure spending keeps construction material flows lively, while cannabis legalization and pharmaceutical cold-chain requirements create premium-priced niches. Strategic lane optimization, asset utilization above 90%, and technology-enabled dispatching are now baseline expectations rather than differentiators in the United States Full-Truck-Load market.
Key Report Takeaways
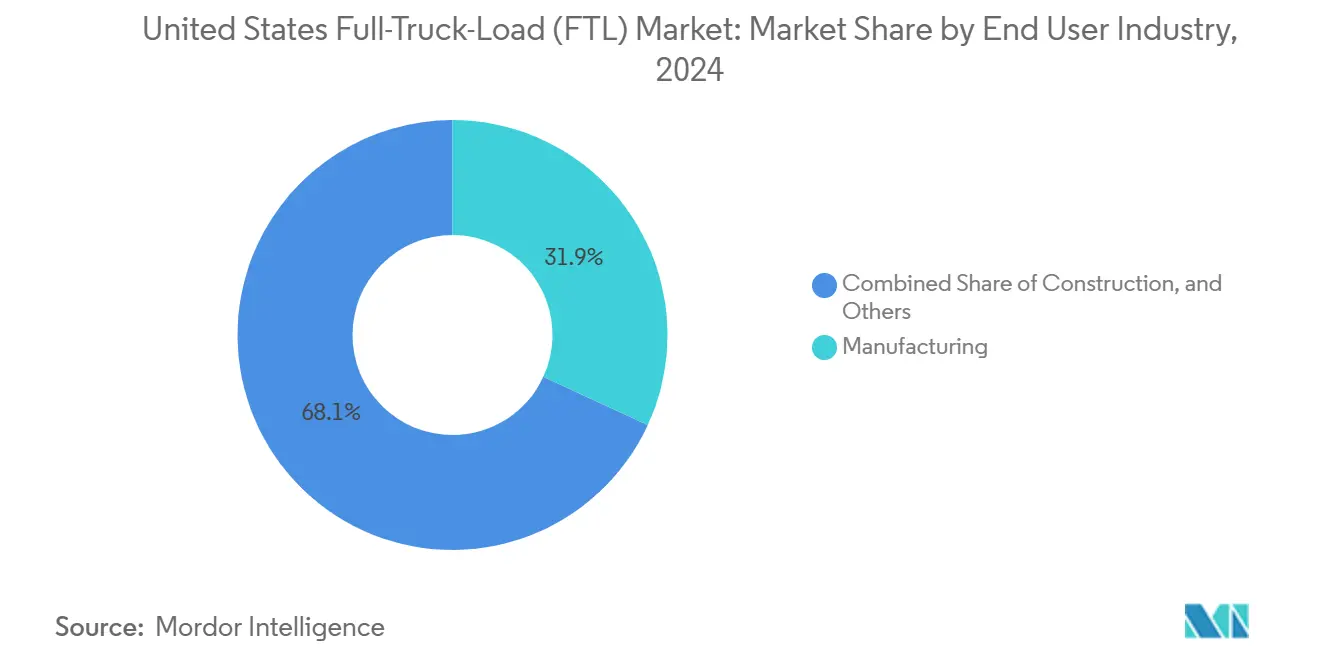
- By end user industry, manufacturing led with a 31.87% of the United States Full-Truck-Load market share in 2024; it is also forecast to expand at a 4.17% CAGR between 2025-2030.
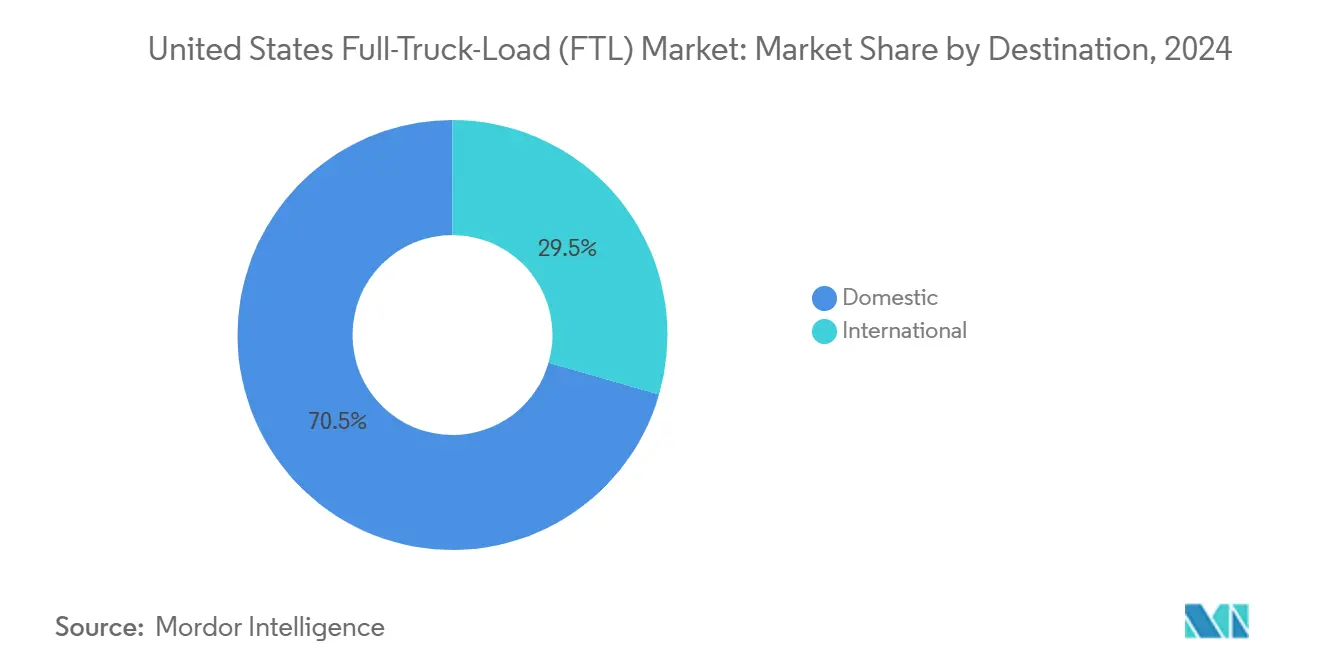
- By destination, domestic movements controlled 70.54% of the United States Full-Truck-Load market size in 2024, while international flows are advancing at a 3.66% CAGR between 2025-2030.
United States Full-Truck-Load (FTL) Market Trends and Insights
Drivers Impact Analysis
| Driver | (~) % Impact on CAGR Forecast | Geographic Relevance | Impact Timeline |
|---|---|---|---|
| Explosive e-commerce parcelization | 0.9% | National, with concentration in major metropolitan areas | Medium term (2-4 years) |
| Manufacturing reshoring and near-shore trends | 1.1% | Midwest manufacturing belt, Southeast automotive corridor | Long term (≥ 4 years) |
| Infrastructure Investment and Jobs Act freight stimulus | 0.7% | National, with emphasis on rural and underserved regions | Medium term (2-4 years) |
| Growth in dedicated contract carriage | 0.6% | National, with higher adoption in consumer goods sectors | Short term (≤ 2 years) |
| Cannabis-supply legalization wave | 0.2% | Legal states with expanding medical/recreational programs | Short term (≤ 2 years) |
| Cold-chain pharma expansion | 0.3% | National, concentrated around pharmaceutical manufacturing hubs | Medium term (2-4 years) |
| Source: Mordor Intelligence | |||
Understand The Key Trends Shaping This Market
Download PDF
Explosive E-commerce Parcelization
Amazon’s fast-growing fulfillment estate and the wider omnichannel pivot keep full-truck-load lanes busy between upstream distribution centers and last-mile cross-dock sites. Predictable replenishment schedules enable carriers to lock in dedicated routing contracts, with drop-and-hook models now exceeding 95% of FreightPower platform shipments. Higher return volumes also create reverse-logistics demand, supporting balanced backhauls and superior asset turns. These dynamics underpin service reliability expectations that favor asset-based fleets in the United States Full-Truck-Load market[1]“CHIPS and Science Act,” U.S. Department of Commerce, commerce.gov .
Manufacturing Reshoring and Near-shore Trends
The USD 52 billion CHIPS and Science Act catalyzes semiconductor plant construction across the Southeast and Southwest, spawning continuous inbound flows of high-value equipment and construction inputs. Near-shore automotive production in Mexico feeds cross-border corridors where intermodal options now link Monterrey, Laredo, and Atlanta. Shorter yet more frequent hauls lift trip counts, stimulate specialized trailer demand, and lift overall volumes in the United States Full-Truck-Load market[2]“Infrastructure Investment and Jobs Act,” U.S. Department of Transportation, transportation.gov.
Infrastructure Investment and Jobs Act Freight Stimulus
USD 1.2 trillion in federal outlays sustains construction-material shipments, especially steel, aggregate, and prefabricated panels riding short- to medium-haul dry-van lanes. Upgraded bridges and highways trim transit times and fuel burn, with studies citing up to 26% fuel savings at optimized speeds. Expanded rural road networks enlarge the serviceable catchment for regional carriers, a structural tailwind through 2028.
Growth in Dedicated Contract Carriage
Shippers seeking cost certainty and liability control lean into dedicated fleets. Schneider National now sources about 70% of truckload revenue from this model, with dedicated weekly revenue per truck of USD 4,034 versus USD 3,767 for network operations. Acquisition activity such as Ryder’s USD 302 million takeover of Cardinal Logistics illustrates the strategic race for dedicated capacity. The trend strengthens margin stability across the United States Full-Truck-Load market.
Restraints Impact Analysis
| Restraint | (~) % Impact on CAGR Forecast | Geographic Relevance | Impact Timeline |
|---|---|---|---|
| Driver shortage and escalating labor costs | -1.2% | National, with acute shortages in long-haul segments | Long term (≥ 4 years) |
| Diesel-price volatility | -0.4% | National, with higher impact on long-haul operations | Short term (≤ 2 years) |
| Urban congestion-pricing zones | -0.1% | Major metropolitan areas implementing congestion pricing | Medium term (2-4 years) |
| Limited public EV-truck charging corridors | -0.2% | National, with emphasis on long-haul freight corridors | Long term (≥ 4 years) |
| Source: Mordor Intelligence | |||
Driver Shortage and Escalating Labor Costs
Owner-operator exits trimmed Schneider’s independent fleet by 12% year-over-year in Q3 2024, mirroring an industry-wide contraction in entrepreneurial capacity. Credit stress resembles 2008 levels as equipment repossessions rise, shifting volume to costlier company drivers. Insurance premiums surge amid nuclear verdict exposure, adding USD 10 million to annual overhead at large carriers. AI-based recruiting and wellness tools show a 49% return on investment, yet the labor gap still depresses long-haul capacity in the United States Full-Truck-Load market[3]“Short-Term Energy Outlook,” U.S. Energy Information Administration, eia.gov.
Diesel-Price Volatility
Fuel accounts for roughly 20-25% of cost per mile; Energy Information Administration forecasts show diesel climbing from USD 3.46 in Q1 to USD 3.75 in Q4 2025. Hedging, dynamic surcharge programs, and aerodynamic retrofits buffer carriers, but volatility remains a recurring drag on margins. Evaluations of alternative fuel tractors accelerate, particularly for regional lanes where electric range is feasible[4]“Insurance cost surge hits carriers,” The Trucker, thetrucker.com.
Segment Analysis
By End User Industry: Manufacturing Drives Growth
Manufacturing held 31.87% of the United States Full-Truck-Load market share in 2024 and is pacing for a 4.17% CAGR between 2025-2030, cementing its status as both volume anchor and growth engine. Semiconductor plant construction, automotive reshoring, and machinery upgrades widen lane density across the Midwest and Southeast. The United States Full-Truck-Load market size tied to manufacturing is anticipated to add more than USD 25 billion over the forecast horizon, supported by predictable raw-material inflows and finished-goods outflows. Dedicated flatbed and temperature-controlled equipment gains prominence for sensitive components, a niche where carriers command premium rates. Competitive differentiation hinges on real-time visibility and just-in-time reliability, prompting investment in AI route-planning and sensor-equipped trailers. The United States Full-Truck-Load industry, therefore, witnesses asset mixtures tilting toward specialized rigs that lift yields and bolster carrier.
Outside manufacturing, construction sustains elevated volume on the back of federal infrastructure projects and robust residential demand. Wholesale & retail trade leverages cross-dock networks for e-commerce order pooling, while oil, gas, and mining lanes stay stable on equipment repositioning rhythms. Agriculture’s seasonal output supports flexible capacity models, and emerging cannabis logistics further diversifies load mixes with high-margin, compliance-heavy freight.
Note: Segment shares of all individual segments available upon report purchase
Get Detailed Market Forecasts at the Most Granular Levels
Download PDF
By Destination: Domestic Dominance with International Growth
Domestic shipping captured 70.54% of the United States Full-Truck-Load market size in 2024 and remains the backbone of national freight flow. Dense consumer zones in the Northeast and West Coast drive replenishment circuits, whereas industrial belts in the Midwest and Southeast feed component distribution toward assembly hubs. Domestic lanes benefit from infrastructure upgrades that lift average speeds and cut idle time.
However, international truckload traffic—mainly U.S.-Mexico and U.S.-Canada—posts the quicker 3.66% CAGR between 2025-2030, propelled by near-shore manufacturing. Schneider’s new intermodal service linking Monterrey and Atlanta exemplifies carrier strategies to blend rail efficiency with cross-border trucking flexibility. Customs-clearance expertise and security-bond handling thus become differentiators for fleets pursuing this faster-growing slice of the United States Full-Truck-Load market.
Get Detailed Market Forecasts at the Most Granular Levels
Download PDF
Geography Analysis
Texas anchors the nation’s heaviest outbound tonnage thanks to energy shipments, consumer inflows, and four key border crossings that facilitate near-shore trade. Infrastructure projects widen Interstate 35 bottlenecks, elevating throughput and drawing carriers to San Antonio cross-dock clusters. California, while still vital for port drayage and high-value produce, grapples with emissions rules that accelerate fleet turnover toward newer tractors fitted with advanced after-treatment.
Southeast states Alabama, Tennessee, South Carolina continue attracting automotive investment, creating compact lane patterns where component trailers cycle multiple turns weekly. Rural road upgrades funded under the Infrastructure Investment & Jobs Act open previously under-served freight zones, particularly in Appalachia and the Upper Plains.
In the Northeast, proposed congestion pricing in New York City is a looming cost variable, prompting carriers to optimize night deliveries and multistop loads to preserve margins.
Competitive Landscape
Asset-based carriers dominate shipper procurement strategies as reliability eclipses lowest-cost brokering. Schneider National’s 95.9% Q1 2025 operating ratio reflects disciplined pricing and tight cost management. Dedicated contract carriage’s resilient yield stream attracts capital: Ryder’s acquisition of Cardinal Logistics and Schneider’s purchase of Cowan Systems both expanded captive fleets and top-line potential.
Technology adoption is the next battleground. AI dispatch engines, predictive maintenance suites, and driver-facing workflow apps are table stakes for incumbents, while M&A at global scale—illustrated by DSV’s USD 15.9 billion purchase of DB Schenker signals strategic bids for network reach. Specialized arenas such as cannabis distribution and pharmaceutical cold-chain offer margin-protective moats for carriers investing in temperature-validated trailers and compliance systems.
Overall, the United States Full-Truck-Load market favors operators that blend capacity control, technological acumen, and focused service portfolios.
United States Full-Truck-Load (FTL) Industry Leaders
-
J.B. Hunt Transport, Inc.
-
Knight-Swift Transportation Holdings Inc.
-
Landstar System Inc.
-
Werner Enterprises Inc.
-
Schneider National Inc.
- *Disclaimer: Major Players sorted in no particular order
Need More Details on Market Players and Competitors?
Download PDF
Recent Industry Developments
- April 2025: DSV A/S finalized its USD 15.9 billion acquisition of DB Schenker, creating the world’s largest freight forwarder and boosting North American capacity.
- April 2025: Ryder System closed its USD 302 million purchase of Cardinal Logistics, adding roughly 1,800 vehicles to its dedicated fleet.
- December 2024: Schneider National acquired Cowan Systems to deepen dedicated contract carriage capabilities and expects USD 20-30 million in synergies.
- February 2024: J.B. Hunt Transport Services signed a long-term intermodal pact with Walmart, securing guaranteed capacity for the retailer’s distribution grid.
United States Full-Truck-Load (FTL) Market Report Scope
Agriculture, Fishing, and Forestry, Construction, Manufacturing, Oil and Gas, Mining and Quarrying, Wholesale and Retail Trade, Others are covered as segments by End User Industry. Domestic, International are covered as segments by Destination.
End User Industry
| Agriculture, Fishing, and Forestry |
| Construction |
| Manufacturing |
| Oil and Gas, Mining and Quarrying |
| Wholesale and Retail Trade |
| Others |
Destination
| Domestic |
| International |
| End User Industry | Agriculture, Fishing, and Forestry |
| Construction | |
| Manufacturing | |
| Oil and Gas, Mining and Quarrying | |
| Wholesale and Retail Trade | |
| Others | |
| Destination | Domestic |
| International |
Need A Different Region or Segment?
Customize Now
Market Definition
- Agriculture, Fishing, and Forestry (AFF) - This end user industry segment captures the external (outsourced) logistics expenditure incurred by the AFF industry players on road freight transport service. The end user players considered are the establishments primarily engaged in growing crops, raising animals, harvesting timber, harvesting fish & other animals from their natural habitats and providing related support activities. Herein, across the value chain, Logistics Service Providers (LSPs) play a crucial role in acquisition, storage, handling, transportation, and distribution activities for the optimal & continuous flow of inputs (seeds, pesticides, fertilizers, equipment, and water) from manufacturers or suppliers to the producers and smooth flow of output (produce, agro-goods) to distributors/ consumers. This includes both termperature controlled and non-temperature controlled logistics, as and when required according to the shelf life of goods being transported or stored.
- Construction - This end user industry segment captures the external (outsourced) logistics expenditure incurred by the construction industry players, on road freight transport service. The end user players considered are the establishments primarily engaged in constructing, repairing and renovating residential & commercial buildings, infrastructure, engineering works, subdividing and developing land. Logistics Service Providers (LSPs) play a crucial role in increasing profitability of construction projects by maintaing the inventory of raw materials & equipment, time-critical supplies and by providing other value added services for effective project management.
- Containerized Road Freight Transport - The segment captures the external (outsourced) logistics expenditure incurred by the road freight transport service end users on Full-Truck-Load (FTL) services. FTL road freight transport is characterized as a full single load not combined with other shipments. It comprises of shipments (i) devoted to the goods of a single shipper (ii) taken directly from a point of origin to one or more destination points (iii) comprising of bulk mail truck transportation (iv) comprising of both Container (Full Container Load, FCL)/Non-Container trucking services (v)comprsing of goods requiring temperature controlled or non-temperature controlled transportation services (vi) comprising of bulk liquid tankering (vii) invoving trucking of waste (viii) hazardous material trucking. Related value added services (VAS) of sorting, consolidation, deconslidation are included in the other services segment of freight and logistics market.
- Export Trends and Import Trends - Overall logistics performance of an economy is positively and significantly (statistically) correlated to its trade performance (exports and imports). Hence, in this industry trend, total value of trade, major commodities/ commodity groups and the major trade partners, for the studied geography (country or region as per the scope of report) have been analysed alongside the impact of major trade/logistics infrastructure investments & regulatory environment.
- Fluid Goods - The segment captures the external (outsourced) logistics expenditure incurred by the road freight transport service end users for the transport of bulk liquids, that are often used in extraction, manufacturing, food processing, agriculture industries among others. It includes transportation of liquids like (i) Chemicals/ hazardous goods (for instance acids) (ii) Water (potable as well as waste) (iii) Oil and gas (upstream as well as downstream like gasoline, fuel, crude oil, or propane), (iv) Food grade bulk liquids (like milk, or juice), (v) Rubber, (vi) Agrichemical products, among others. These goods are generally transported through tanker trucking.
- Fuel Price - Fuel price spikes can cause delays and diruption for logistics service providers (LSPs), while drops in the same can result in higher short-term profitability and increased market rivalry to offer consumers with the best deals. Hence, the fuel price variations have been studied over the review period and presented along with the causes as well as market impacts.
- Full-Truck-Load (FTL) Road Freight Transport - The segment captures the external (outsourced) logistics expenditure incurred by the road freight transport service end users on Full-Truck-Load (FTL) services. FTL road freight transport is characterized as a full single load not combined with other shipments. It comprises of shipments (i) devoted to the goods of a single shipper (ii) taken directly from a point of origin to one or more destination points (iii) comprising of bulk mail truck transportation (iv) comprising of both Container (Full Container Load, FCL)/Non-Container trucking services (v)comprsing of goods requiring temperature controlled or non-temperature controlled transportation services (vi) comprising of bulk liquid tankering (vii) invoving trucking of waste (viii) hazardous material trucking. Related value added services (VAS) of sorting, consolidation, deconslidation are included in the other services segment of freight and logistics market.
- GDP Distribution by Economic Activity - Nominal Gross Domestic Product and distribution of the same, across major economic sectors in the geography studied (country or region as per scope of the report) have been studied and presented in this industry trend. As GDP is positively related to the profitability and growth of logistics industry, this data has been used in adjunction to the input-output tables/ supply-use tables for analyzing the potential major contributing sectors towards the logistics demand.
- GDP Growth by Economic Activity - Growth of Nominal Gross Domestic Product across major economic sectors, for the geography studied (country or region as per scope of the report) have been presented in this industry trend. This data has been utilized for assessing the growth of logistics demand from all the market end users (economic sectors considered here).
- Inflation - Variations in both Wholesale Price Inflation (YoY change in producer price index) and Consumer Price Inflation have been presented in this industry trend. This data has been used to assess the inflationary environment as it plays a vital role in smooth functioning of the supply chain, directly impacting the logistics operational cost components e.g., pricing of tyres, driver wages & benefits, energy/fuel prices, maintenace costs, toll charges, warehousing rents, custom brokerage, forwarding rates, courier rates etc. hence impacting the overall freight and logistics market.
- Key Industry Trends - The report section named "Key Industry Trends" include all the key variables/parameters studied to better analyze the market size estimates and forecasts. All the trends have been presented in the form of data points (time series or latest available data points) along with analysis of the paramter in the form of concise market relevant commentary, for the geography studied (country or region as per the scope of report).
- Key Strategic Moves - The action taken by a company to differentiate from its competitor or used as a general strategy is referred to as a key strategic move (KSM). This includes (1) Agreements (2) Expansions (3) Financial Restructuring (4) Mergers and Acquisitions (5) Partnerships, and (6) Product Innovations. Key players (Logistics Service Providers, LSPs) in the market have been shortlisted, their KSM have been studied and presented in this section.
- Less than-Truck-Load (LTL) Road Freight Transport - The segment captures the external (outsourced) logistics expenditure incurred by the road freight transport service end users on Less than-Truck-Load (LTL) services. LTL road freight transport is characterized as multiple shipments combined onto a single truck for multiple deliveries within a network. It comprises of establishments (i) primarily engaged in general and specialized freight trucking of less than complete truck-loads, (ii) characterized by the use of terminals to consolidate shipments, generally from several shippers, into a single truck for haulage between a load assembly terminal and a disassembly terminal, where the load is sorted and shipments are re-routed for delivery (iv) Less than-Container-Load (LCL) shipping/ Groupage Shipping in case of trucking services. The activities in scope include (i) local pick-up, (ii) line-haul, and (iii) local delivery. Related value added services (VAS) of sorting, consolidation, deconslidation are included in the other services segment of freight and logistics market.
- Logistics Performance - Logistics Performance and Logistics Costs are the backbone of trade, and influences trade costs, making countries compete globally. Logistics performance is influenced by market wide adopted supply chain management strategies, government services, investments & policies, fuel/ energy costs, inflationary environment etc. Hence, in this industry trend, the logistics performance of the geography studied (country/ region as per the scope of report) has been analysed and presented over the review period.
- Major Truck Suppliers - Market share of truck brands is influenced by factors like geographical preferences, portfolio of truck types, truck prices, local production, truck repair & maintenance service peneteration, customer support, technological innovations (like electric vehicles, digitalization, autonomous trucks), fuel efficiency, financing options, annual maintenance costs, availability of substitutes, marketing startegies etc. Hence, the distribution (share % for base year of the study) of truck sales volume for leading truck brands and commentary on current market scenario & market anticipation over the forecast period have been presented in this industry trend.
- Manufacturing - This end user industry segment captures the external (outsourced) logistics expenditure incurred by the Manufacturing industry players, on road freight transport service. The end user players considered are the establishments primarily engaged in the chemical, mechanical or physical transformation of materials or substances into new products. Logistics Service Providers (LSPs) play a crucial role in maintaining a smooth flow of raw materials across the supply chain, enabling timely delivery of finished goods to distributors or end customers and storing & supplying the raw materials to clients for just-in-time manufacturing.
- Modal Share - Freight Modal Share is influenced by factors like modal productivity, government regulations, containerization, distance of shipment, temperature control requirements, type of goods, international trade, terrain, speed of delivery, shipment weight, bulk shipments, etc. Also, modal share by tonnage (tons) and modal share by freight turnover (ton-km) differ as per average distance of shipments, weight of major commodity groups transported in the economy and number of trips. This industry trend represents the distribution of freight transported by mode of transport (tons as well as ton-km), for the study base year.
- Oil and Gas, Mining and Quarrying - This end user industry segment captures the external (outsourced) logistics expenditure incurred by the extraction industry players, on road freight transport service. The end user players considered are the establishments that extract naturally occurring mineral solids, such as coal and ores; liquid minerals, such as crude petroleum; and gases, such as natural gas. Logistics Service Providers (LSPs) covers entire phases from upstream to downstream and plays a crucial role in the transportation of machinery, drilling equipments, extracted minerals, crude oil & natural gas and refined/ processed products from one place to another.
- Other End Users - Other end user segment captures the external (outsourced) logistics expenditure incurred by the financial services (BFSI), real estate, educational services, healthcare, and professional services (administrative, waste management, legal, architectural, engineering, design, consulting, scientific R&D), on road freight transport service. Logistics Service Providers (LSPs) plays a crucial role in the reliable movement of supplies and documents to/from these industries such as transporting any equipment or resources required, shipping confidential documents and files, movement of medical goods & supplies (surgical supplies and instruments, including gloves, masks, syringes, equipment) to name a few.
- Producer Price Inflation - It indicates inflation from viewpoint of the producers viz. the average selling price received for their output over a period of time. Annual change (YoY) of producer price index is reported as wholesale price inflation in the "Inflation" industry trend. As WPI captures dynamic price movements in most comprehensive way, it is widely used by governments, banks, industry, business circles and is deemed important in formulation of trade, fiscal and other economic policies. The data has been used in adjunction to consumer price inflation for better understanding the inflationary environment.
- Road Freight Pricing Trends - Freight pricing by mode of transport (USD/tonkm), over the review period, has been presented in this industry trend. The data has been used in assessing the inflationary environment, impact on trade, freight turnover (tonkm), road freight transport market demand and hence the road freight transport market size.
- Road Freight Tonnage Trends - Freight tonnage (weight of goods in tons) handled by mode of transport, over the review period, has been presented in this industry trend. The data has been used as one of the parameters apart from average distance per shipment (km), freight volume (tonkm), and freight pricing (USD/tonkm) to assess the freight transport market size.
- Road Freight Transport - Hiring a road freight transport logistics service provider (LSP) or haulier (outsourced logistics), for the transport of commodities constitutes road freight transport market. The scope of study includes (i) road transport of goods reported by hauliers registered in the reporting countries (ii) transport of raw materials or manufactured goods (solids as well as fluids) (iii) transport using commerical motor vehicles (rigid trucks or tractor-trailers, (iv) Full-Truck-Load (FTL) or Less than-Truck-Load (LTL) transport (v) containerized or non-containerized transport (vi) temperature controlled or non-temperature controlled trasnport, (vii) short haul or long haul (Over-the-road, OTR) transport, (viii) used office or household goods transport (movers and packers), (ix) other specialized cargo transport (dangerous goods, oversized cargo) and (x) outsourced first mile/ middle mile/last mile delivery shipments undertaken by road freight transport players. The scope does not include (i) transport undertaken by hauliers registered in other countries (ii) last mile meal delivery market (iii) grocery delivery market (iv) transportation via road network undertaken/ reported by Courier, Express, and Parcel (CEP) players.
- Road Length - As infrastructure plays a vital role in an economy's logistics performance, variables like length of roads, distribution of road length by surface category (paved v/s unpaved), distribution of road length by road classification (expressways v/s highways v/s other roads), have been analysed and presented in this industry trend.
- Segmental Revenue - Segmental Revenue has been triangulated or computed and presented for all the major players in the market. It refers to the road freight transport market specific revenue earned by the company, over the base year of study, in the geography studied (country or region as per the scope of report). It is computed through the study and analysis of major parameters like financials, service portfolio, employee strength, fleet size, investments, number of countries present in, major economies of concern, etc. that have been reported by the company in its annual reports, webpage. For companies having scarce financial disclosures, paid databases like D&B Hoovers, Dow Jones Factiva have been resorted to and verified through industry/expert interactions.
- Short Haul Road Freight Transport - The segment captures the external (outsourced) logistics expenditure incurred by the road freight transport service end users on local trucking (less than 100 miles). It includes the road transport of goods (i) within a single administrative area and its hinterland, (ii) by smaller trucks and pickup trucks (iii) via containerized as well as dry bulk services (iv) intermodal from ports, container terminals or airports, and (v) outsourced first mile/ last mile delivery shipments undertaken by road freight transport players.
- Transport and Storage Sector GDP - Value and growth of Transport and Storage Sector GDP has a direct relation to the freight and logistics market size, and hence road freight transport market size. Therefore, this variable has been studied and presented over the review period, in value terms (USD) and as share % of total GDP, in this industry trend. The data has been supported by concise and relevant commentary around the investments, developments, and current market scenario.
- Trends in E-Commerce Industry - Enhanced internet connectivity and boom in smartphone penetration, coupled with increasing disposable incomes, has led to a phenomenal growth in the e-commerce market globally. Online shoppers require fast and efficient delivery of their orders leading to an increase in the demand for logistics services especially e-commerce fulfilment services. Hence, the Gross Merchandise Value (GMV), historial and projected growth, breakup of major commodity groups in e-commerce industry for the studied geography (country or region as per scope of the report) have been analysed and presented in this industry trend.
- Trends in Manufacturing Industry - Manufacturing industry involves the transformation of raw materials into finished products, while logistics industry ensures the efficient flow of raw materials to the factory, and the transport of manufactured products to the distributors & consumers. Demand-Supply of both industries are highly cross-linked and critical for a seamless supply chain. Hence, the Gross Value Added (GVA), breakup of GVA into major manufacturing sectors, and growth of manufacturing industry over the review period have been analysed and presented, in this industry trend.
- Trucking Fleet Size By Type - Market share of truck types is influenced by factors like geographical preferences, major end user industries, truck prices, local production, truck repair & maintenance service peneteration, customer support, technological disruptions (like electric vehicles, digitalization, autonomous trucks) etc. Hence, the distribution (share % for base year of study) of truck parc volume by type of truck, market disruptors, truck manufacturing investments, truck specifications, truck use & import regulations, and market anticipation over the forecast period have been presented in this industry trend.
- Trucking Operational Costs - The prime reasons for measuring/ benchmarking logistics performance of any trucking company are to reduce operational costs and increase profitability. On the other hand, measuring operational costs helps to identify whether and where to make operational changes to control expenses and identify areas for improved performance. Hence, in this industry trend, trucking operational costs and the variables involved viz. driver wages & benefits, fuel prices, repairs & maintenance costs, tyre costs etc. have been studied over the base year of study, and presented for the geography studied (country or region as per the scope of report).
- Wholesale and Retail Trade - This end user industry segment captures the external (outsourced) logistics expenditure incurred by the wholesalers and retailers, on road freight transport service. The end user players considered are the establishments primarily engaged in wholesaling or retailing merchandise, generally without transformation, and rendering services incidental to the sale of merchandise. Logistics Service Providers (LSPs) plays a crucial role in the reliable movement of supplies to and finished products from production houses to the distributors and finally to the end customer covering activites like material sourcing, transportation, order fulfillment, warehousing & storage, demand forecasting, inventory management etc.
| Keyword | Definition |
|---|---|
| Cabotage | Road transport by a motor vehicle registered in a country performed on the national territory of another country. |
| Cross Docking | Cross docking is a logistics procedure where products from a supplier or manufacturing plant are distributed directly to a customer or retail chain with marginal to no handling or storage time. Cross docking takes place in a distribution docking terminal; usually consisting of trucks and dock doors on two (inbound and outbound) sides with minimal storage space. The name ‘cross docking’ explains the process of receiving products through an inbound dock and then transferring them across the dock to the outbound transportation dock. |
| Cross Trade | International road transport between two different countries performed by a road motor vehicle registered in a third country. A third country is a country other than the country of loading/embarkation and than the country of unloading/disembarkation. |
| Dangerous Goods | The classes of dangerous goods carried by Road are those defined by the fifteenth revised edition of the UN Recommendations on the Transport of Dangerous Goods, United Nations, Geneva 2007. They include Class 1: Explosives; Class 2: Gases; Class 3: Flammable Liquids; Class 4: Flammable solids- substances liable to spontaneous combustion; substances which, on contact with water, emit flammable gases; Class 5: Oxidizing substances and organic peroxides; Class 6: Toxic and infectious substances; Class 7: Radioactive material and Class 8: Corrosive substances, Class 9: Miscellaneous dangerous substances and articles. |
| Direct Shipment | Direct shipment is a method of delivering goods from the supplier or the product owner to the customer directly. In most cases, the customer orders the goods from the product owner. This delivery scheme reduces transportation and storage costs, but requires additional planning and administration. |
| Drayage | A drayage is a form of trucking service that connects the different modes of shipping (intermodal), such as ocean freight or air freight. It’s a short-haul trip that transports goods from one place to another, usually before or after its long-haul shipping process. Drayage trucks move cargo to and from various destinations, such as container ships, storage lots, order fulfillment warehouses, and rail yards. Typically, drayage only transports goods in short distances and operates only in one metropolitan area. It also requires only one trucker in a single shift. But despite this, but it plays an important role in long-haul shipping because it gets the goods to the cargo and vice versa. It makes intermodal transport much more efficient and enables the seamless transfer of goods to the end customer. |
| Dry van | A dry van is a type of semi-trailer that's fully enclosed to protect shipments from outside elements. Designed to carry palletized, boxed or loose freight, dry vans aren't temperature-controlled (unlike refrigerated “reefer” units) and can't carry oversized shipments (unlike flatbed trailers). |
| Final Demand | Final demand includes all types of commodities (goods as well as services) consumed as final use and might include personal consumption, or consumption by government, by businesses as capital investment, and as exports. includes all types of commodities (goods as well as services) consumed as final use and might include personal consumption, or consumption by government, by businesses as capital investment, and as exports. |
| Flatbed Truck | A flatbed truck is a type of truck with rigid design. It has a back body that is flatly shaped for easy loading and unloading of goods. The flatbed truck is mostly used to transport heavy, oversized, wide and indelicate goods such as machinery, building supplies or equipment. Due to the truck open body, the goods transported with it must not be vulnerable to rain. By functionality, the flatbed truck is comparable to a flatbed trailer. |
| Inbound Logistics | Inbound logistics is the way materials and other goods are brought into a company. This process includes the steps to order, receive, store, transport and manage incoming supplies. Inbound logistics focuses on the supply part of the supply-demand equation. |
| Intermediate Demand | Intermediate demand includes goods, services, and maintenance and repair construction sold to businesses, excluding capital investment. |
| International Loaded | Place of loading of goods in reporting country (i.e., country in which the vehicle performing the transport is registered) and place of unloading in a different country. |
| International Unloaded | Place of unloading of goods in reporting country (i.e., country in which the vehicle performing the transport is registered) and place of loading in a different country. |
| OOG cargo | Out of Gauge (OOG) cargo is any cargo that can not be loaded into six-sided shipping containers simply because it is too large. The term is a very loose classification of all cargo with dimensions beyond the maximum 40HC container dimensions. That is a length beyond 12.05 meters – a width beyond 2.33 meters – or a height beyond 2.59 meters. |
| Pallets | Raised platform, intended to facilitate the lifting and stacking of goods. |
| Part load | A part load describes goods which only fills a truck partially. In essence, the quantity of the shipment is bigger than the Less Than Truckload (LTL) shipment. Also, the shipment cannot fully occupy a truck i.e. its capacity is much lower than a Full Truckload (FTL) shipment. |
| Paved Road | Road surfaced with crushed stone (macadam) with hydrocarbon binder or bituminized agents, with concrete or with cobblestone. |
| Reverse Logistics | Reverse logistics comprises of the sector of supply chains that process anything returning inwards through the supply chain or traveling ‘backward’ through the supply chain. |
| Road Freight Transport Service | Hiring a trucking agency for transport of commodities (raw materials or manufactured goods including both solids and liquids) form the origin to a destination within the country (domestic) or cross-border (international) constitutes road freight transport market. The service might be Full-Truck-Load or Less than-Truck-Load, containerized or non-containerized, temperature controlled or non temperature controlled, short haul or long haul. |
| Tautliner vehicle | Tautliner and curtainsider are used as generic names for curtain sided trucks/trailers. The curtains are permanently fixed to a runner at the top and detachable rails/poles at front and rear, allowing the curtains to be drawn open and forklifts used all along the sides for easy and efficient loading and unloading. When closed for travel, vertical load restraint straps are attached to a rope rail beneath the truck bed, connecting the truck bed and curtain along both sides. Winches at either end of the curtain tension it, hence the 'Tautliner' name. This stops the curtain from flapping or drumming in the wind and can also help retain light loads from slipping sideways. |
| Transport for hire or reward | The carriage for remuneration of goods. |
| Unpaved Road | Road with a stabilized base not surfaced with crushed stone, hydrocarbon binder or bituminized agents, concrete or cobblestone. |
Need More Details on Market Definition?
Ask a Question
Research Methodology
Mordor Intelligence follows a four-step methodology in all our reports.
- Step-1: Identify Key Variables: In order to build a robust forecasting methodology, the variables and factors identified in Step-1 are tested against available historical market numbers. Through an iterative process, the variables required for market forecast are set and the model is built on the basis of these variables.
- Step-2: Build a Market Model: Market-size estimations for the forecast years are in nominal terms. Inflation is considered to be a part of the pricing, and the average selling price (ASP) is varying throughout the forecast period for each country
- Step-3: Validate and Finalize: In this important step, all market numbers, variables and analyst calls are validated through an extensive network of primary research experts from the market studied. The respondents are selected across levels and functions to generate a holistic picture of the market studied.
- Step-4: Research Outputs: Syndicated Reports, Custom Consulting Assignments, Databases & Subscription Platforms

Get More Details On Research Methodology
Download PDF


