United States Feed Minerals Market Size and Share
Market Overview
| Study Period | 2018 - 2031 |
|---|---|
| Forecast Data Period | 2026 - 2031 |
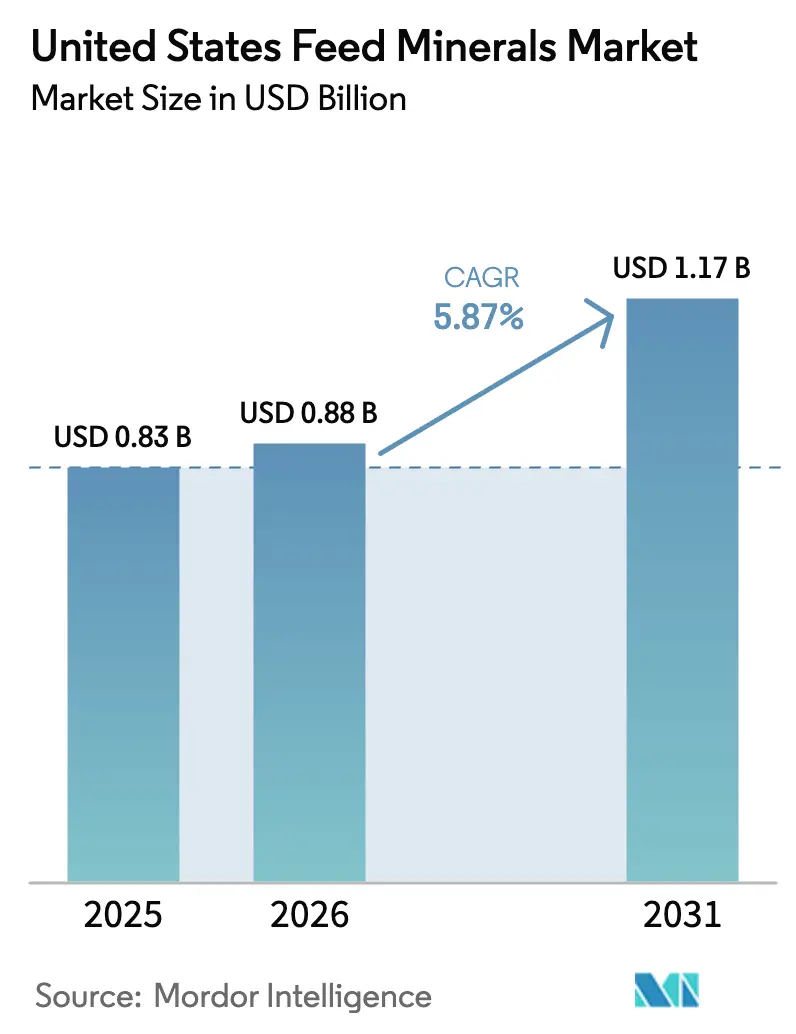
| Base Year Market Size (2025) | USD 0.83 Billion |
| Market Size (2026) | USD 0.88 Billion |
| Market Size (2031) | USD 1.17 Billion |
| Growth Rate (2026 - 2031) | 5.87% CAGR |
| Market Concentration | Medium |
Major Players *Disclaimer: Major Players sorted in no particular order Image © Mordor Intelligence. Reuse requires attribution under CC BY 4.0. | |
United States Feed Minerals Market Analysis by Mordor Intelligence
The feed minerals market size in the United States in 2026 is estimated at USD 0.88 billion, growing from 2025 value of USD 0.83 billion with 2031 projections showing USD 1.17 billion, growing at 5.87% CAGR over 2026-2031. This expansion is underpinned by rising precision-nutrition adoption, looming phosphorus-runoff regulation, and the steady scale-up of livestock production that demands mineral-dense concentrates. Feed formulators are deploying real-time analytics to align bioavailability with species-specific needs, trimming waste and positioning high-potency mineral premixes for premium pricing. Regulatory pressure to curb phosphorus excretion, escalating corn and soy costs, and consumer insistence on clean labels are all accelerating the transition toward organic and chelated minerals. Technology investments in IoT-enabled feed mills and algae-derived minerals continue to broaden supplier differentiation while buffering the sector against volatile raw-material markets. [1]DSM, “Verax Platform for Feed Formulation,” DSM Animal Nutrition, dsm.com
Key Report Takeaways
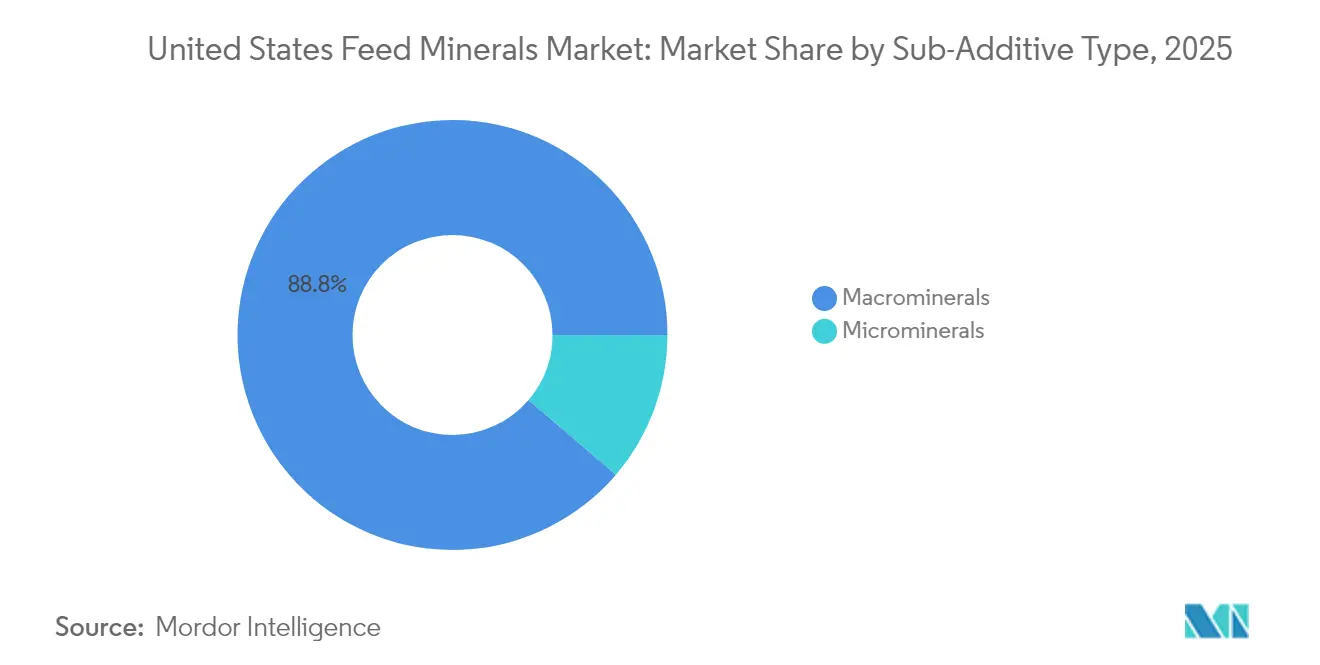
- By sub-additive, macrominerals led with 88.75% of the feed minerals market share in 2025, while microminerals are forecast to post a 6.05% CAGR through 2031.
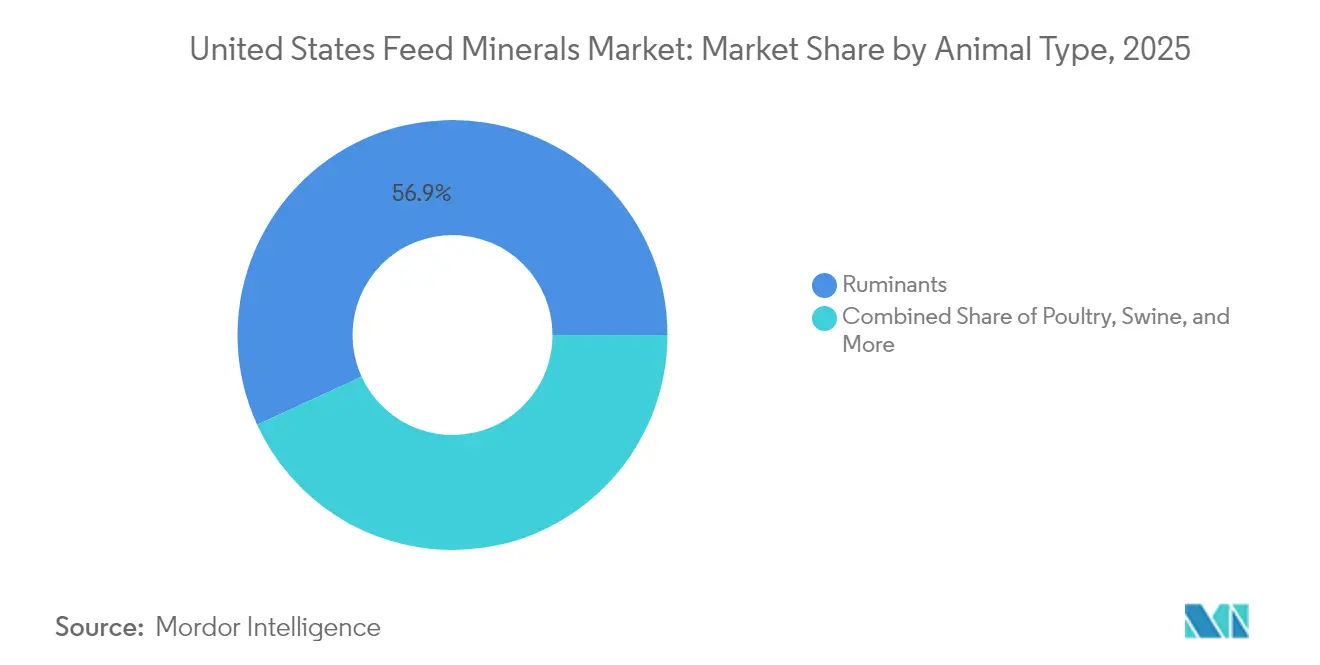
- By animal, ruminants accounted for 56.85% of the feed minerals market size in 2025 and are projected to expand at a 6.38% CAGR to 2031.
Note: Market size and forecast figures in this report are generated using Mordor Intelligence’s proprietary estimation framework, updated with the latest available data and insights as of 2026.
United States Feed Minerals Market Trends and Insights
Drivers Impact Analysis*
| Driver | (~) % Impact on CAGR Forecast | Geographic Relevance | Impact Timeline |
|---|---|---|---|
| Growing adoption of precision-nutrition software that links real-time mineral analytics with ration formulation | +1.2% | National, with early gains in Midwest corn belt states | Medium term (2-4 years) |
| Sustained poultry export growth driving demand for high-bioavailability macro-minerals | +0.8% | National, concentrated in poultry-producing states | Short term (≤ 2 years) |
| Rapid expansion of specialty trace-mineral chelates for gut-health optimization | +1.0% | National, with premium adoption in dairy regions | Medium term (2-4 years) |
| Inflation-led corn/soy cost pressure pushing integrators toward mineral-dense concentrates | +0.9% | National, particularly Midwest and Southeast | Short term (≤ 2 years) |
| Upcoming U.S. EPA phosphorus-run-off limits incentivizing more absorbable Phosphorus sources | +0.7% | National, with priority in watershed protection areas | Long term (≥ 4 years) |
| Venture-capital flow into algae-derived calcium and magnesium platforms | +0.4% | National, with R&D concentration in coastal states | Long term (≥ 4 years) |
| Source: Mordor Intelligence | |||


Growing Adoption of Precision-Nutrition Software That Links Real-Time Mineral Analytics with Ration Formulation
Feed-mill automation is shifting away from blanket safety margins toward point-of-use digital calibration that matches mineral inclusion to recorded absorption rates. Systems such as DSM’s Verax and ADIFO’s BESTMIX stream live sensor data into formulation algorithms, letting nutritionists cut excess mineral use by up to 15% without eroding animal performance. IoT sensors embedded in batching lines detect moisture and ingredient variability in real time, while cloud dashboards flag deviations and auto-correct dosage at throughput speeds above 100 tons per hour. This continuous feedback loop reduces copper and zinc oversupply that traditionally drives environmental excretion and invites stricter phosphorus effluent limits. Software adoption is most advanced in large Midwest integrators where corn-belt mills handle multi-species lines under a single roof, creating a sizable early-adopter market for premixes certified for tight bioavailability ranges. Feed-mineral suppliers that can document consistent solubility across production lots gain priority listings on digital libraries inside these programs, raising switching costs for integrators. As data ownership becomes a bargaining chip, vendors are packaging proprietary absorption coefficients to embed their products inside formulation databases, effectively creating a digital moat around recurring volume.
Sustained Poultry Export Growth Driving Demand for High-Bioavailability Macro-Minerals
Broiler growers chasing export premiums face stringent carcass-quality audits that penalize leg disorders linked to sub-optimal bone mineralization. Although total U.S. broiler exports fell 10.5% to 3.251 million metric tons in 2024, Mexico’s intake grew to 730,906 metric tons valued at USD 937.4 million, demonstrating how mineralized birds capture higher average selling prices. Micro-encapsulated calcium, phosphorus, and trace-mineral packages designed for early skeletal deposition gained traction after North Carolina State University reported a 9% feed-conversion lift with lipid-matrix minerals versus conventional salts. Export-oriented integrators in Georgia, Arkansas, and Alabama now issue vendor scorecards that reward suppliers able to furnish chelated macro-minerals with validated absorption above 85%. Sanitary and Phytosanitary (SPS) protocols further incentivize consistent mineral quality because bone density directly correlates with reduced carcass rejection rates at destination ports. This feedback cycle stimulates premium demand inside the feed minerals market and encourages backward integration by integrators willing to protect export margins.
Rapid Expansion of Specialty Trace-Mineral Chelates for Gut-Health Optimization
Organic zinc, copper, and manganese complexes reduce oxidative stress in intestinal villi, an effect amplified in antibiotic-free production systems where immune modulation must offset medicated-feed bans. BioZyme’s 2024 launch of VitaFerm ReproMaxx illustrates the commercial playbook: a 6,000 ppm chelated zinc inclusion paired with university-backed reproductive performance claims. The Zinpro Verified program corroborates dose-response curves, letting buyers rationalize chelate premiums that run three to four times the cost of inorganic sulfates. Dairy herds in Wisconsin and New York adopt these formulations to boost immune status during transition periods, yielding lower somatic-cell counts and longer productive lives. Reduced antagonism means fewer negative interactions with phytate, iron, or fiber components, allowing lower inclusion rates that free up ration space for energy additives. As processor labels tout “organic trace-mineral nutrition,” retailers pass price premiums upstream, reinforcing a virtuous cycle of value over volume within the feed minerals market. Suppliers capturing early patent positions in amino-acid chelation remain insulated from commoditization even as overall chelate adoption accelerates.
Upcoming U.S. EPA Phosphorus Run-Off Limits Incentivizing More Absorbable Phosphorus Sources
The EPA is tightening National Pollutant Discharge Elimination System permits, adding phosphorus caps in sensitive watersheds like the Chesapeake Bay and Lake Erie basins [2]EPA, “National Pollutant Discharge Elimination System,” epa.gov. Concentrated animal feeding operations will need to document a reduced phosphorus footprint, pushing feed formulators toward mono- and di-calcium phosphates with higher digestibility or paired with new-generation phytase enzymes. The Mosaic Company, leveraging its status as the largest domestic MCP/DCP producer, is scaling pilot lots that feature re-engineered crystal structures to boost true phosphorus retention above 70%. State cost-share grants now reimburse up to 40% of incremental feed cost if producers can verify lower manure phosphorus, effectively subsidizing adoption. Environmental compliance teams inside integrators assign shadow pricing to each percentage point of phosphorus voided, enabling ROI justification for pricier feed minerals. Over the long term, phosphorus use efficiency will become a competitive differentiator baked into retailer sustainability metrics, elevating demand for high-absorbability phosphorus sources within the feed minerals market.
Restraints Impact Analysis*
| Restraint | (~) % Impact on CAGR Forecast | Geographic Relevance | Impact Timeline |
|---|---|---|---|
| Supply-chain risk for key trace elements (Zn, Cu) due to tightening Chinese export quotas | -0.9% | National, with acute impact on trace mineral premix manufacturers | Short term (≤ 2 years) |
| Down-cycling of DDGS reducing supplemental mineral inclusion rates in swine diets | -0.6% | National, concentrated in ethanol-producing regions | Medium term (2-4 years) |
| Consumer backlash against "inorganic feed additives" in natural-labeled meat and dairy | -0.5% | National, with premium market concentration in coastal regions | Medium term (2-4 years) |
| Volatile global potash prices eroding margins for phosphate-based feed minerals | -0.4% | National, with particular impact on fertilizer-dependent mineral producers | Short term (≤ 2 years) |
| Source: Mordor Intelligence | |||
Supply-Chain Risk for Key Trace Elements due to Tightening Chinese Export Quotas
China’s February 2025 export-control list flagged tungsten, tellurium, and bismuth as critical metals, a move widely read as a trial balloon for future curbs on zinc and copper oxides essential for feed-grade trace minerals. The United States sources less than 5% of raw zinc ore directly from China, yet Beijing dominates mid-stream refining capacity that turns ore into high-purity feed additives. Premix blenders in Iowa and Minnesota report lead-time extensions from 8 to 14 weeks, forcing safety-stock buffers that tie up working capital. Futures prices on zinc sulfate monohydrate climbed 12% within two months of the announcement, compressing margins for contract manufacturers locked into forward-priced supply agreements with integrators. Alternate sources in Mexico and South Korea remain thin, and purity differences can impact bioavailability, risking compliance under AAFCO ingredient definitions. An extended quota regime could accelerate the adoption of locally refined secondary zinc recycled from galvanizing scrap, though current capacity covers less than one-third of feed-grade demand.
Volatile Global Potash Prices Eroding Margins for Phosphate-Based Feed Minerals
Potash settled at USD 443 per metric ton in January 2025 after a 4.1% dip, yet forward curves indicate 5% upward pressure driven by threatened tariff hikes on Canadian imports, which account for 85% of U.S. supply [3]World Bank, “Fertilizer Prices Gain Momentum amid Strong Demand,” worldbank.org. Phosphate-based feed minerals rely on potash co-products for balanced potassium formulation, so every USD 10 swing in potash pricing shaves roughly USD 1.7 million off aggregate EBITDA for mid-size U.S. mineral blenders. Anticipated volatility forces opportunistic buying sprees that strain storage capacity and working-capital lines. End users confronted with erratic pricing increasingly evaluate potassium-reducing ration strategies, dampening demand for certain mineral blends. Long term, producers may migrate to alternative potassium chloride sources extracted from brine lakes, but capacity expansion timelines leave a multi-year exposure window.
*Our forecasts treat driver/restraint impacts as directional, not additive. The impact forecasts reflect baseline growth, mix effects, and variable interactions.
Segment Analysis
By Sub Additive: Macrominerals Drive Market Foundation
Macrominerals captured 88.75% of the feed minerals market share in 2025, delivering the baseline calcium, phosphorus, and magnesium that underpin skeletal growth, milk yield, and metabolic stability across all commercial livestock. The segment is projected to log a 5.78% CAGR through 2031, fueled by expanding dairy consolidation and broiler export ambitions that reward superior bone integrity. The feed minerals market size allocated to microminerals remains smaller in absolute terms but represents the frontier of innovation, where chelation and encapsulation unlock superior uptake and reduced environmental loss.
The macromineral supply chain benefits from domestic phosphate mining in Florida and established import channels for potash via the Great Lakes, keeping landed costs competitive. Commodity pricing, however, leaves suppliers exposed to fertilizer cycles, prompting diversification into value-added coated versions that resist pelleting heat. Microminerals, by contrast, enable premium positioning: North Carolina State University demonstrated a 9% feed-conversion advantage for lipid-matrix zinc compared with free-form sulfates, underscoring the profit case for specialized carriers. Suppliers integrate data-verified bioavailability metrics into digital formulation libraries, locking in repeat volume as precision software refuses to substitute lower-grade inputs.


By Animal: Ruminants Lead Consumption Patterns
Ruminants held 56.85% of the feed minerals market size in 2025 and are projected to post the fastest advance at 6.38% CAGR through 2031. Dairy operators prioritize calcium and phosphorus density to support high-yield cows averaging 11,400 liters annually, driving steady volume growth in macromineral inclusion. Beef finishers in the High Plains also favor trace-mineral chelates that support immune function in backgrounded calves enduring transport stress.
BioZyme’s VitaFerm ReproMaxx, formulated with 6,000 ppm chelated zinc, epitomizes the shift toward outcome-specific ruminant products engineered for reproductive efficiency. Poultry constitutes the second-largest customer block, benefiting from mineral densification that yields export-grade carcasses with fewer bone fractures. Swine consumption swings with ethanol-linked DDGS supplies, while aquaculture demand, though nascent, gains momentum as recirculating systems seek mineral profiles that optimize osmoregulation and skeletal formation in salmonids and shrimp.
Geography Analysis
The Midwest dominates feed minerals market demand due to dense clusters of dairies, swine barns, and integrated poultry complexes. Proximity to phosphate rock shipped from Tampa and potash railed from Saskatchewan lowers freight-adjusted costs, affording local mills a margin edge. Corn-belt ethanol facilities generate DDGS that influence mineral inclusion rates, tying regional demand to biofuel production cycles.
In the Southeast, Alabama and Georgia integrators cater to export markets, channeling mineral premixes engineered for tight bone-quality specifications. Chesapeake Bay watershed regulations accelerate uptake of high-absorbability phosphorus blends among Delmarva poultry growers, reflecting how environmental policy reshapes localized product mixes.
Western states exhibit bifurcated demand: California’s Central Valley dairy operators invest in chelated calcium and magnesium to mitigate heat-stress-induced hypocalcemia, while Idaho and Washington fish farms test algae-derived minerals tuned for aquatic digestive physiology. Coastal R&D hubs intensify technology transfer, creating feedback loops that speed nationwide diffusion of novel mineral formats.
Competitive Landscape
The United States feed minerals market remains moderately fragmented, with the top five suppliers, such as Land O’Lakes, Inc., Alltech, Phibro Animal Health Corporation, Solvay, and Nutreco NV (SHV Holdings), holding a combined significant share. Cooperative models grant Land O’Lakes broad farmer access, while Zinpro Corporation carves a premium niche around research-verified chelated trace minerals. Phibro’s USD 350 million acquisition of Zoetis’ Manufacturing and Feed Additives portfolio in January 2024 expanded domestic production capacity and signals ongoing consolidation.
Players differentiate through vertical integration, proprietary chelation chemistry, and embedded data services that sync with precision-nutrition platforms. Alltech broadened capacity in Kentucky for Bioplex chelates, responding to organics-driven demand spikes. Mosaic leverages upstream phosphate assets, offering high-digestibility MCP/DCP variants aligned with new runoff regulations.
White-space opportunities lie in algae-derived mineral platforms attracting venture capital and in SaaS-style mineral analytics subscriptions that lock customers into recurring volumetric contracts. Barriers to entry include FDA-mandated ingredient approvals and capital-intensive spray-drying lines necessary to guarantee homogenous micro-inclusion.
United States Feed Minerals Industry Leaders
Land O’Lakes, Inc.
Alltech
Phibro Animal Health Corporation
Solvay
Nutreco NV (SHV Holdings)
- *Disclaimer: Major Players sorted in no particular order

Recent Industry Developments
- August 2024: BioZyme launched VitaFerm ReproMaxx premium cattle mineral line featuring Zinpro Performance Minerals at 6,000 ppm zinc inclusion, targeting reproductive success and immune function optimization with research-verified organic trace mineral formulations distributed through the company's established dealer network.
- July 2024: J.M. Huber Corporation announced its agreement to acquire Active Minerals International from Golden Gate Capital. This acquisition broadens Huber’s portfolio of mineral-based feed additives, including natural clay minerals used in livestock feed formulations as anti-caking and flow agents. The transaction enhances Huber’s presence in the United States.
- January 2024: Phibro Animal Health Corporation completed a USD 350 million acquisition of Zoetis' Manufacturing and Feed Additives (MFA) portfolio, significantly expanding production capacity and product range in feed additive manufacturing and mineral supplementation solutions.


United States Feed Minerals Market Report Scope
| Macrominerals |
| Microminerals |
| Aquaculture | Fish |
| Shrimp | |
| Other Aquaculture Species | |
| Poultry | Broiler |
| Layer | |
| Other Poultry Birds | |
| Ruminants | Beef Cattle |
| Dairy Cattle | |
| Other Ruminants | |
| Swine | |
| Other Animals |
| Sub Additive | Macrominerals | |
| Microminerals | ||
| Animal | Aquaculture | Fish |
| Shrimp | ||
| Other Aquaculture Species | ||
| Poultry | Broiler | |
| Layer | ||
| Other Poultry Birds | ||
| Ruminants | Beef Cattle | |
| Dairy Cattle | ||
| Other Ruminants | ||
| Swine | ||
| Other Animals | ||


Market Definition
- FUNCTIONS - For the study, feed additives are considered to be commercially manufactured products that are used to enhance characteristics such as weight gain, feed conversion ratio, and feed intake when fed in appropriate proportions.
- RESELLERS - Companies engaged in reselling feed additives without value addition have been excluded from the market scope, to avoid double counting.
- END CONSUMERS - Compound feed manufacturers are considered to be end-consumers in the market studied. The scope excludes farmers buying feed additives to be used directly as supplements or premixes.
- INTERNAL COMPANY CONSUMPTION - Companies engaged in the production of compound feed as well as the manufacturing of feed additives are part of the study. However, while estimating the market sizes, the internal consumption of feed additives by such companies has been excluded.
| Keyword | Definition |
|---|---|
| Feed additives | Feed additives are products used in animal nutrition for purposes of improving the quality of feed and the quality of food from animal origin, or to improve the animals’ performance and health. |
| Probiotics | Probiotics are microorganisms introduced into the body for their beneficial qualities. (It maintains or restores beneficial bacteria to the gut). |
| Antibiotics | Antibiotic is a drug that is specifically used to inhibit the growth of bacteria. |
| Prebiotics | A non-digestible food ingredient that promotes the growth of beneficial microorganisms in the intestines. |
| Antioxidants | Antioxidants are compounds that inhibit oxidation, a chemical reaction that produces free radicals. |
| Phytogenics | Phytogenics are a group of natural and non-antibiotic growth promoters derived from herbs, spices, essential oils, and oleoresins. |
| Vitamins | Vitamins are organic compounds, which are required for normal growth and maintenance of the body. |
| Metabolism | A chemical process that occurs within a living organism in order to maintain life. |
| Amino acids | Amino acids are the building blocks of proteins and play an important role in metabolic pathways. |
| Enzymes | Enzyme is a substance that acts as a catalyst to bring about a specific biochemical reaction. |
| Anti-microbial resistance | The ability of a microorganism to resist the effects of an antimicrobial agent. |
| Anti-microbial | Destroying or inhibiting the growth of microorganisms. |
| Osmotic balance | It is a process of maintaining salt and water balance across membranes within the body's fluids. |
| Bacteriocin | Bacteriocins are the toxins produced by bacteria to inhibit the growth of similar or closely related bacterial strains. |
| Biohydrogenation | It is a process that occurs in the rumen of an animal in which bacteria convert unsaturated fatty acids (USFA) to saturated fatty acids (SFA). |
| Oxidative rancidity | It is a reaction of fatty acids with oxygen, which generally causes unpleasant odors in animals. To prevent these, antioxidants were added. |
| Mycotoxicosis | Any condition or disease caused by fungal toxins, mainly due to contamination of animal feed with mycotoxins. |
| Mycotoxins | Mycotoxins are toxin compounds that are naturally produced by certain types of molds (fungi). |
| Feed Probiotics | Microbial feed supplements positively affect gastrointestinal microbial balance. |
| Probiotic yeast | Feed yeast (single-cell fungi) and other fungi used as probiotics. |
| Feed enzymes | They are used to supplement digestive enzymes in an animal’s stomach to break down food. Enzymes also ensure that meat and egg production is improved. |
| Mycotoxin detoxifiers | They are used to prevent fungal growth and to stop any harmful mold from being absorbed in the gut and blood. |
| Feed antibiotics | They are used both for the prevention and treatment of diseases but also for rapid growth and development. |
| Feed antioxidants | They are used to protect the deterioration of other feed nutrients in the feed such as fats, vitamins, pigments, and flavoring agents, thus providing nutrient security to the animals. |
| Feed phytogenics | Phytogenics are natural substances, added to livestock feed to promote growth, aid in digestion, and act as anti-microbial agents. |
| Feed vitamins | They are used to maintain the normal physiological function and normal growth and development of animals. |
| Feed flavors and sweetners | These flavors and sweeteners help to mask tastes and odors during changes in additives or medications and make them ideal for animal diets undergoing transition. |
| Feed acidifiers | Animal feed acidifiers are organic acids incorporated into the feed for nutritional or preservative purposes. Acidifiers enhance congestion and microbiological balance in the alimentary and digestive tracts of livestock. |
| Feed minerals | Feed minerals play an important role in the regular dietary requirements of animal feed. |
| Feed binders | Feed binders are the binding agents used in the manufacture of safe animal feed products. It enhances the taste of food and prolongs the storage period of the feed. |
| Key Terms | Abbreviation |
| LSDV | Lumpy Skin Disease Virus |
| ASF | African Swine Fever |
| GPA | Growth Promoter Antibiotics |
| NSP | Non-Starch Polysaccharides |
| PUFA | Polyunsaturated Fatty Acid |
| Afs | Aflatoxins |
| AGP | Antibiotic Growth Promoters |
| FAO | The Food And Agriculture Organization of the United Nations |
| USDA | The United States Department of Agriculture |


Research Methodology
Mordor Intelligence follows a four-step methodology in all our reports.
- Step-1: IDENTIFY KEY VARIABLES: In order to build a robust forecasting methodology, the variables and factors identified in Step-1 are tested against available historical market numbers. Through an iterative process, the variables required for market forecast are set and the model is built on the basis of these variables.
- Step-2: Build a Market Model: Market-size estimations for the forecast years are in nominal terms. Inflation is not a part of the pricing, and the average selling price (ASP) is kept constant throughout the forecast period.
- Step-3: Validate and Finalize: In this important step, all market numbers, variables and analyst calls are validated through an extensive network of primary research experts from the market studied. The respondents are selected across levels and functions to generate a holistic picture of the market studied.
- Step-4: Research Outputs: Syndicated Reports, Custom Consulting Assignments, Databases & Subscription Platforms


