
United States Farm Implements Market Size and Share
Market Overview
| Study Period | 2021 - 2031 |
|---|---|
| Forecast Data Period | 2026 - 2031 |
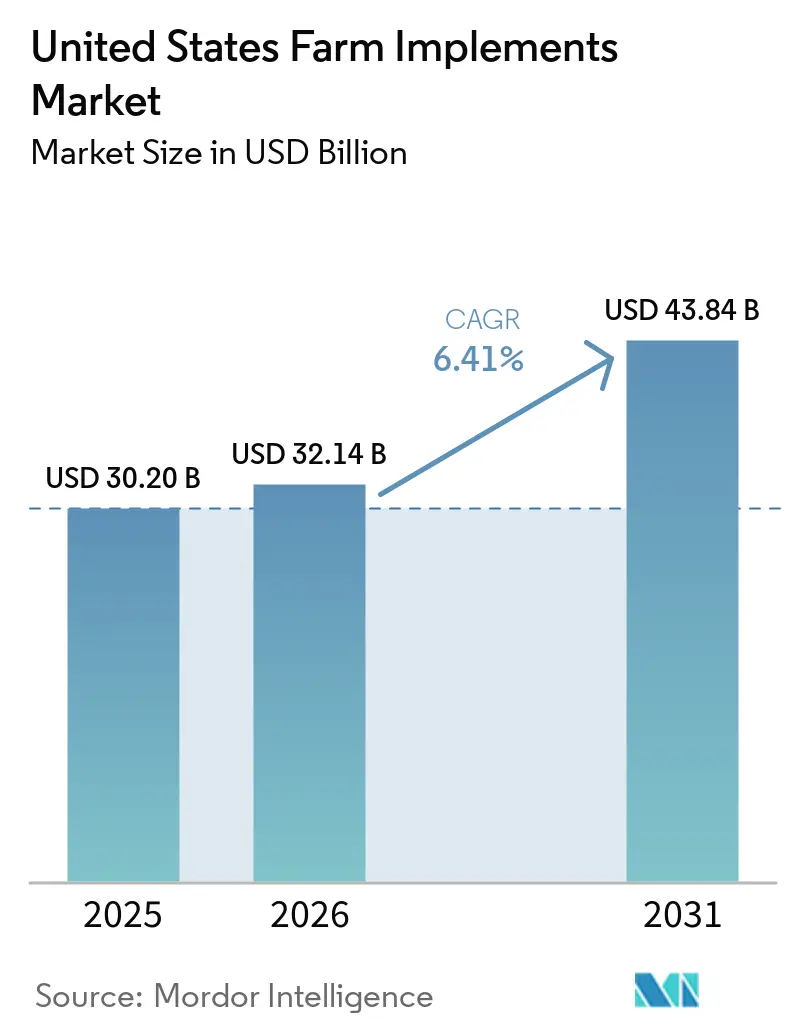
| Base Year Market Size (2025) | USD 30.20 Billion |
| Market Size (2026) | USD 32.14 Billion |
| Market Size (2031) | USD 43.84 Billion |
| Growth Rate (2026 - 2031) | 6.41 % |
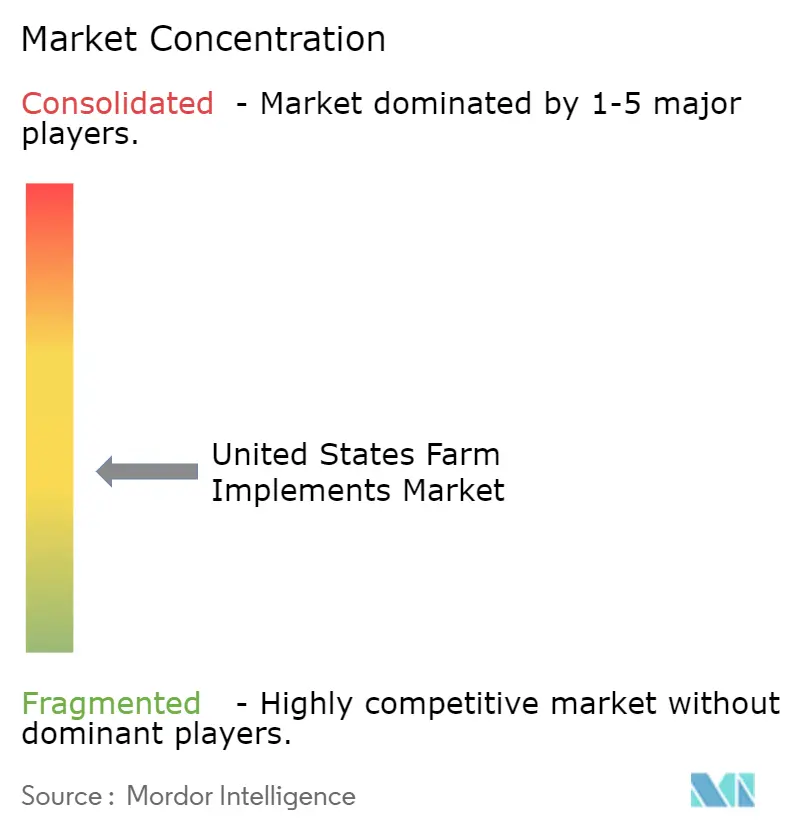
| Market Concentration | Medium |
Major Players
*Disclaimer: Major Players sorted in no particular order Image © Mordor Intelligence. Reuse requires attribution under CC BY 4.0. |
|
United States Farm Implements Market Analysis by Mordor Intelligence
The United States farm implements market was valued at USD 30.20 billion in 2025 and is projected to grow from USD 32.14 billion in 2026 to USD 43.84 billion by 2031, at a CAGR of 6.41% during the forecast period from 2026 to 2031. Market growth is supported by the adoption of precision agriculture technologies, increasing equipment automation, and demand for machinery that improves field productivity and input-use efficiency. Connected equipment, remote diagnostics, and other digital capabilities are expanding the functionality of agricultural machinery and supporting the modernization of supporting equipment. However, high equipment costs and pressure on farm capital expenditure can influence purchasing and replacement decisions.
Key Report Takeaways
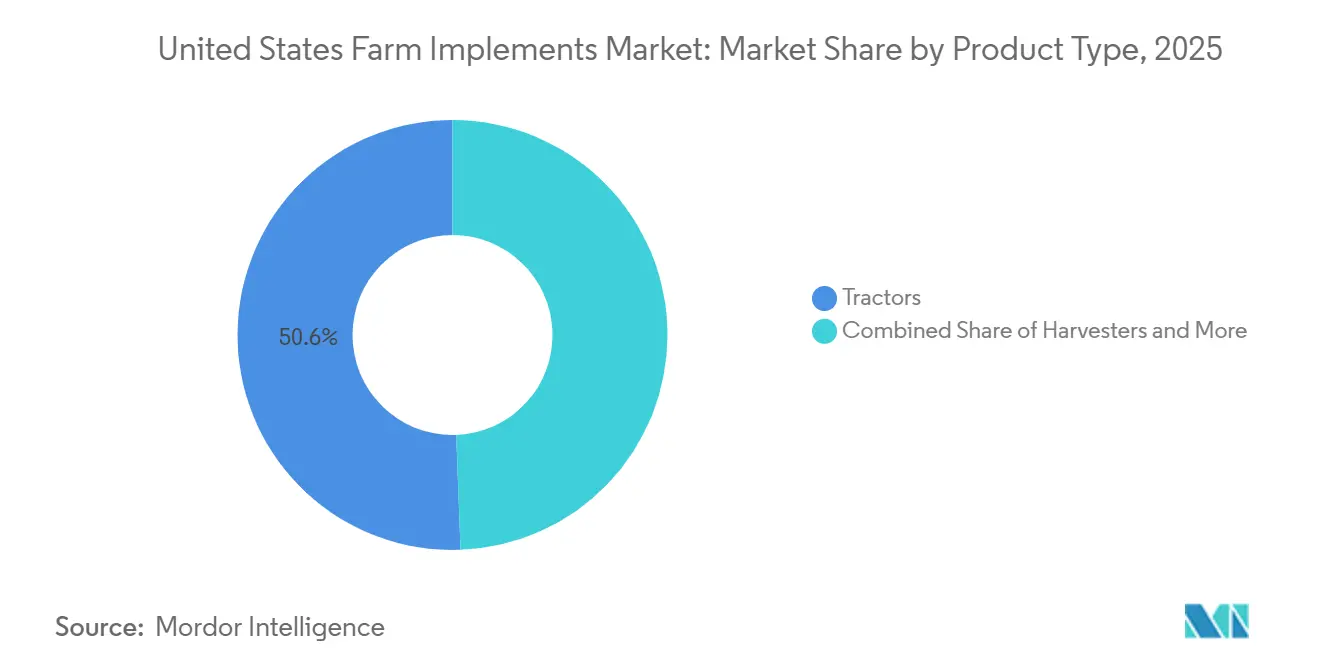
- By product type, tractors accounted for the largest 50.6% of the United States farm implements market share in 2025, while irrigation and crop-protection implements are projected to grow at the fastest CAGR of 9.3% from 2026 to 2031.
- By mode of operation, powered implements held the largest share at 78.0% in 2025 and are projected to grow at the fastest CAGR of 7.4% from 2026 to 2031.
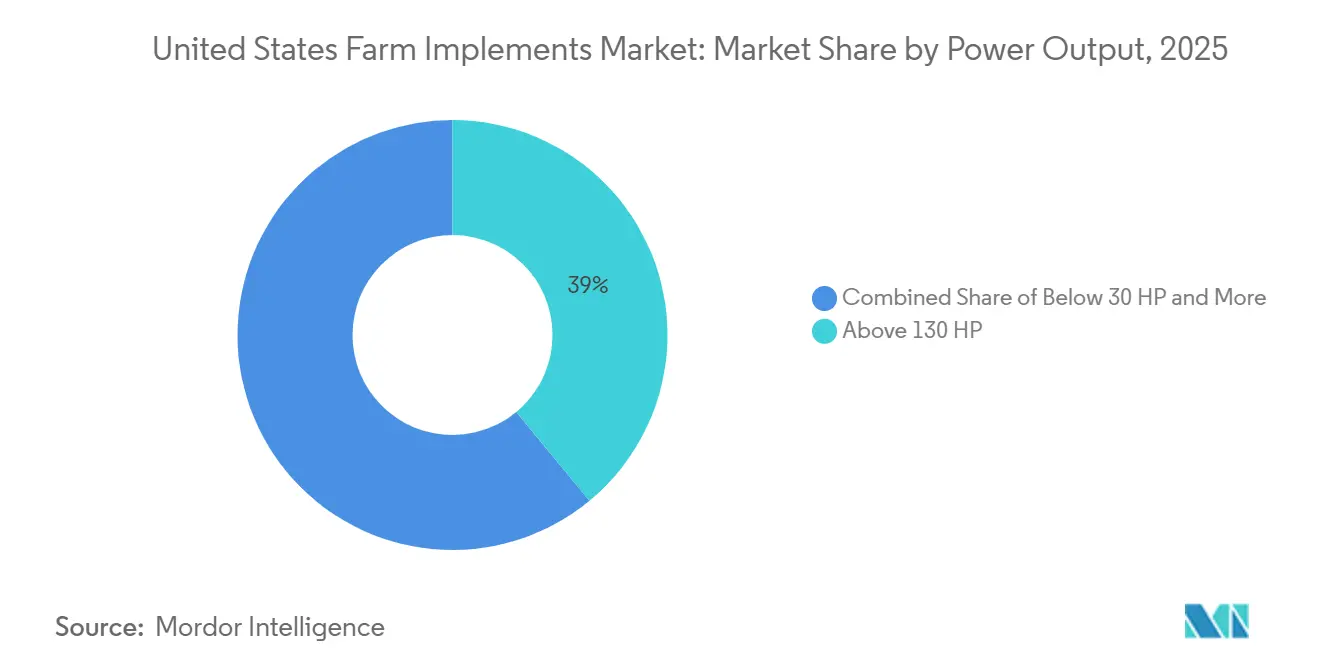
- By power output, above 130 HP accounted for the largest share at 39.0% in 2025, while the United States farm implements market size for below 30 HP is projected to grow at the fastest CAGR of 7.8% from 2026 to 2031.
Note: Market size and forecast figures in this report are generated using Mordor Intelligence’s proprietary estimation framework, updated with the latest available data and insights as of January 2026.
United States Farm Implements Market Trends and Insights
Drivers Impact Analysis*
| Driver | (~) % Impact on CAGR Forecast | Geographic Relevance | Impact Timeline |
|---|---|---|---|
| Precision Farming Retrofit Adoption Across Existing Fleets | +1.6% | National, with concentration in the Corn Belt and Great Plains | Medium term (2-4 years) |
| Original Equipment Manufacturer Electrification and Low-Horsepower Product Refresh Cycles | +1.2% | National, with early gains in California and the Northeast | Medium term (2-4 years) |
| Telematics-Led Predictive Maintenance and Uptime Guarantees | +1% | National, with activity in the Corn Belt and Pacific Northwest | Medium term (2-4 years) |
| Climate-Smart Program Funding for Water and Input Efficiency | +0.8% | National, with concentration in Western states and the Great Plains | Short term (≤ 2 years) |
| Bespoke Leasing and Subscription Models for Cash-Strapped Farms | +0.7% | National, Midwest, and South | Short term (≤ 2 years) |
| Specialty Crop Robotics Adoption in Orchards, Vineyards, and Nursery Operations | +0.6% | West Coast, Pacific Northwest, and Southeast | Long term (≥ 4 years) |
| Source: Mordor Intelligence | |||
Precision Farming Retrofit Adoption Across Existing Fleets
High upfront costs associated with precision agriculture technologies are driving demand for retrofit solutions that add advanced capabilities to existing farm machinery. The United States Government Accountability Office reported in January 2024 that precision agriculture technologies, including GPS, automation, and variable-rate systems, can improve resource management and farm profitability, although high upfront acquisition costs remain a significant barrier to adoption. Equipment manufacturers are responding with retrofit technologies that enable farmers to add guidance, connectivity, automation, and precision application capabilities to tractors, planters, sprayers, combines, and other existing equipment. John Deere offers Precision Upgrades for machinery already owned by farmers, while AGCO's PTx portfolio provides retrofit solutions across mixed-brand fleets. These solutions allow producers to modernize existing equipment without replacing entire machines, supporting demand for precision-enabled farm implements and aftermarket technology upgrades.
Original Equipment Manufacturer Electrification and Low-Horsepower Product Refresh Cycles
Original equipment manufacturers are accelerating electrification and product refresh cycles in compact agricultural equipment, creating new growth opportunities in the United States farm implements market. In Fiscal Year 2025, the United States Department of Agriculture announced that the Rural Energy for America Program provides 80% of loan guarantees for eligible renewable energy and energy-efficiency improvement projects, reducing financing barriers for advanced agricultural technologies [1]Source: United States Department of Agriculture, Rural Development, "Rural Energy for America Program Renewable Energy Systems and Energy Efficiency Improvement Guaranteed Loans," rd.usda.gov.. This policy environment encourages investment in electrically powered and energy-efficient farm equipment. As a result, manufacturers are expanding low-horsepower electric platforms and compatible implements, enabling farmers to improve operational efficiency, modernize equipment, and advance sustainable agricultural practices.
Telematics-Led Predictive Maintenance and Uptime Guarantees
Growing demand for connected equipment is accelerating the adoption of telematics-enabled maintenance solutions across the United States farm implements market. According to John Deere's 2024 Sustainability Data Book, the company has set a target to connect 1.5 million machines by 2026, reflecting its continued investment in digital agriculture and connected equipment technologies[2]Source: John Deere, "2024 Sustainability Data Book," deere.com.. This expanding telematics ecosystem enables real-time equipment monitoring, predictive maintenance, and remote diagnostics, allowing dealers to identify potential issues before failures occur and minimize unplanned downtime during critical farming operations. As a result, manufacturers are strengthening uptime guarantee programs and digital service capabilities, improving equipment reliability, operational efficiency, and customer value across the United States farm implements market.
Climate-Smart Program Funding for Water and Input Efficiency
Federal conservation funding is supporting investment in agricultural equipment and technologies that improve water and input-use efficiency in the United States. The United States Department of Agriculture's Environmental Quality Incentives Program provides financial and technical assistance to agricultural producers implementing conservation practices, including irrigation water management and improvements to irrigation systems. USDA conservation programs also support precision nutrient-management practices that help producers apply fertilizers and other inputs more efficiently. These incentives can reduce some of the costs associated with adopting precision irrigation, nutrient application, and related field equipment, thereby supporting demand for farm implements that enable more efficient use of water and agricultural inputs.
Restraints Impact Analysis*
| Restraint | (~) % Impact on CAGR Forecast | Geographic Relevance | Impact Timeline |
|---|---|---|---|
| Commodity Price Weakness Delaying Replacement Cycles | -1.8% | National, with the greatest effect in the Corn Belt and Great Plains | Short term (≤ 2 years) |
| Dealer Technician Shortages Slowing Equipment Service Capacity | -0.9% | National, most acute in the rural Midwest and Southeast | Medium term (2-4 years) |
| Rural Connectivity Gaps Limiting Connected Implement Adoption | -0.6% | Rural Midwest, Great Plains, and South | Medium term (2-4 years) |
| Emissions Compliance Lead Times and Supply Disruptions | -0.5% | National, mainly equipment with engines above 56 kilowatts (kW) | Long term (≥ 4 years) |
| Source: Mordor Intelligence | |||
Commodity Price Weakness Delaying Replacement Cycles
Weak commodity prices and declining farm profitability are prompting producers to postpone purchases of new agricultural equipment, limiting growth in the United States farm implements market. According to the United States Department of Agriculture, Economic Research Service, farm cash receipts are forecast to reach USD 514.7 billion in 2026, a decline of USD 14.2 billion from 2025, primarily due to lower livestock and animal product receipts[3]Source: United States Department of Agriculture, Economic Research Service, "2026 Farm Sector Income Forecast," ers.usda.gov.. Reduced farm revenues are constraining capital spending, prompting growers to extend the operating life of existing machinery rather than invest in new implements. As a result, replacement cycles are lengthening, slowing equipment demand and creating pricing pressure across the market.
Dealer Technician Shortages Slowing Equipment Service Capacity
A shortage of qualified agricultural service technicians continues to constrain equipment maintenance capacity, limiting growth in the United States farm implements market. According to Farmdoc Daily (2026), states with the highest service capacity had only approximately 3 to 7 farm equipment service technicians per 100 farms, highlighting the limited availability of skilled labor needed to maintain increasingly sophisticated agricultural machinery. As farm implements become more reliant on precision technologies, sensors, telematics, and software, insufficient technical support can delay repairs and extend equipment downtime. As a result, reduced service capacity may discourage equipment purchases and slow market expansion, particularly during critical planting and harvesting seasons.
*Our forecasts treat driver/restraint impacts as directional, not additive. The impact forecasts reflect baseline growth, mix effects, and variable interactions.
Segment Analysis
By Product Type: Tractors Anchor Revenue, Irrigation Implements Drive Growth
Tractors accounted for the largest share of the United States farm implements market at 50.6% in 2025. This reflects their role as the primary power source for tillage, planting, seeding, material handling, and specialty crop operations across diverse farming systems. Large tractors remain essential for high-acreage row-crop production, while compact models support orchards, vineyards, and livestock farms. Manufacturers continue introducing advanced platforms featuring precision guidance, connectivity, and electrified implement capabilities to improve field efficiency. Harvesters also represent an important product category, supporting mechanized harvesting across major grain and specialty crop production regions.
Irrigation and crop-protection implements are projected to grow at the fastest CAGR, 9.3%, from 2026 to 2031. Rising water conservation requirements, precision input management, and increasing adoption of automated application technologies continue to support demand across major agricultural regions. Precision irrigation systems integrate soil moisture monitoring, variable-rate application, and automated controls to improve water-use efficiency while reducing operating costs. Precision sprayers and autonomous field equipment are also gaining commercial acceptance as producers prioritize labor efficiency and sustainable crop management. Soil preparation, planting, seeding, haying, and forage implements remain essential as they serve recurring seasonal farming operations.



By Mode of Operation: Powered Implements Capture Both Volume and Growth
Powered implements held the largest share of 78.0% in 2025 and are projected to grow at the fastest CAGR of 7.4% from 2026 to 2031. This dominance reflects the increasing adoption of equipment with hydraulic, electric, and electronically controlled systems that improve field productivity and application accuracy. Powered implements support precision planting, spraying, fertilizing, harvesting, and material handling across large commercial farms. Integration with guidance technologies, telematics, automation, and variable-rate application systems allows producers to optimize input use, reduce labor requirements, and improve operational efficiency across diverse cropping systems.
Unpowered implements continue to play an important role in small and medium-sized farming operations where affordability and operational simplicity are key purchasing considerations. Conventional tillage tools, mechanical planters, cultivators, and nonpowered applicators are widely used for routine field activities that require limited automation. Their straightforward design reduces maintenance requirements and allows operators to perform repairs using readily available components, making them suitable for cost-conscious producers. Ongoing improvements in structural durability, material quality, and implement compatibility continue to enhance field performance, keeping unpowered equipment relevant alongside increasingly sophisticated powered agricultural systems.
By Power Output: Above 130 HP Leads, Below 30 HP Gains Momentum
The above 130 HP segment accounted for the largest at 39.0% in 2025. High-horsepower equipment is widely used on large commercial farms producing corn, soybeans, wheat, and cotton, where greater pulling capacity and field productivity are essential. These machines efficiently operate wide tillage tools, high-capacity planters, air seeders, and precision application equipment, reducing field passes and labor requirements. Manufacturers continue to integrate advanced hydraulic systems, telematics, automation, and precision guidance technologies, enabling operators to improve efficiency across large-scale farming operations.
The United States farm implements market size for the below 30 HP segment is projected to grow at the fastest CAGR of 7.8% from 2026 to 2031. Demand is increasing as small farms, orchards, vineyards, livestock operations, and hobby farms invest in compact and versatile equipment suited for confined working environments. These machines offer lower fuel consumption, reduced maintenance costs, and compatibility with a wide range of light-duty implements, making them an economical choice for diversified farming activities. Manufacturers continue to expand compact equipment portfolios with improved operator comfort, hydrostatic transmissions, and digital connectivity, supporting adoption across small-scale agricultural operations.
Geography Analysis
The Midwest dominated the United States farm implements market in 2025, driven by extensive production of corn, soybeans, and wheat across states such as Iowa, Illinois, Nebraska, Minnesota, and Indiana. Large commercial farms in the region generate strong demand for high-capacity tractors, planters, tillage equipment, and precision application implements to improve field productivity and operational efficiency. The region also benefits from well-established farm equipment dealerships, high levels of mechanization, and widespread adoption of precision agriculture technologies, which support continuous investment in advanced agricultural machinery.
The Southern United States represents another major market, supported by diversified agricultural production including cotton, rice, peanuts, sugarcane, poultry, and livestock. States such as Texas, Arkansas, Georgia, Mississippi, and Louisiana require a broad range of specialized implements suited to regional cropping systems and large farming operations. Growing adoption of precision planting, spraying, and harvesting technologies, along with replacement demand for aging machinery and expanding commercial farming activities, continues to support equipment sales throughout the region.
California, Washington, Oregon, and Arizona continue to drive investment in advanced farm implements due to their concentration of high-value specialty crop production and increasing mechanization needs. According to the United States Department of Agriculture (USDA) National Agricultural Statistics Service, California generated USD 63.8 billion in agricultural cash receipts in 2025, maintaining its position as the nation's top agricultural state. Rising labor shortages, adoption of precision irrigation, and expansion of orchard, vineyard, fruit, and vegetable production are encouraging growers to invest in compact tractors, precision sprayers, automated harvesting equipment, and other specialized implements, strengthening demand for advanced agricultural machinery across the western United States.
Competitive Landscape
The United States farm implements market is moderately fragmented in 2025. Key manufacturers include Deere and Company, CNH Industrial N.V., AGCO Corporation, Kubota Corporation, and Mahindra and Mahindra Limited, which compete alongside numerous regional manufacturers and specialized equipment providers. These companies maintain their market positions through extensive dealer networks, broad product portfolios, precision agriculture technologies, and continuous investments in research and development to improve equipment efficiency, automation, and digital farming capabilities.
Competition is increasingly focused on technological innovation, smart farming solutions, and sustainable equipment development. Manufacturers are integrating GPS guidance, telematics, autonomous operation, artificial intelligence, and precision application technologies into tractors and farm implements to improve productivity while reducing labor and input costs. Strategic partnerships, manufacturing expansion, product launches, and aftermarket service enhancements are also key competitive strategies used to strengthen customer retention and expand market presence across the United States.
Recent product innovations continue to intensify competition across the United States farm implements market. For instance, Deere and Company unveiled its second-generation autonomous technology platform and new autonomous agricultural machines at CES 2025, including the Autonomous 9RX tractor and 5ML orchard tractor, designed to address labor shortages and improve precision farming operations. Such developments reflect the industry's growing emphasis on automation, artificial intelligence, and precision agriculture, prompting competitors to accelerate investments in next-generation farm implements and digital farming solutions.
United States Farm Implements Industry Leaders
-
Deere and Company
-
CNH Industrial N.V.
-
AGCO Corporation
-
Kubota Corporation
-
Mahindra & Mahindra Limited
- *Disclaimer: Major Players sorted in no particular order

Recent Industry Developments
- February 2026: Deere and Company launched six new 8R and 8RX tractors featuring Electric Variable Transmission (EVT) and autonomous-ready technology, expanding its high-horsepower and precision farming equipment portfolio for the United States agricultural market.
- January 2026: Kubota Corporation unveiled the commercial-ready autonomous M5 Narrow tractor, developed with Agtonomy, at CES 2026, expanding autonomous farm implement solutions for orchard and vineyard operations across the United States.
- August 2025: CNH Industrial N.V. launched the Case IH Steiger 785 Quadtrac, the brand's highest-horsepower tractor, alongside new precision agriculture technologies at the Farm Progress Show in Illinois.


United States Farm Implements Market Report Scope
Farm implements are agricultural machines, equipment, and attachments used to perform field operations such as land preparation, planting, seeding, fertilizing, irrigation, crop protection, harvesting, and hay and forage operations.
The United States farm implements market report is segmented by product type (tractors, harvesters, soil preparation and cultivation equipment, planting, seeding, and fertilizing equipment, irrigation and crop-protection implements, precision and autonomous implements, haying and forage equipment, and other implements), by mode of operation (powered implements and unpowered implements), and by power output (below 30 HP, 31–70 HP, 71–130 HP, and above 130 HP). The market forecasts are provided in terms of value (USD).
| Tractors |
| Harvesters |
| Soil Preparation and Cultivation Equipment |
| Planting, Seeding, and Fertilizing Equipment |
| Irrigation and Crop-Protection Implements |
| Precision and Autonomous Implements |
| Haying and Forage Equipment |
| Other Implements |
| Powered Implements |
| Unpowered Implements |
| Below 30 HP |
| 31–70 HP |
| 71–130 HP |
| Above 130 HP |
| By Product Type | Tractors |
| Harvesters | |
| Soil Preparation and Cultivation Equipment | |
| Planting, Seeding, and Fertilizing Equipment | |
| Irrigation and Crop-Protection Implements | |
| Precision and Autonomous Implements | |
| Haying and Forage Equipment | |
| Other Implements | |
| By Mode of Operation | Powered Implements |
| Unpowered Implements | |
| By Power Output | Below 30 HP |
| 31–70 HP | |
| 71–130 HP | |
| Above 130 HP |


Key Questions Answered in the Report
What is the market size for the United States farm implements market in 2026 and how much it is forecasted to grow in 2031?
The market is projected to grow from USD 32.14 billion in 2026 to USD 43.84 billion by 2031, at a 6.41% CAGR from 2026 to 2031.
Which product category leads farm implement demand in the United States?
Tractors led with 50.6% share in 2025 because they support core activities such as tillage, seeding, and material handling.
Which product type farm implement category is growing fastest?
Irrigation and crop-protection implements are forecast to grow at a 9.3% CAGR from 2026 to 2031, supported by water management needs and conservation incentives.
What is limiting adoption of connected farm equipment?
Technician shortages and uneven rural broadband access can delay service and restrict real-time use of telematics and variable-rate systems.
Page last updated on:


 Your data is secure and never sold or shared.


