Market Overview
| Study Period | 2019 - 2030 |
| Base Year For Estimation | 2024 |
| Forecast Data Period | 2025 - 2030 |
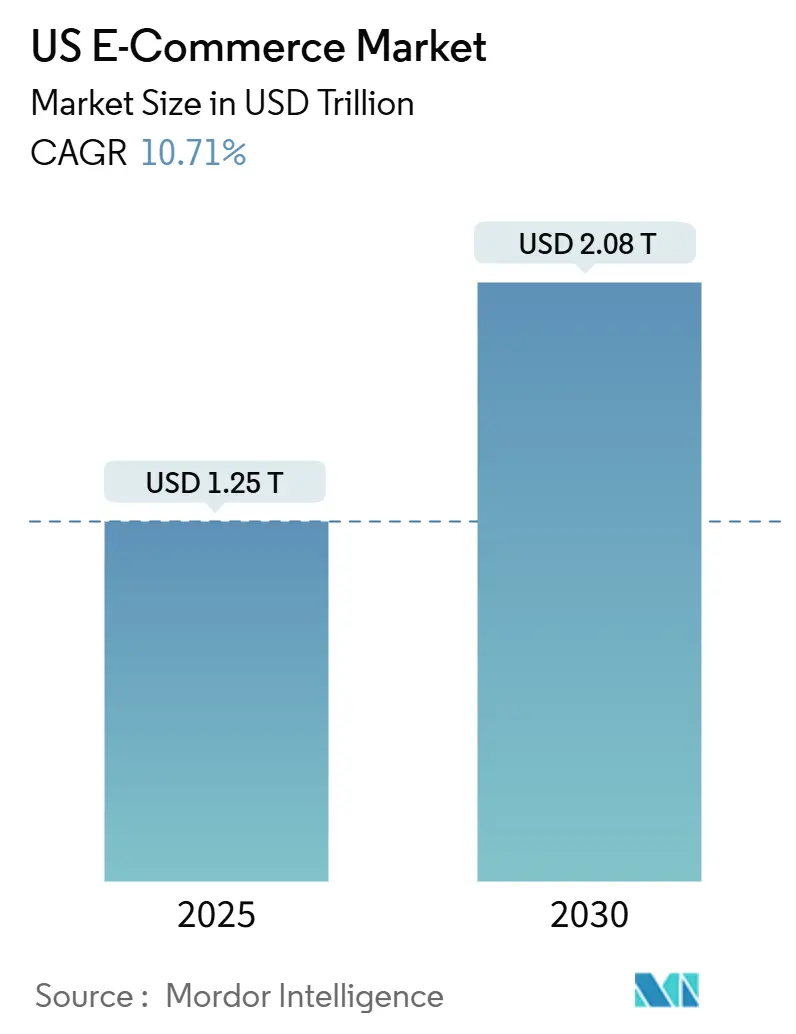
| Market Size (2025) | USD 1.25 Trillion |
| Market Size (2030) | USD 2.08 Trillion |
| Growth Rate (2025 - 2030) | 10.71% CAGR |
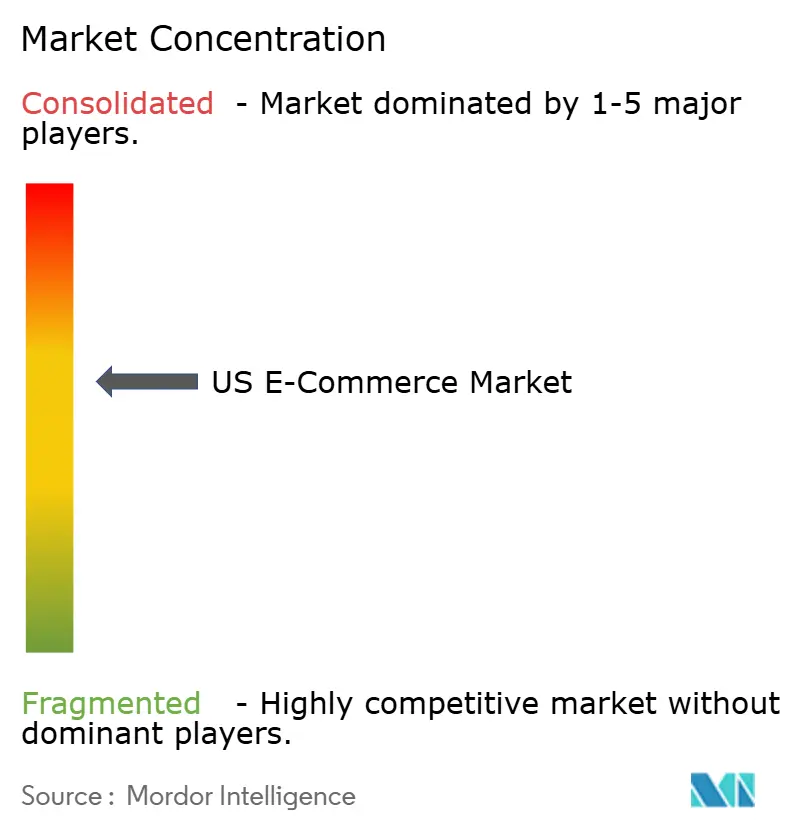
| Market Concentration | Medium |
Major Players*Disclaimer: Major Players sorted in no particular order Image © Mordor Intelligence. Reuse requires attribution under CC BY 4.0. |
|
US E-Commerce Market Analysis by Mordor Intelligence
The US ecommerce market stands at USD 1.25 trillion in 2025 and is forecast to reach USD 2.08 trillion by 2030, equivalent to a 10.71% CAGR over the period. Robust spending on digital channels, continuous gains in mobile commerce, and deeper integration of embedded finance offset the tapering of pandemic-era tailwinds. Mobile now drives the majority of online checkouts and acts as a catalyst for same-day service expectations, while generative AI lifts conversion by reducing the friction between search intent and product discovery. Category growth remains uneven: consumer electronics retains the largest revenue base, but online grocery and food delivery accelerate fastest as retailers deploy micro-fulfilment centres. Regulatory shifts, including tighter de minimis rules on cross-border parcels, push merchants to re-engineer supply chains yet also open white space for domestic third-party logistics platforms. Competitive intensity rises as Walmart, Shein, and Temu chip away at Amazon’s leadership, and as B2B marketplaces draw manufacturers directly into the digital arena.
Key Report Takeaways
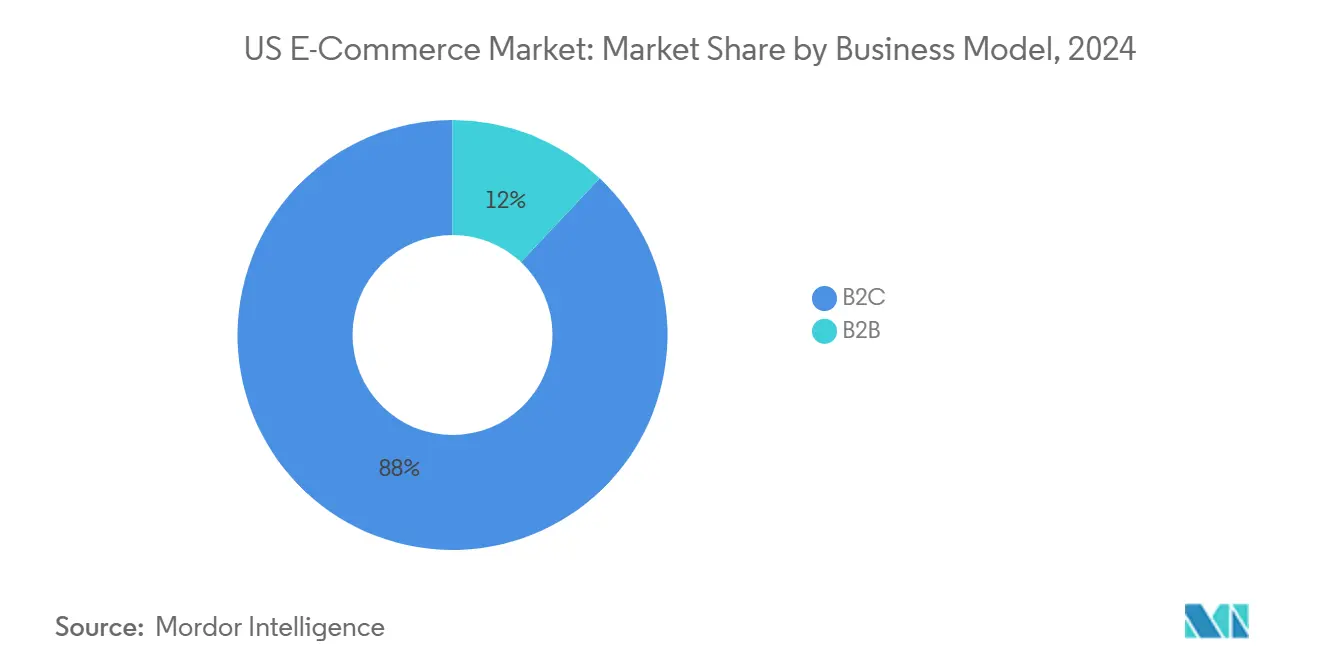
- By business model, the B2C segment held 88% of the US ecommerce market in 2024, while B2B is advancing at a 12.8% CAGR through 2030.
- By device type, smartphones commanded 72% share of US ecommerce transactions in 2024 and are projected to grow at a 12.1% CAGR to 2030.
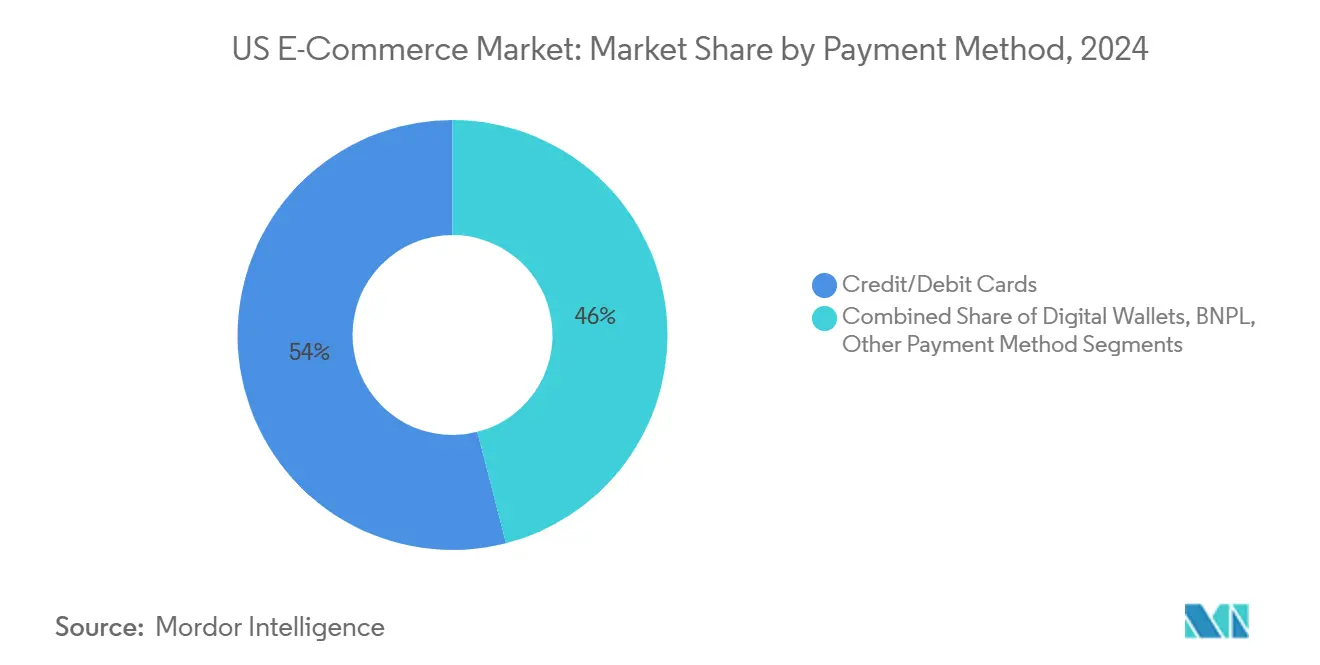
- By payment method, credit and debit cards accounted for 54% of transactions in 2024, whereas BNPL solutions are forecast to rise at an 18.3% CAGR over 2025-2030.
- By B2C product category, consumer electronics led with 25% of US ecommerce market share in 2024, while food & beverages is projected to expand at a 15.2% CAGR through 2030.
US E-Commerce Market Trends and Insights
Drivers Impact Analysis
| Driver | (~) % Impact on CAGR Forecast | Geographic Relevance | Impact Timeline |
|---|---|---|---|
| Rapid Adoption of Same-Day & Instant Delivery Models in US Metros | +2.1% | Major US metropolitan areas, with concentration in Northeast and West Coast | Medium term (2-4 years) |
| Online Grocery Penetration Post-COVID via Micro-Fulfilment Investments | +1.8% | National, with higher impact in urban and suburban areas | Medium term (2-4 years) |
| BNPL & Embedded Finance Boosting High-Ticket Conversions | +1.5% | National, with higher adoption among younger demographics | Short term (≤ 2 years) |
| Cross-Border Demand for US DTC Brands via Section 321 De-Minimis | +0.9% | Global, with concentration in Canada, Mexico, and EU markets | Short term (≤ 2 years) |
| SMB Marketplace Adoption Transitioning from Wholesale to DTC | +1.3% | National, with higher impact in specialty retail categories | Medium term (2-4 years) |
| Generative-AI Product Discovery Enhancing Conversion Rates | +1.6% | National, with early adoption by large retailers | Medium term (2-4 years) |
Source: Mordor Intelligence
Rapid Adoption of Same-Day and Instant Delivery Models in US Metros
Retailers in New York, Los Angeles, and other high-density markets are rolling out micro-fulfilment centres that cut order processing times by up to 90% and reduce the final-mile distance traveled.[1]CubeWork, “Micro-Fulfillment Centers: Transforming the Future of E-Commerce,” cubework.com Same-day options drive an 18% uplift in checkout conversion, prompting merchants to publicise delivery speed as prominently as price. Although 90% of shoppers still accept two-day service when fees fall, the ability to offer a calibrated mix of speed and cost is emerging as a differentiator. Major grocery chains emulate Amazon’s local hub network by co-locating dark stores near urban demand pockets, shrinking fulfilment radii from 12 miles to less than five. Investments ramp from pilot stage to chain-wide roll-outs between 2025 and 2027, firmly embedding instant delivery expectations into the US ecommerce market.
Online Grocery Penetration Post-COVID via Micro-Fulfilment Investments
Digital grocery sales rose 4.2% in 2024 and are on track to climb 9.7% in 2025, propelled by automation that raises pick accuracy and slashes perishables waste.[2]Grocery Doppio, “5 Investment Trends Driving Digital Grocery Growth in 2025,” grocerydoppio.com Retailers such as Walmart and Albertsons run compact, 10,000–20,000 sq ft automated sites capable of processing online orders ten times faster than legacy store-based picking. Seventy-two percent of grocers plan new platform investments in 2025 to tackle USD 7.4 billion in annual lost sales from out-of-stocks, tying fulfilment efficiency directly to topline growth. AI forecasting aligned with micro-fulfilment improves inventory turns and frees store staff for value-added tasks. Stronger urban adoption anchors the near-term impact, yet suburban expansion is pencilled in for 2026-2027 as cost curves fall.
BNPL and Embedded Finance Boosting High-Ticket Conversions
The US BNPL transaction value is projected at USD 532.9 billion in 2024, rising swiftly on 40% compound growth. Retailers report 20% lifts in average order value when BNPL is displayed alongside card options.[3]PayPal, “How BNPL Is Changing E-Commerce,” paypal.com Penetration extends beyond Gen Z and millennials into middle-income households, making flexible instalments a mainstream expectation. Fintech partners bundle instalments with merchant-branded wallets, embedding finance deeper into the shopper journey and projecting USD 230 billion in new revenue streams by 2025. The strategic focus moves from simply offering BNPL at checkout to orchestrating post-purchase engagement, repayment reminders, and loyalty integration for better customer lifetime value.
Generative-AI Product Discovery Enhancing Conversion Rates
Some 44% of online shoppers spend at least three minutes locating desired items, underscoring the friction inherent in keyword-based search. Generative AI models bridge language gaps, interpret colloquial queries, and surface relevant SKUs within milliseconds, lifting overall satisfaction by 20%. Retail pilots demonstrate 15% conversion gains and 11% growth in average order values once AI-driven recommendations replace static “related products” carousels. Early adopters embed conversational search boxes that mimic in-store associate dialogue, capturing context such as colour preference, price range, and sustainability criteria. Sixty-two percent of consumers say they are more likely to buy when AI guides their journey, with acceptance reaching 68% among millennials.
Restraints Impact Analysis
| Restraint | (~) % Impact on CAGR Forecast | Geographic Relevance | Impact Timeline |
|---|---|---|---|
| Last-Mile Delivery Cost Inflation and Carrier Surcharges | -1.2% | National, with higher impact in rural areas | Short term (≤ 2 years) |
| State-Level Data-Privacy Rules Complicating Personalisation | -0.7% | States with comprehensive privacy laws (CA, VA, CO, CT, UT) | Medium term (2-4 years) |
| High Product-Return Rates Driving Reverse-Logistics Costs | -0.9% | National, with higher impact in fashion and apparel categories | Medium term (2-4 years) |
| US Antitrust Scrutiny Limiting Platform Fee Expansion | -0.5% | National, with concentration on major platforms | Long term (≥ 4 years) |
Source: Mordor Intelligence
Last-Mile Delivery Cost Inflation and Carrier Surcharges
UPS and FedEx implemented 5.9% base rate hikes for 2025, layered with oversized and remote-area fees that lift effective parcel expenses by 10-12% for small sellers. Additional handling charges jumped 26% year-over-year, and peak-season levies reach USD 99 per large parcel. This cost pressure trickles into higher retail prices or erodes margins when free shipping remains table stakes. Rural shoppers feel the greatest pinch due to limited carrier alternatives, widening the urban-rural fulfilment divide inside the US ecommerce market. Merchants experiment with regional carriers, in-store pick-up, and subscription-style paid membership to spread freight overhead across predictable revenue streams.
High Product-Return Rates Driving Reverse-Logistics Costs
Total US retail returns are forecast at USD 890 billion for 2024, equal to 16.9% of annual sales. Ecommerce sees higher return intensity at 17.3% versus 10% for in-store purchases, imposing extra handling, inspection, and restocking outlays. Fashion posts the steepest ratio at 16%, followed by DIY at 9% and electronics at 8%. Handling costs absorb 17–30% of the original order value, pushing 60% of retailers to tighten policies by adding restocking fees or shortening windows. Fraud compounds the burden: 13.7% of returns in 2023 were deemed abusive, translating to USD 101.9 billion in losses. Balancing customer loyalty with cost containment remains a pivotal challenge within the US ecommerce market.
Segment Analysis
By Business Model: B2B Digitization Accelerates Growth
The B2C stream contributed 88% of US ecommerce transactions in 2024, a share that underscores its entrenched position among consumers. Nevertheless, B2B digital commerce is projected to outpace the broader US ecommerce market, expanding at a 12.8% CAGR to 2030 as industrial buyers migrate online. This surge reflects a demographic turnover: millennials are forecast to represent 70% of professional purchasers by 2025, pushing suppliers toward intuitive, consumer-grade interfaces. Advanced analytics adoption now reaches 86% of B2B sellers, fueling personalised catalogs and real-time inventory visibility.
A platform shift underpins this growth. Marketplace participation already involves 59% of B2B buyers, redirecting spend from traditional distribution to digital self-service paths. Subscription pricing models further reinforce loyalty, with the total subscription economy inside the segment projected at USD 1.5 trillion by 2025. As a result, US ecommerce market size forecasts show B2B’s contribution moving from the periphery to a material share of online GMV, though B2C still magnifies absolute dollars due to its sheer scale.
By Device Type: Mobile Dominance Reshapes Experience Design
Smartphones generated 72% of US ecommerce checkouts in 2024 and are forecast to compound at 12.1% through 2030, cementing a mobile-first paradigm. Despite high usage, conversion on small screens trails desktop by 35.1%, leaving optimisation headroom. Native apps outperform responsive sites by 30% on conversion, encouraging retailers to shift budget from desktop upgrades to mobile features like one-tap checkout.
Daily mobile screen time averages 4.4 hours, 88% of which occurs in apps. Mobile wallets are set to handle USD 190 billion in 2024, equivalent to more than half of digital payments. Augmented reality features drive deeper engagement, with 90% of mobile shoppers open to AR try-ons. These advances improve the proportion of mobile sales inside the US ecommerce market size, closing the performance gap with desktop over the forecast horizon.
By Payment Method: BNPL Disrupts the Traditional Payment Hierarchy
Cards retained 54% share of online payments in 2024, yet BNPL claims the growth spotlight at an 18.3% CAGR through 2030. The BNPL user base reached 79 million Americans in 2023 and is poised to escalate as Gen Z adoption climbs toward 47.4% by 2025. Retailers observe tangible benefits: higher cart values and reduced abandonment once instalment options appear above the fold.
Future share gains hinge on risk scoring and regulatory clarity. Consumer Financial Protection Bureau guidance underway in 2025 encourages providers to integrate with credit bureaus, which may temper approval rates. Still, embedded BNPL woven into digital wallets keeps checkout friction low. These dynamics suggest BNPL will capture a larger slice of US ecommerce market share by value, though cards remain entrenched among affluent shoppers who seek loyalty points.
Note: Segment shares of all individual segments available upon report purchase
By B2C Product Category: Food & Beverages Lead Digital Transformation
Consumer electronics generated 25% of online revenue in 2024, keeping the crown for ticket size and upgrade frequency. However, food & beverages holds the fastest lane, expanding at 15.2% CAGR to 2030. Online penetration sits at 16.7% and is forecast to climb to 28.9% by 2029. Investments in temperature-controlled fulfilment and subscription meal kits propel repeat frequency and basket breadth.
Fashion wrestles with returns yet benefits from virtual try-on tools that chip away at fit uncertainty. Furniture and home categories gain momentum through AR visualisation, enhancing shopper confidence on bulky purchases. Toys, DIY, and media adopt personalisation algorithms to refine discovery. Collectively, these shifts rebalance category weights inside the US ecommerce market size, amplifying the role of everyday staples relative to discretionary electronics.
Geography Analysis
The United States accounts for 16% of global online sales and sits behind only China in absolute GMV. Domestic digital value creation reached USD 4.9 trillion or 18% of GDP in 2025, up from 11% in 2020. Metropolitan areas on the coasts and in the Great Lakes region spearhead adoption of micro-fulfilment and same-day logistics, translating into higher per-capita ecommerce spending. Conversely, rural counties experience slower penetration due to higher freight fees, a gap widened by the new USD 1.75 remote delivery surcharge from UPS.
Cross-border demand remains a lever for domestic brands. Section 321 policy changes effective February 2025 removed the duty-free threshold for imports from China, Canada, and Mexico, prompting merchants to reroute inventory to bonded warehouses or explore in-country production for foreign customers. While this disrupts drop-ship models, it underscores a strategic push toward near-shoring and regional fulfilment nodes.
Digital activity permeates every congressional district, supporting 28.4 million jobs that expand 12 times faster than overall employment. Hyperlocal fulfilment facilities range from 10,000 to 20,000 sq ft and create roles in operations, maintenance, and data analytics throughout the Midwest and Sun Belt. As a result, the US ecommerce market spreads economic benefits beyond legacy tech hubs, setting a foundation for broader adoption of advanced retail technologies nationwide.
Competitive Landscape
Amazon commands 37.6% of US ecommerce market share, underpinning a marketplace model where third-party sellers account for 60% of GMV. Walmart follows with 6.4% and capitalises on its 4,600-store network to blend in-store pick-up with nationwide delivery. Apple, eBay, and Target round out the top five, yet cross-border entrants such as Shein and Temu accelerate rapidly: Shein now holds 50% of the US fast-fashion niche while Temu logs more than 503 million monthly visits.
Fulfilment excellence differentiates leaders. Amazon extended same-day coverage to 90 metropolitan areas, leveraging mini-sort centres positioned within 50 miles of demand clusters. Walmart’s strategy aims for 25% online penetration by FY30, hinging on grocery strength and a marketplace expected to grow at 26% CAGR. Third-party sellers gravitate toward both ecosystems, yet Walmart’s stricter vetting helps preserve brand equity, particularly in food and household staples.
Technology adoption scales across incumbents and challengers alike. Seventy-eight percent of ecommerce brands either use or plan to use AI to personalise recommendations and optimise supply chains. Amazon’s Project Ivy leverages generative AI for catalogue enrichment, while Walmart integrates predictive analytics to reduce out-of-stocks. Meanwhile, Shopify positions itself as the operating system for independent merchants, processing USD 292 billion GMV in 2024 and holding 12% share of the US ecommerce market. Competition therefore pivots not solely on price but on service reliability, ecosystem breadth, and data-driven merchandising.
US E-Commerce Industry Leaders
-
Apple Inc.
-
eBay Inc.
-
Amazon.com, Inc.
-
Walmart Inc.
-
The Home Depot, Inc.
- *Disclaimer: Major Players sorted in no particular order
Need More Details on Market Players and Competitors?
Download PDF
Recent Industry Developments
- May 2025: Amazon’s attempt to dismiss an antitrust suit failed when the District of Columbia Court of Appeals allowed allegations concerning price-parity policies to proceed. The decision forces Amazon to reassess how it balances marketplace fee income with regulatory risk, signalling tighter guardrails on seller terms.
- April 2025: Shopify posted USD 2.4 billion in Q1 revenue, up 27% year-over-year, confirming that its merchant-centric platform strategy scales globally while offering independent sellers an alternative to entrenched marketplaces.
- March 2025: Walmart announced plans to lift ecommerce penetration from 17% to 25% of revenue by FY30, leveraging grocery leadership to draw repeat visits and expanding marketplace GMV at a 26% CAGR, a strategic gambit aimed at narrowing the gap with Amazon.
- February 2025: US Customs and Border Protection removed duty-free privileges for low-value imports from China, Mexico, and Canada, forcing Temu and Shein to reassess US fulfilment routes and nudging domestic sellers to review cross-border pricing.
US E-Commerce Market Report Scope
E-commerce is the buying and selling of goods and services over the Internet through online shopping. However, this term is often used to describe all the seller's efforts in selling products directly to consumers. It begins when potential customers learn about a product, buy it, use it, and ideally maintain lasting customer loyalty.
The US e-commerce market is segmented by B2C e-commerce (beauty and personal care, consumer electronics, fashion and apparel, food and beverages, furniture, and home) and B2B e-commerce. The report's scope includes market sizes and forecasts for the segments, with the B2C channel being further segmented by application. The market sizes and forecasts are provided in terms of value (USD) for all the above segments.
| By Business Model | B2C |
| B2B | |
| By Device Type | Smartphone / Mobile |
| Desktop and Laptop | |
| Other Device Types | |
| By Payment Method | Credit / Debit Cards |
| Digital Wallets | |
| BNPL | |
| Other Payment Method | |
| By B2C Product Category | Beauty and Personal Care |
| Consumer Electronics | |
| Fashion and Apparel | |
| Food and Beverages | |
| Furniture and Home | |
| Toys, DIY and Media | |
| Other Product Categories |
By Business Model
| B2C |
| B2B |
By Device Type
| Smartphone / Mobile |
| Desktop and Laptop |
| Other Device Types |
By Payment Method
| Credit / Debit Cards |
| Digital Wallets |
| BNPL |
| Other Payment Method |
By B2C Product Category
| Beauty and Personal Care |
| Consumer Electronics |
| Fashion and Apparel |
| Food and Beverages |
| Furniture and Home |
| Toys, DIY and Media |
| Other Product Categories |
Need A Different Region or Segment?
Customize Now
Key Questions Answered in the Report
What is the current US ecommerce market size in 2025?
The market stands at USD 1.25 trillion in 2025 and is projected to reach USD 2.08 trillion by 2030.
Which device generates most online sales?
Smartphones accounted for 72% of transactions in 2024 and are growing at a 12.1% CAGR.
How fast is the B2B segment growing within US online commerce?
B2B ecommerce is expanding at a 12.8% CAGR through 2030, faster than the overall market.
What impact do delivery surcharges have on merchants?
New carrier fees add 10-12% to small-business shipping costs, pressuring margins and price competitiveness.
Why is BNPL significant for retailers?
BNPL raises average order value by about 20% and is forecast to grow at an 18.3% CAGR through 2030.
Which product category is forecast to grow fastest online?
Food & beverages leads with a projected 15.2% CAGR, driven by investment in temperature-controlled fulfilment and subscription models.
Page last updated on: July 2, 2025

