
Market Overview
| Study Period | 2021 - 2031 |
|---|---|
| Forecast Data Period | 2026 - 2031 |
| Base Year Market Size (2025) | 7.29 gigawatt |
| Market Volume (2026) | 8.09 gigawatt |
| Market Volume (2031) | 13.65 gigawatt |
| Growth Rate (2026 - 2031) | 11.05 % |
| Market Concentration | High |
Major Players *Disclaimer: Major Players sorted in no particular order Image © Mordor Intelligence. Reuse requires attribution under CC BY 4.0. | |
United Arab Emirates Renewable Energy Market Analysis by Mordor Intelligence
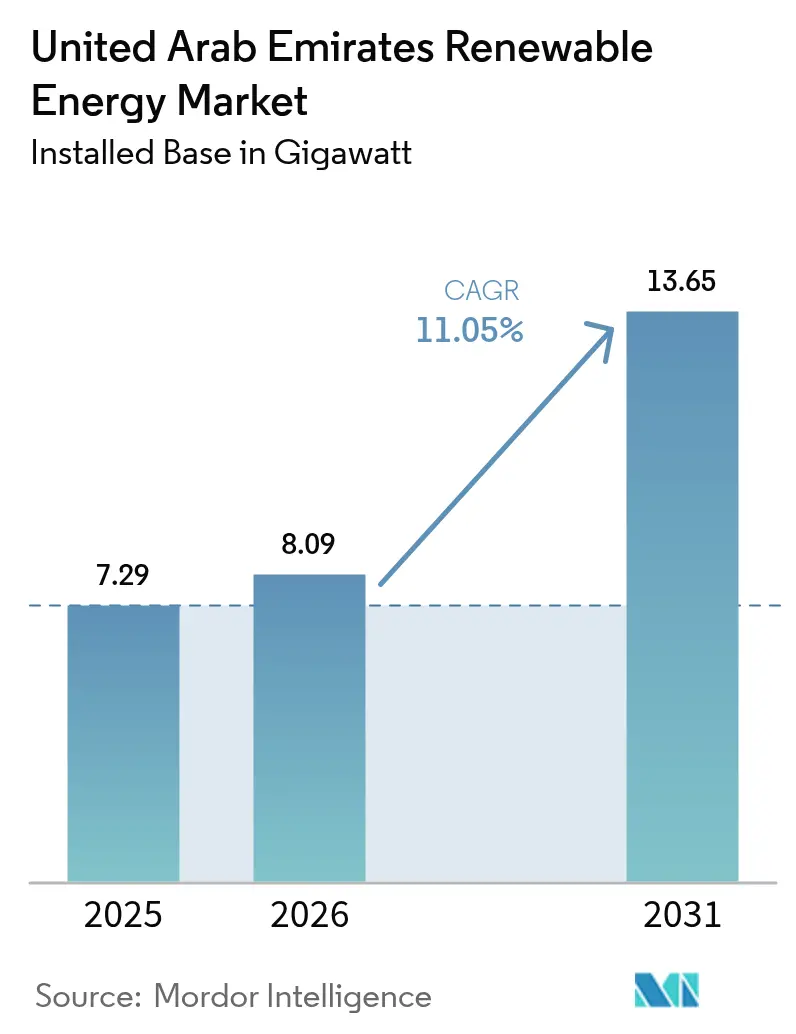
The United Arab Emirates Renewable Energy Market size is expected to grow from 7.29 gigawatt in 2025 to 8.09 gigawatt in 2026 and is forecast to reach 13.65 gigawatt by 2031 at 11.05% CAGR over 2026-2031.
Strong policy mandates, record-low solar tariffs, and an expanding climate-finance pipeline underpin growth, while gigawatt-scale projects align with the Net Zero 2050 target. Solar photovoltaic technology already dominates national capacity; however, offshore wind, green hydrogen infrastructure, and grid-scale battery storage are rapidly transitioning from pilot to commercial scale. Mandatory clean-power procurement for federal entities beginning in 2025 removes demand risk for developers, and successive sovereign green-bond issues channel international capital at attractive rates. Persistent grid bottlenecks in the Northern Emirates and shortages of operations and maintenance talent could slow the pace of deployment, but the overall trajectory remains decisively upward for the UAE's renewable energy market.
Key Report Takeaways
- By technology, solar energy captured 97.60% of the UAE renewable energy market share in 2025; wind energy is projected to expand at a 47.9% CAGR through 2031.
- By end-user, utilities commanded 69.80% of the UAE's renewable energy market size in 2025, while the residential segment is forecast to register a 16.37% CAGR between 2026 and 2031.
Note: Market size and forecast figures in this report are generated using Mordor Intelligence’s proprietary estimation framework, updated with the latest available data and insights as of 2026.
United Arab Emirates Renewable Energy Market Trends and Insights
Drivers Impact Analysis*
| Driver | (~) % Impact on CAGR Forecast | Geographic Relevance | Impact Timeline |
|---|---|---|---|
| Declining solar PV Levelised Cost of Energy (LCOE) | +3.20% | Abu Dhabi, Dubai | Short term (≤ 2 years) |
| Utility-scale green-hydrogen export ambitions (Al Ruwais, Al Dhafra) | +2.80% | Abu Dhabi (Al Ruwais, Al Dhafra) | Medium term (2-4 years) |
| Mandatory renewable-energy procurement by government entities (from 2025) | +2.10% | National, federal and emirate-level | Medium term (2-4 years) |
| COP-28‐linked sovereign green-bond issuance pipeline | +1.90% | National, with Abu Dhabi and Dubai concentration | Long term (≥ 4 years) |
| Source: Mordor Intelligence | |||
Declining Solar PV Levelised Cost of Energy Creates Competitive Advantage
Tariffs at the 2 GW Al Dhafra project fell to USD 1.32 cents ⁄ kWh, bringing the LCOE below that of gas-fired generation.(1)Masdar, “Al Dhafra Solar PV Project Achieves World-Record Tariff,” masdar.ae Abundant irradiance above 2,000 kWh/m² each year and bulk equipment purchasing for gigawatt projects reinforce cost leadership. R&D at Masdar Institute shows that desert-sand thermal storage can trim concentrated-solar-power storage costs by up to 70%. Bidirectional LSTM forecasting now informs dispatch schedules, raising capacity factors and improving project bankability. Cost deflation widens the addressable market for both utility-scale and rooftop systems, supporting the long-term growth of the UAE renewable energy market.
Utility-Scale Green-Hydrogen Export Infrastructure Positions the UAE as a Global Supplier
The National Hydrogen Strategy targets 1.4 million tonnes of low-carbon hydrogen by 2031 and 15 million tonnes by 2050, elevating the UAE to the global top ten of prospective producers.(2)Fraunhofer ISE, “Hydrogen Roadmap UAE,” ise.fraunhofer.de Mitsui’s 1 million t ⁄ y clean-ammonia facility at Al Ruwais will come online in 2027, integrating carbon-capture to meet export specifications for Asia. Masdar and TotalEnergies advance a hydrogen-to-methanol-to-sustainable-aviation-fuel chain that targets hard-to-abate sectors. ADNOC Gas pilots LOOP technology that converts methane streams into graphene and hydrogen, generating new revenue while decarbonizing legacy assets. Hydrogen ambitions therefore reinforce long-run demand for renewables, adding depth to the UAE renewable energy market.
Government Procurement Mandates Establish a Structural Demand Foundation
Federal Decree-Law No. 11 of 2024 obliges entities to track their greenhouse-gas inventories and adopt reduction plans, while from 2025, every federal body must source a defined share of its power from renewables.(3)ADNOC Gas, “LOOP Technology Pilot at Habshan,” adnocgas.ae This rule delivers predictable offtake volumes for developers and derisks distributed solar rollout across public facilities. Dubai’s Clean Energy Strategy 2050 aims for a 75% share of renewables, while Abu Dhabi targets 60% clean electricity by 2035 through EWEC tenders. Long-dated contracts issued under those frameworks sustain cash flows, lower weighted-average cost of capital, and support a healthy pipeline across the UAE renewable energy market.
COP28 Legacy Mobilises International Climate Finance
Cumulative pledges have surpassed USD 54 billion for domestic renewable infrastructure through 2030, and two sovereign green-bond tranches have raised more than USD 3 billion at record-low spreads. The Sustainable Finance Framework allocates capital preferentially to clean-energy projects with measurable carbon benefits, fast-tracking approvals, and accelerating drawdowns. A USD 3 billion green loan from JBIC to ADNOC illustrates the UAE’s role as a bridge between European and Asian financiers. Deep pools of concessional capital raise project IRRs and expand the investable universe in the UAE renewable energy market.
Restraints Impact Analysis*
| Restraint | (~) % Impact on CAGR Forecast | Geographic Relevance | Impact Timeline |
|---|---|---|---|
| Grid-congestion risk between Abu Dhabi & Northern Emirates | -1.40% | Northern Emirates, Abu Dhabi interconnection | Short term (≤ 2 years) |
| Skilled-labor shortage for O&M of large PV parks | -0.90% | National, concentrated in Abu Dhabi and Dubai | Medium term (2-4 years) |
| Protracted permitting for behind-the-meter wind micro-projects | -0.60% | Distributed sites, especially the Northern Emirates | Medium term (2-4 years) |
| Source: Mordor Intelligence | |||
Grid Infrastructure Constraints Limit Distributed Generation Expansion
Transmission corridors linking Abu Dhabi’s generation clusters with demand centres in the Northern Emirates are already running near capacity. The GCC interconnection gives regional flexibility but cannot solve internal pinch points. DEWA’s USD 1.9 billion smart grid programme will modernize switching and demand management. EWEC’s 400 MW ⁄ 800 MWh battery-storage procurement hedges against curtailment risk and supports frequency regulation. Even so, if reinforcement slips behind schedule, effective capacity additions in the UAE renewable energy market could lag permit awards.
Operations and Maintenance Workforce Gaps Threaten Project Performance
Meeting the planned 14.2 GW by 2030 demands an estimated 11,000 specialised jobs, yet the current renewables workforce is below 1,000. Oil-and-gas employers outbid those in the clean-energy segment, prompting 87% of surveyed professionals to consider leaving the sector. Transient visa arrangements limit long-term retention of skills, and mid-level MEP competencies remain scarce. Without accelerated training pipelines and streamlined immigration processes, project timelines across the UAE's renewable energy market risk slippage.
*Our forecasts treat driver/restraint impacts as directional, not additive. The impact forecasts reflect baseline growth, mix effects, and variable interactions.
Segment Analysis
By Technology: Solar Dominance Meets Wind Momentum
Solar energy contributed 97.60% of the UAE's renewable energy market share in 2025. The UAE renewable energy market size for solar segments reached 7.11 GW in 2025 and is still expanding through pipeline projects in Abu Dhabi and Dubai. Wind energy, supplied by the 103.5 MW Sir Bani Yas farm, is forecast to post a 47.9% CAGR, supported by ongoing offshore assessments. Solar keeps the lead because of low LCOE and mature EPC services. Wind's rising capacity factors above 40% make it the preferred diversification tool for EWEC. Concentrated solar power, exemplified by the 950 MW Noor Energy 1 project, delivers dispatchable energy through molten-salt storage, yet future procurement skews toward PV-plus-battery due to lower cost.
Chinese suppliers sign multi-year module frameworks, enabling economies of scale. Trackers, bifacial panels, and robotic cleaners reduce operational costs by 10-12% year-over-year. JinkoSolar and Canadian Solar own 20% of Al Dhafra's equity, securing a steady module offtake. Wind developers plan 1-GW offshore clusters off Ras Al Khaimah by 2030. Siemens Gamesa extends maintenance deals to guarantee 40% capacity factors at Sir Bani Yas. Hydropower remains a niche market. Hatta's 250 MW pumped-storage facility helps stabilize Dubai's energy. Dubai's waste-to-energy plant offers 200 MW while diverting 1.9 million tons of waste annually. Geothermal and ocean energy remain at the feasibility stage due to geological constraints.




By End-User: Utilities Lead, Residential Accelerates
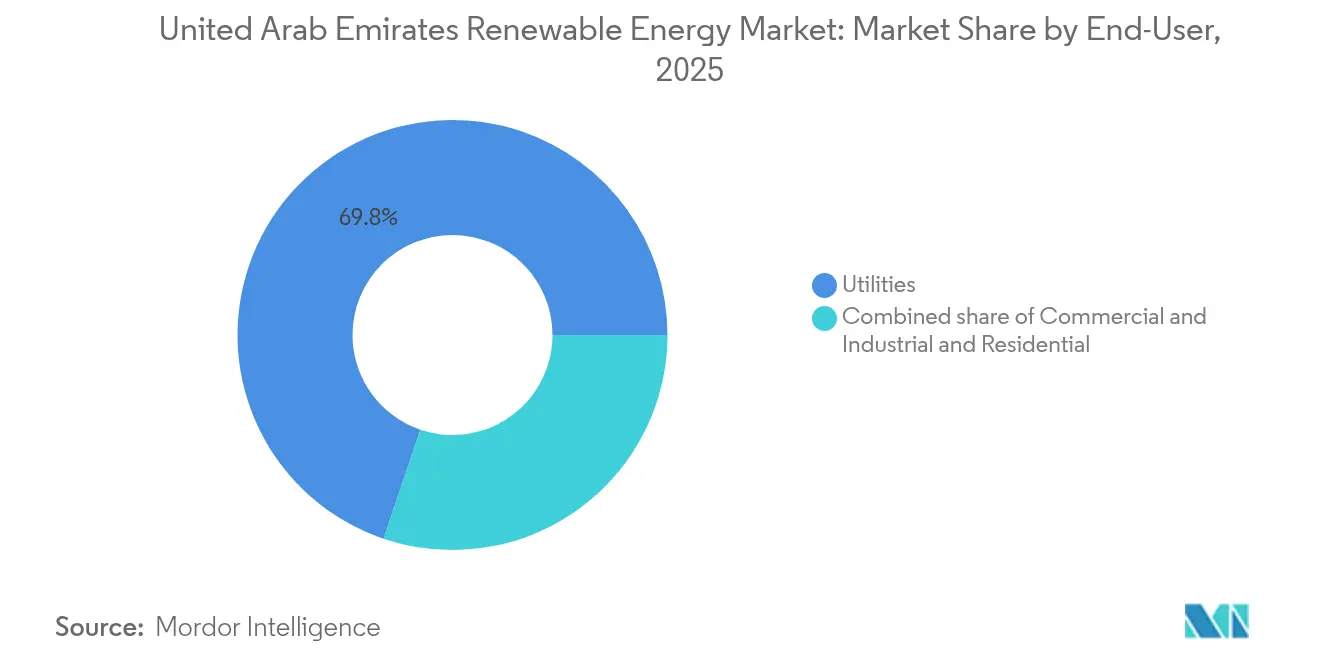
Utilities held 69.80% of the UAE renewable energy market size in 2025, fueled by DEWA’s 5,000 MW ambition and EWEC’s multi-gigawatt pipeline. Commercial and industrial customers account for nearly 23% as rooftop economics improve for factories, malls, and data centers. Residential users currently own just 6.5%, but this share is expected to grow at a 16.37% CAGR through 2031. Utility dominance relies on sovereign mandates, access to concessionary financing, and land consolidation. Competitive auctions continue to compress tariffs below 1.62 cents per kWh, reinforcing the need for gigawatt-scale buildout.
Rooftop deployment accelerates under Shams Dubai net-metering, which refunds export power at the retail tariff for ten years. Yellow Door Energy surpassed 100 MW of commercial and industrial (C&I) projects, while Enerwhere crossed 50 MW with zero-capex leasing models. Etihad Clean Energy Development’s 23.2 MW system on Emirates Engineering Centre highlights state-enterprise uptake. Regulatory approvals are now complete within 90 days, cutting soft-cost friction. Virtual PPAs enable multinationals, such as TotalEnergies, to secure green electricity without requiring site ownership. Residential growth hinges on module price drops and the probable removal of Shams Dubai’s 2 MW rooftop cap.
Geography Analysis
Installed renewable capacity clusters heavily in Abu Dhabi and Dubai, which together host more than 90% of operational assets and the forward pipeline to 2030. Abu Dhabi leverages its land bank, access to capital, and centralised tendering to push gigawatt-scale plants that capture economies of scale. Dubai complements this with city-wide rooftop penetration and a digital grid that enables bidirectional power flows and EV integration. The combination delivers a federation-wide learning curve that further drives down costs within the UAE renewable energy market.
The Northern Emirates have smaller economic footprints but represent significant future opportunities once grid bottlenecks are eased. Sharjah's industrial zones are signing green-power supply deals, while Ras Al Khaimah's pumped-hydropower plan with EDF hints at diversification beyond solar PV. Microgrids and behind-the-meter batteries mitigate curtailment risk and strengthen resilience against peak-demand events. As GCC interconnector upgrades reach completion, excess capacity from Abu Dhabi and Dubai can flow north to balance the supply, thereby smoothing load profiles across the UAE's renewable energy market.
Cross-border partnerships amplify geographic strengths. Korean, French, and Chinese firms bring expertise in turbines, modules, and inverters, while UAE champions retain a majority equity stake to preserve strategic control. Knowledge transfer accelerates workforce upskilling and feeds local manufacturing ambitions for panels, trackers, and electrolyser stacks. A maturing supply chain thus supports balanced growth across all seven emirates and cements nationwide momentum within the UAE renewable energy market.
Regulatory Landscape
The UAE renewable energy policy framework combines federal direction with emirate-level market rules and grid-connection approvals. Federal Decree-Law No. 17 of 2022 governs connection of renewable energy production units to the grid and requires approvals via competent authorities at emirate level, shaping permitting and interconnection timelines for IPPs and self-supply systems.
On the climate and energy-transition side, Federal Decree-Law No. 11 of 2024 mandates emissions inventory tracking and climate action plans across relevant entities, reinforcing compliance-driven demand for clean electricity. The UAE Energy Strategy 2050 provides the overarching targets and investment approach (AED 150-200 billion through 2030), and it is supported by emirate regulators, including the Abu Dhabi Department of Energy, which launched a Solar (Photovoltaic) Energy Self-Supply Policy in February 2026, and Dubai's Regulation and Supervision Bureau (RSB), which implemented a consolidated fee schedule effective 1 January 2026 and adjusted licensing and service fees for regulated activities.
Competitive Landscape
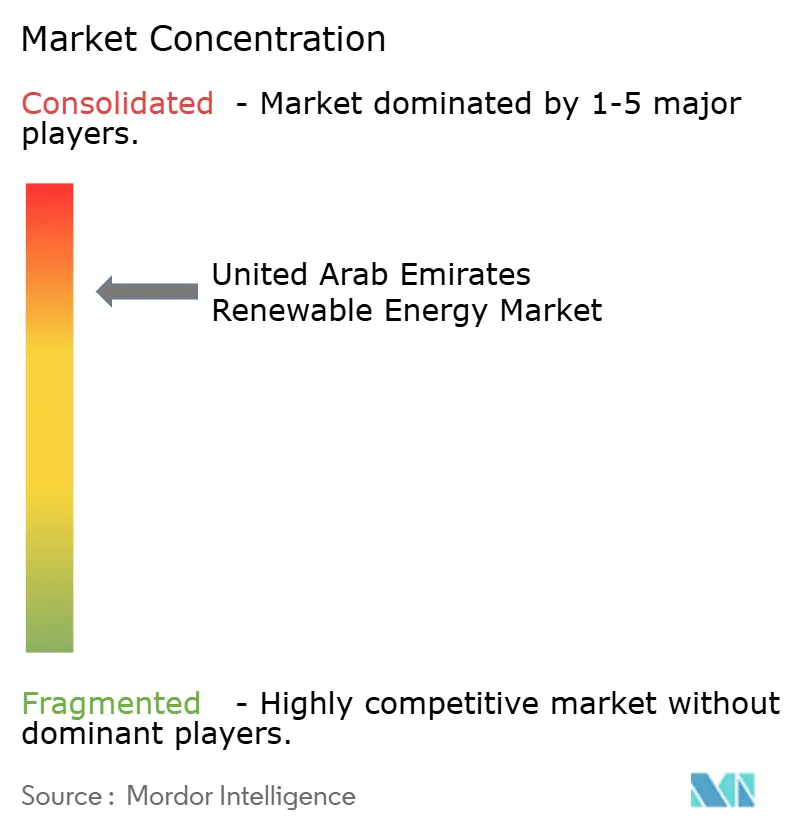
Three national champions, Masdar, DEWA, and EWEC, collectively command about 70% of utility-scale development, indicating moderate concentration within the UAE renewable energy market. Masdar is scaling up toward 100 GW of global renewables by 2030 and has recently purchased 67% of Greece's TERNA ENERGY for EUR 2.4 billion, diversifying its earnings while retaining domestic authority. DEWA couples generation with distribution, providing an integrated test bed for smart grid and hydrogen pilots. EWEC administers Abu Dhabi's auction calendar, anchoring investor confidence through transparent procurement and 30-year offtake contracts.
Collaboration defines competitive behavior; most utility-scale tenders allocate minority stakes to global specialists, such as EDF Renewables, KOWEPO, and Jinko Power, who supply technology, EPC skills, and lower financing costs. This model fosters risk sharing and ensures knowledge spillovers that upskill the local workforce. Traditional hydrocarbon players, led by ADNOC Gas, are now investing in methane-to-graphene conversion and green ammonia export hubs, signaling convergence rather than sectoral rivalry within the UAE renewable energy market.
White space remains in commercial and industrial rooftop solar, community microgrids, and advanced long-duration storage using local raw materials, such as desert sand. New entrants in software-defined power systems, floating solar platforms, and Pay-As-You-Save financing could erode incumbent margins. Yet, regulatory clarity, sovereign backing, and deep capital pools mean that incumbent operators retain structural advantages that will shape the competitive trajectory of the UAE's renewable energy market.
United Arab Emirates Renewable Energy Industry Leaders
Yellow Door Energy
Masdar
DEWA
EWEC
Engie SA
- *Disclaimer: Major Players sorted in no particular order

Market Opportunities and Future Outlook
Utility-scale solar PV continues to drive the main volume, but the most visible whitespace is in firm clean power, particularly through contracting structures that pair PV with grid-scale storage for round-the-clock supply. Masdar and EWECs 24/7 gigascale project in Abu Dhabi (5.2 GW solar PV plus 19 GWh BESS, USD 6.1 billion) demonstrates commercial-scale storage integration, creating a route to supply energy-intensive loads that need higher certainty than daytime PV alone.
A second set of opportunities is tied to accelerated procurement and delivery platforms across emirates, where tender calendars and bankable offtake still draw international developers and lenders. In Abu Dhabi, EWEC-awarded projects such as the 1.5 GW Khazna Solar PV IPP (ENGIE and Masdar) point to continued depth for IPP participation. In Dubai, DEWA procurement at the Mohammed bin Rashid Al Maktoum Solar Park supports further capacity additions alongside grid digitization. Beyond large IPPs, emirate policy and regulatory actions such as Abu Dhabis 2026 self-supply framework, together with programs like Shams Dubai, expand the addressable market for behind-the-meter systems across public facilities, commercial rooftops, and industrial sites, with execution shaped by grid capacity in the Northern Emirates and availability of specialized O&M talent.
Recent Industry Developments
- July 2026: Masdar reached financial close for its USD 6.1 billion round-the-clock renewable energy project in Abu Dhabi with EWEC, combining a 5.2 GW solar PV plant with a 19 GWh battery energy storage system. The financing package takes PV-plus-storage from a pilot concept to a banked, utility-scale delivery model, supporting firm clean-power contracting and grid services at scale.
- January 2026: ENGIE and Masdar reached financial close on the 1.5 GW Khazna Solar PV independent power project in Abu Dhabi, a project awarded by EWEC in October 2025. The close reinforces Abu Dhabis IPP pathway and keeps the market anchored around large, long-tenor contracts that support competitive pricing and sustained EPC activity.
- November 2025: Yellow Door Energy commissioned four onsite solar plants in Dubai for Emicool, totaling 1.2 MWp. The rollout underscores continued momentum for C&I rooftop and distributed generation, where multi-site portfolios and service models help reduce adoption friction for end users.


Research Methodology Framework and Report Scope
Market Definition and Coverage
For this study, the UAE renewable energy market is defined as renewable electricity generation capacity installed in the country, measured in gigawatts, across technologies that supply the grid or serve on-site demand.
Scope exclusions: We exclude fossil-based generation and the value of electricity sold (prices, tariffs, and revenues are not used as the market size unit).
Segmentation Overview
- By Technology
- Solar Energy (PV and CSP)
- Wind Energy (Onshore and Offshore)
- Hydropower (Small, Large, PSH)
- Bioenergy
- Geothermal
- Ocean Energy (Tidal and Wave)
- By End-User
- Utilities
- Commercial and Industrial
- Residential
Data Sources, Market Sizing, and Validation
Desk Research
Desk work starts by building a clear view of installed capacity, commissioning timelines, and policy signals that influence new renewable additions. We rely on public sources such as IRENA statistics, IEA renewables datasets, UAE government energy and climate strategy releases, regulator and utility publications, and project tender award announcements, which helps keep additions realistic and time-bound.
We also review company annual reports, investor presentations, and reputable press to cross-check project status, ownership, and expected commercial operation dates. For extra confirmation on pipelines and awards, we sometimes use paid subscriptions for company financials and intelligence, and for global contracts and tenders, which helps reconcile what is announced versus what is actually progressing. These are illustrative examples of sources, and many other references were also used for data collection, validation, and research clarification.
Primary Interviews and Surveys
Primary inputs were gathered through expert interviews and structured surveys with developers, EPC and O&M participants, grid and power-sector specialists, and large commercial power buyers in the UAE. We also spoke with advisors who track permitting and tender pipelines, which helped us confirm commissioning slippages, technology mix expectations, and practical build-out rates by emirate and end-user.
Distribution of primary research fieldwork respondents
| Company type | Respondent position |
|---|---|
| Top tier: 38% | CXOs: 12% |
| Mid tier: 42% | Functional/Unit leaders: 39% |
| Smaller Players: 20% | Managers: 49% |
Market-Sizing & Forecasting
Sizing is built using top-down and bottom-up logic, where official capacity and generation mix data are used to reconstruct the installed renewable base by technology, and then additions are layered year by year based on what is commissioned. To keep totals grounded, selective bottom-up checks are applied using project-level tracking from public tender awards, announced plant sizes, and sampled timelines, and then totals are adjusted when gaps show up.
Key inputs in the model include installed renewable capacity (GW), annual capacity additions, grid connection and commissioning status, policy targets and tender schedules, and the expected technology split across solar PV, CSP, wind, and other renewables. Where project dates are unclear, conservative slippage factors are applied and then reviewed through interviews. We also take care to avoid double counting when ownership or project structures change.
For forecasting, scenario analysis is used because delivery can shift with permitting, financing, and grid readiness. Scenarios are anchored to confirmed awards and under-construction capacity first, followed by extensions based on expert views on tender cadence and execution capacity. These outputs are then checked against past build-out patterns.
Data Validation & Update Cycle
Outputs are validated by comparing the modeled capacity pathway with independent signals such as published national targets, tender award volumes, and observed commissioning patterns, and then outliers are reviewed before sign-off. When a large project is delayed, resized, or accelerated, assumptions are rechecked through follow-up outreach, and the technology split is updated so totals remain consistent.
A multi-step review is done across analysts to catch unit errors, double counting, and unrealistic additions. The final numbers are then checked against the most recent public releases. Reports are refreshed annually, with interim updates when material events occur, and a final pre-delivery pass is completed so clients receive the latest available view.
Mordor Intelligence's United Arab Emirates Renewable Energy Market Size Compared With Other Published Estimates
Published estimates for UAE renewable energy often diverge because the unit of measurement is not always the same, and the included items can shift between installed capacity, capacity additions, and USD-based market value. Timing also matters, since some approaches keep projects in the current-year count even when commissioning dates slip, and currency conversion choices can change USD totals.
A common source of spread is that some figures translate renewables into revenue and investment values, which can blend equipment, EPC, and services, while others stick to operating capacity in gigawatts. Differences also show up when awarded but not yet grid-connected projects are treated as installed, or when smaller technologies are grouped differently across the definition.
Benchmark comparison
| Source | Market Size | Gaps in Research Methodology |
|---|---|---|
| Mordor Intelligence | USD 7.29 B (2025) | |
| Industry Publisher A | USD 5.30 B (2025) | Uses a USD market value construct that can include equipment and project spend, which does not translate directly to installed renewable capacity counted in gigawatts. |
| Industry Publisher B | USD 4.71 B (2025) | Applies a fast build-out path and may treat awarded or planned capacity as current-year installed, which can pull forward volume that is still pending commissioning. |
The table suggests most of the gap is explained by capacity versus USD framing and by how strictly commissioning status is screened before counting capacity, and keeping the sizing anchored to installed, grid-connected gigawatts is the key modeling difference applied by Mordor Intelligence.


Key Questions Answered in the Report
What is the current installed renewable capacity in the UAE in 2026?
Installed capacity reaches 8.09 GW in 2026 and is forecast to climb to 13.65 GW by 2031.
Which technology dominates UAE clean power additions?
Solar photovoltaics leads with 97.60% share in 2025 owing to ultra-low LCOE bids and vast project pipelines.
How fast will UAE wind projects grow?
Wind capacity is projected to post a 47.9% CAGR between 2026-2031 as onshore performance is proven and offshore surveys advance.
What drives residential rooftop adoption?
Shams Dubai net-metering, cheaper modules, and ten-year retail-price credits lift the residential segment at a 16.37% CAGR.
How big is the UAE green-hydrogen ambition?
National targets call for 1.4 million t p.a. by 2031 and 15 million t by 2050, requiring an extra 60 GW of dedicated renewables.
Which emirate adds most new capacity?
Abu Dhabi leads through EWEC’s multi-gigawatt solar parks and Masdar’s green-hydrogen electrolyser at Al Ruwais.
Page last updated on:


 Your data is secure and never sold or shared.


