Market Overview
| Study Period | 2021 - 2031 |
|---|---|
| Forecast Data Period | 2026 - 2031 |
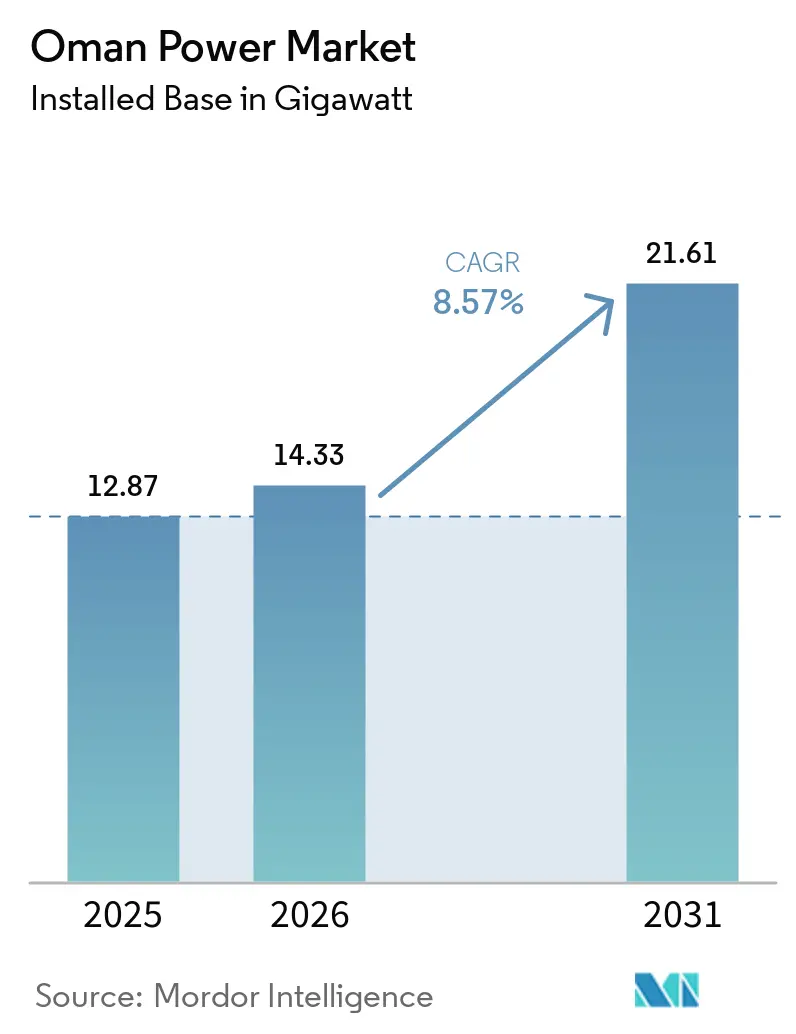
| Base Year Market Size (2025) | 12.87 gigawatt |
| Market Volume (2026) | 14.33 gigawatt |
| Market Volume (2031) | 21.61 gigawatt |
| Growth Rate (2026 - 2031) | 8.57% CAGR |
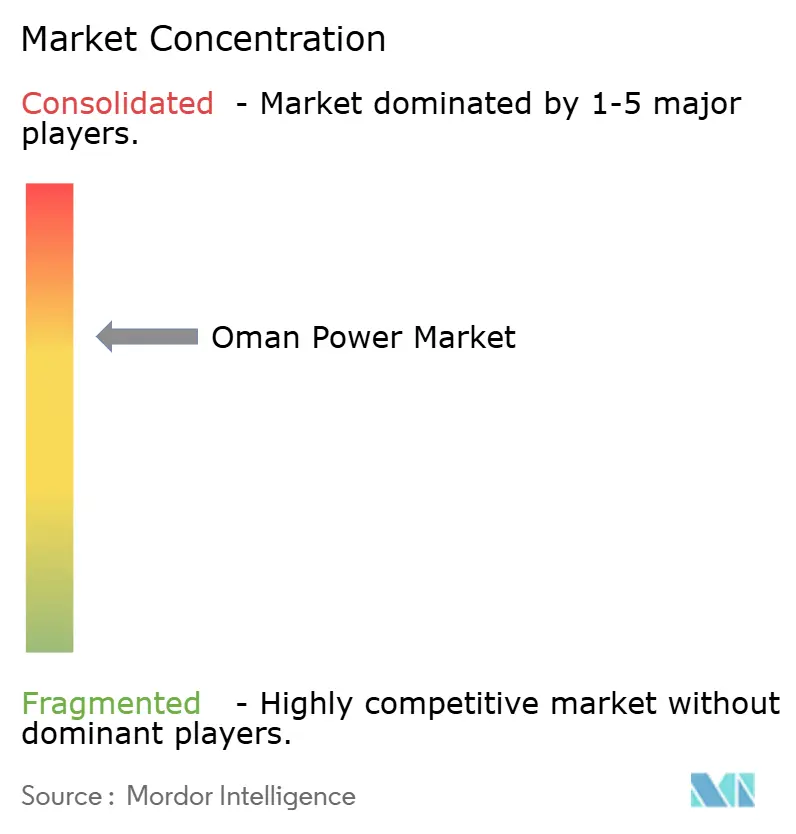
| Market Concentration | Medium |
Major Players
*Disclaimer: Major Players sorted in no particular order Image © Mordor Intelligence. Reuse requires attribution under CC BY 4.0. |
|
Oman Power Market Analysis by Mordor Intelligence
The Oman Power Market size in terms of installed base is expected to increase from 12.87 gigawatt in 2025 to 14.33 gigawatt in 2026 and reach 21.61 gigawatt by 2031, growing at a CAGR of 8.57% over 2026-2031.
Demand growth is catalyzed by green-hydrogen electrolyzer clusters, rapid data-center and Bitcoin-mining expansions, and a 6 GW utility-scale solar pipeline that pushes renewables deeper into the generation mix. Transmission reinforcements under the North-South 400 kV “Rabt” program eliminate curtailment pockets, while cost-competitive solar bids below 2.5 US cents per kWh encourage early retirement of aging gas turbines. Two hydrogen-ready CCGT projects, Misfah (1,600 MW) and Duqm (800 MW), lock in dispatchable capacity and hedge against future carbon-border adjustments. At the same time, partial subsidy reforms introduced in 2025 begin to expose residential customers to cost-reflective pricing, a step that slowly aligns rooftop-solar economics with wholesale market realities.[1]Authority for Public Services Regulation, “Decision 44/2024 Tariff Reform,” APSR, apsr.om
Key Report Takeaways
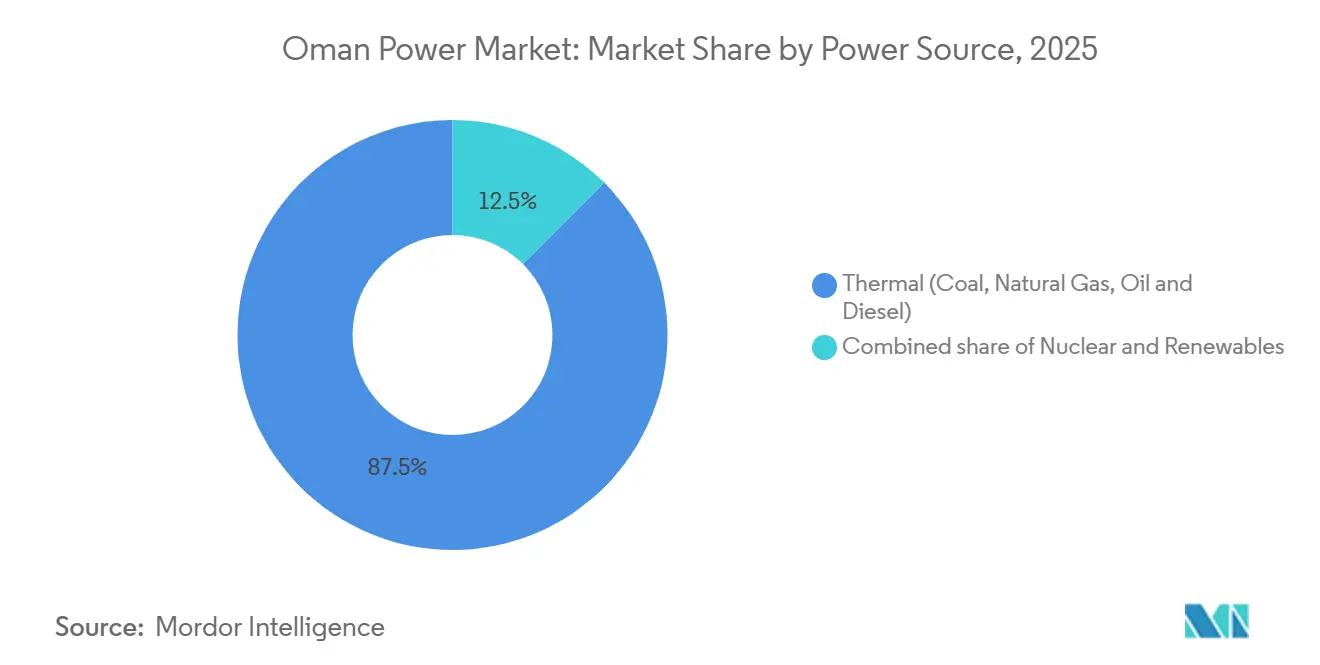
- By power source, thermal generation led with 87.55% of the Oman power market share in 2025, while renewables are expected to advance at a 24.69% CAGR through 2031.
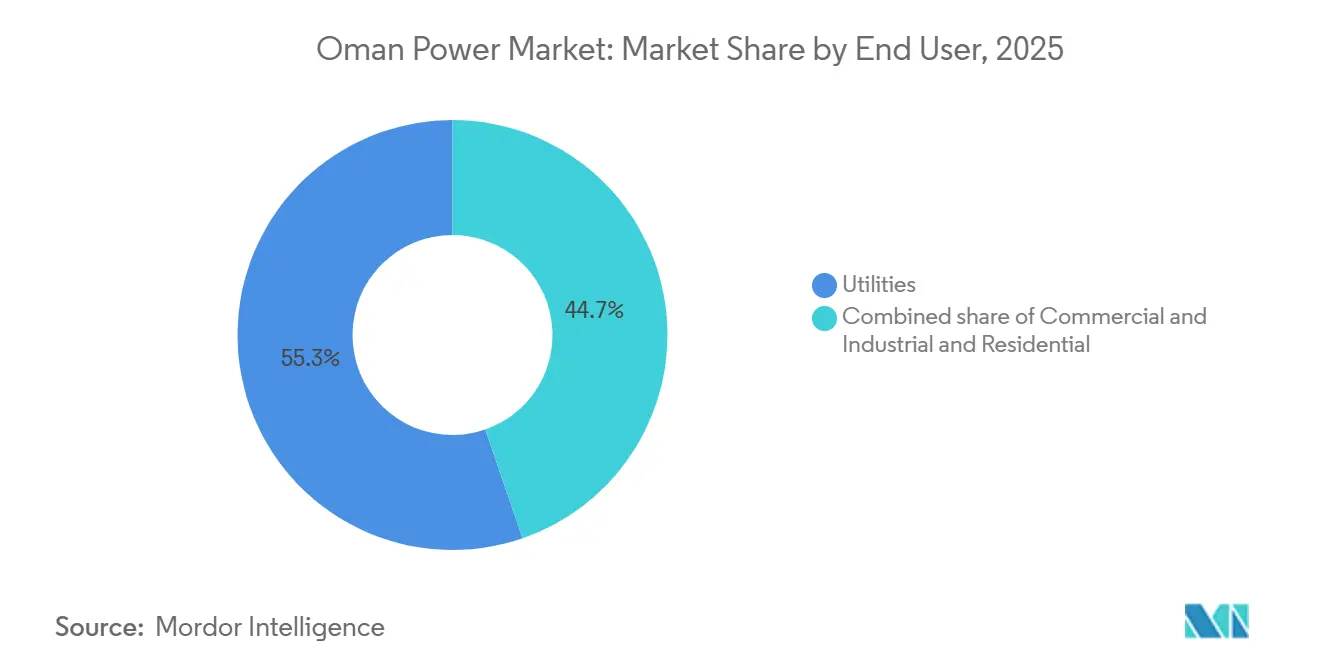
- By end user, utilities commanded 55.3% of the Oman power market size in 2025, whereas the commercial-and-industrial segment is projected to grow at a 13.5% CAGR over 2026-2031.
Note: Market size and forecast figures in this report are generated using Mordor Intelligence’s proprietary estimation framework, updated with the latest available data and insights as of 2026.
Oman Power Market Trends and Insights
Drivers Impact Analysis*
| Driver | (~) % Impact on CAGR Forecast | Geographic Relevance | Impact Timeline |
|---|---|---|---|
| Accelerating utility-scale solar PV build-out | +2.5% | National, concentrated in Ad Dakhiliyah (Ibri, Manah) and Al Wusta | Medium term (2-4 years) |
| North–South 400 kV interconnection unlocking renewables corridors | +1.2% | National, linking Main Interconnected System (MIS) to Dhofar Power System (DPS) | Long term (≥4 years) |
| Green-hydrogen anchored mega-projects driving new electricity demand | +1.8% | Duqm Special Economic Zone, Salalah Free Zone | Long term (≥4 years) |
| Rapid data-center & Bitcoin-mining load additions | +0.8% | Muscat Governorate, Salalah | Short term (≤2 years) |
| Distribution-level digitalisation & smart-meter roll-out | +0.6% | National, led by MIS distribution companies | Short term (≤2 years) |
| State-backed low-cost gas supplies for IPPs | +0.9% | National, sourced from Block 61 (Khazzan/Ghazeer) | Medium term (2-4 years) |
| Source: Mordor Intelligence | |||
Accelerating Utility-Scale Solar PV Build-Out
OPWP has 1.6 GW of solar and wind capacity under active tender in 2026, led by Al Kamil solar and the Mahoot and Sadah wind farms.[2]Oman Observer Staff, “Installed Capacity Outlook Accelerates on Solar Pipeline,” Oman Observer, omanobserver.om The 500 MW Ibri III solar-plus-100 MWh battery project, awarded in September 2025, introduced Oman’s first utility-scale energy-storage system and delivered an LCOE below 2.5 US cents per kWh. That tariff is lower than the marginal cost of subsidized gas-fired power, accelerating forced retirements for older combined-cycle units. Manah I and II, commissioned in 2025, lifted renewable capacity to 1.7 GW and supplied 11.5% of generation by May 2025.[3]Masdar, "Masdar Signs PPA for 500 MW Ibri III Solar Project in Oman," masdar.ae To meet its 6 GW solar target for 2030-2031, OPWP must add more than 1 GW annually, a cadence that stretches domestic EPC bandwidth and elevates the role of foreign contractors with multi-gigawatt track records. The resulting capex inflow positions Oman power market participants for supply-chain localization of modules, inverters, and grid-integration services.
North-South 400 kV Interconnection Unlocking Renewables Corridors
Phase 1 of OETC’s “Rabt” program finished in November 2023 with 670 km of 400 kV lines, and Phase 2 contracts worth RO 322 million were signed in March 2024 target completion in 2027.[4]Oman Electricity Transmission Company, “Rabt Program Phase 2 Award,” OETC, oetc.om The backbone links interior wind zones at Duqm, Mahoot, and Sadah to coastal demand centers and is estimated to lift long-run growth. A separate 1,600 MW GCC intertie scheduled for Q4 2026 enables export of surplus winter solar and import of regional thermal capacity during Oman’s summer air-conditioning peaks. With interconnection in place, OPWP can operate a balancing portfolio reminiscent of Denmark’s participation in the Nordic grid, smoothing variable renewables across wider geographies. Grid-code upgrades, including reactive-power compensation and fault-ride-through mandates, delayed several wind projects, but once satisfied, the architecture will support a self-healing grid that targets 30% renewable penetration by 2030.
Green-Hydrogen Anchored Mega-Projects Driving New Electricity Demand
Hydrom’s nine concessions aim for 1.5 million tpa of hydrogen by 2030, a pipeline that demands about 35 GW of dedicated renewables. ACME’s Duqm ammonia facility will consume 1.2 GW of solar-and-wind power when Phase 1 commissions in Q4 2026. Hyport Duqm’s 50 000 tpa first phase and three announced green-steel complexes together translate into an incremental 3-4 GW of electrolyte and furnace load, locking the Duqm hub into a baseload-plus-peak profile not seen in legacy industrial zones. Bidders in Hydrom’s forthcoming Round 3 must secure project debt without sovereign guarantees, testing bankability metrics amid evolving EU ammonia import standards. Successful financial close will create long-term offtake signals for solar and wind developers across the Oman power market corridors.
Rapid Data-Center & Bitcoin-Mining Load Additions
Oman ranked sixth worldwide in Bitcoin mining by January 2026, hosting 3% of the global hashrate, about 32 EH/s, and exploiting natural-gas arbitrage unavailable in liberalized markets. Green Data City’s expansion to 400 MW and Alps Blockchain’s plan for up to 400 MW collectively approach 5% of installed capacity, pressuring Muscat and Sohar distribution grids engineered for lower-intensity industrial loads. Because OPWP socializes fixed generation costs via long-term PPAs, incremental compute demand lowers average system tariffs, unintentionally subsidizing high-energy but low-employment ventures. Distribution operators have installed 1.13 million smart meters, 75% national coverage, yet rural substations still lack full SCADA integration, delaying remote monitoring of harmonic distortion and voltage sags. Short-term mitigation centers on capacitor-bank upgrades and active harmonic filters, but longer-term stability hinges on cost-reflective tariffs that rein in unplanned cryptocurrency loads.
Restraints Impact Analysis*
| Restraint | (~) % Impact on CAGR Forecast | Geographic Relevance | Impact Timeline |
|---|---|---|---|
| Limited private equity exits due to single-buyer model | -0.7% | National, affecting IPP sponsors across MIS and DPS | Medium term (2-4 years) |
| Prolonged electricity-tariff subsidies delaying cost-reflective pricing | -0.9% | National, concentrated in residential and small-commercial segments | Long term (≥4 years) |
| Grid-integration bottlenecks for wind resources | -0.5% | Coastal and interior wind corridors (Jaalan Bani Bu Ali, Mahoot, Duqm) | Short term (≤2 years) |
| Slow execution of rooftop-solar (Sahim) scheme | -0.4% | National, primarily Muscat and Salalah urban centers | Medium term (2-4 years) |
| Source: Mordor Intelligence | |||
Limited Private Equity Exits Due to Single-Buyer Model
OPWP’s monopsony purchasing and 20-year PPAs restrict secondary-market liquidity. Private-equity sponsors that exit Saudi assets after 5-7 years find no similar path in Oman, where the absence of merchant exposure compresses internal rates of return into mid-single digits. Plants such as Sohar Power (585 MW) and Barka II (673.5 MW) moved into preservation mode on PPA expiry, underlining the lack of capacity auctions or spot markets that could recycle stranded assets. The stalled legislative draft for a capacity market modeled on PJM’s RPM keeps pension and insurance funds on the sidelines. Until exit optionality improves, capital recycling into the new generation remains sluggish across the Oman power market.
Prolonged Electricity-Tariff Subsidies Delaying Cost-Reflective Pricing
Residential tariffs stayed capped around 3-4 US cents per kWh after the January 2025 reform, well below the 8-9.7 US cents LCOE for a typical 2.2 kWp rooftop system in Muscat. The mismatch delays Sahim program uptake, with negligible installations despite a 95% expressed willingness in consumer surveys published in 2023. Subsidies also distort industrial siting, luring energy-intensive plants that later lobby against reform, locking in fiscal exposure, and subtracting about 1 percentage point from growth. The deferral of full subsidy phase-out to 2031 signals that social-stability concerns will outweigh tariff alignment for at least another budget cycle, postponing distributed-generation inflection across the Oman power industry. Large-user exemptions further tilt the cost base, effectively subsidizing compute loads with minimal domestic value-added.
*Our forecasts treat driver/restraint impacts as directional, not additive. The impact forecasts reflect baseline growth, mix effects, and variable interactions.
Segment Analysis
By Power Source: Thermal Dominance Faces Renewables Acceleration
Thermal generation captured 87.55% of the Oman power market share in 2025. The Misfah and Duqm CCGT additions, designed for 30% hydrogen blending, ensure dispatchable headroom through 2029 but also lock in gas demand sourced from BP’s Khazzan and Ghazeer fields. Renewables, led by solar PV, contributed 11.5% of generation by May 2025 and are set to exceed 9 GW by 2030. The Oman power market size for renewables is projected to grow at a 24.69% CAGR between 2026 and 2031 as the North-South interconnection removes transmission bottlenecks. Wind farms in Duqm and Mahoot tout 35-40% capacity factors, yet financial close depends on reactive-power upgrades now being standardized in grid-code revisions. Nuclear remains commercially unviable under current cost curves, and coal is ruled out by Oman’s 2050 net-zero pledge, preserving gas-plus-renewables as the twin pillars of generation.
Second-order effects reinforce the pivot. Solar module prices fell below USD 0.15 per watt in 2025, pushing EPC-inclusive capex under USD 600 per kW and flattening the utility cost curve. Battery costs followed, enabling hybrid plants such as Ibri III to provide ramping services once supplied by open-cycle gas turbines. The Oman power market now sees bidders offering solar-plus-storage PPAs at less than 3 US cents per kWh, compared with 4-5 cents for new CCGT. As carbon-border adjustments tighten in Europe, hydrogen-ready turbines gain strategic relevance; plants unable to retrofit risk asset-stranding before PPA tenor ends.


By End User: Utilities Lead, Industrial Electrification Accelerates
Utilities delivered 55.3% of electricity in 2025 through three regional distributors serving 1.35 million customers. Large industrials, however, drive the fastest growth, with the segment expected to rise at a 13.5% CAGR as steelmakers electrify furnaces and hydrogen producers commission electrolyzers. The Oman power market size for commercial and industrial demand is forecast to expand from an estimated 6.4 GW in 2026 to nearly 12 GW by 2031, reflecting the green-hydrogen boom. Bitcoin-mining facilities alone could top 800 MW by 2028, a load equivalent to the Duqm CCGT, creating a new baseload category that challenges existing tariff structures.
Residential sales experience moderate 5-6% growth amid near-saturation of air-conditioning. Smart-meter penetration surpassing 75% enables time-of-use tariffs expected to shave 10-15% off evening peaks if applied nationally. Behind-the-meter solar-plus-storage remains uneconomic under present subsidies but could leap once Sahim II authorizes third-party financing. Commercial customers, especially hotels and malls, show higher tariff elasticity and are early adopters of demand-response contracts that award 15-20% bill savings for curtailment rights. Overall, electrification of steel, chemicals, desalination, and compute drives a structural shift in load shape, enhancing system load factor and lowering average generation cost across the Oman power market.
Geography Analysis
Muscat Governorate and the Batinah corridor accounted for roughly 65% of installed capacity in 2025, yet Duqm Special Economic Zone and Dhofar are forecast to log the fastest demand growth through 2031. The Rabt interconnection, by enabling closure of 14 diesel plants, redirected 175 million liters of diesel per year and trimmed 474 000 t of CO₂ emissions. With Phase 2 on track for 2027, interior solar and wind now have a clear evacuation path to coastal loads.
Duqm emerges as an industrial-energy hotspot. ACME’s 100 000 tpa ammonia plant, Hyport Duqm, and three green-steel ventures together require over 4 GW of dedicated power, a scale that forces fast-tracked 400 kV spurs and substations not yet budgeted in OETC’s capex plan. Failure to synchronize transmission build with project milestones risks stranded generation assets and delayed hydrogen export revenues, injecting schedule risk into the Oman power market. Dhofar Governorate, meanwhile, leverages Nama Dhofar’s 121 596 smart meters and the Salalah-2 IPP to integrate up to 300 MW of coastal wind once a 132 kV reinforcement is completed in 2028.
In the north, the Sohar industrial enclave consumed about 2.5 GW in 2025 and will add another 1 GW by 2030 as LNG-to-methanol and aluminum expansions proceed. Voltage-support equipment is being installed to keep the 220 kV corridor within ±5% of nominal. Interior regions such as Al Wusta adopt microgrid strategies centered on solar-plus-battery hybrids that cut diesel use by up to 90%, lowering LCOE to below 10 US cents per kWh. Once the GCC intertie goes live in Q4 2026, Oman expects to import capacity during summer peaks and export wind and solar surpluses in winter, positioning the Oman power market as a future balancing hub for the wider GCC grid.
Competitive Landscape
Oman’s single-buyer framework drives IPP competition toward cost leadership rather than merchant risk management. Tariffs have already fallen to 2.5 US cents per kWh for solar and about 3.5 cents for new CCGT, squeezing margins yet guaranteeing 20-year cash flows backed by OPWP’s AA credit rating. ACWA Power, Masdar, and Nebras collectively control roughly 35% of post-2020 capacity additions, a concentration that steers supplier ecosystems and EPC contract flow. Chinese EPCs such as China Power Engineering underbid rivals by up to 20%, accelerating localization of module assembly and transformer fabrication.
The next battleground lies in ancillary services. Ibri III’s 100 MWh battery opens a template for frequency-regulation tenders that OETC plans to launch by 2027, offering fresh revenue lines outside the rigid PPA structure. Hydrogen-ready turbines and carbon-capture retrofits also gain traction; Misfah and Duqm secured 22-year project-finance tenors, the longest in Oman, because lenders priced in future carbon-credit upside. Local conglomerate OQ Alternative Energy’s joint venture with Jindal adds competitive tension by combining upstream gas, midstream pipelines, and downstream renewables under one roof, a model that other Gulf NOCs may emulate.
Distribution utilities, Mazoon, Muscat EDC, and Majan, compete on operational efficiency. Mazoon’s enterprise GIS roll-out using Esri software resolved 38 000 data discrepancies, cutting report-filing time by one-third. Network digitalization improves SAIDI and SAIFI indices, indirectly supporting generation-side economics by reducing forced-outage reserves. Smart-meter vendor ONEIC secured contracts for up to 300 000 devices in 2024, underscoring scale benefits for domestic electronics assembly and data-analytics services. As cost-reflective reforms inch forward, customer-centric innovation—bundled rooftop solar, EV charging, and demand response- will likely become the arena where incumbents and new entrants fight for a share in the Oman power market.
Oman Power Industry Leaders
-
Oman Power & Water Procurement Company (OPWP)
-
Oman Electricity Transmission Company (OETC)
-
Mazoon Electricity Distribution Company
-
ACWA Power
-
Sohar Power Company
- *Disclaimer: Major Players sorted in no particular order

Recent Industry Developments
- March 2026: Oman’s Phoenix Power, Al Batinah Power, and Al Suwadi Power signed 15-year PPAs with Nama PWP, covering 3,500 MW of gas-fired IPPs. Agreements commence post-current contract expirations in 2028-2029, ensuring extended operations for major plants in Sur, Barka, and Suhar until 2043-2044.
- March 2026: Oman awarded new power purchase agreements to three energy companies to boost electricity generation capacity. This aligns with its long-term energy strategy, supporting economic growth, key industries like manufacturing and tourism, and ensuring a stable power supply amid rising demand driven by steady economic expansion.
- January 2026: Nama Power and Water Procurement entered into agreements totaling USD 2.6 billion with two consortia. Qatar's Nebras Energy leads one consortium, while the other is headed by Korea Western Power, as reported by the Omani state news agency. The agreements involve power purchase contracts for combined-cycle gas turbine power projects located in Misfah and Duqm.
- January 2025: OETC broke ground on the USD 186 million Masirah Island interconnection, featuring a 25 km subsea cable and 132/33 kV station, to eliminate diesel generation and cut 80,000 t CO₂ annually.


Oman Power Market Report Scope
Power is the process of generating electric power from primary energy sources. Electricity generation for utilities in the electricity industry is the process of delivering (transmission, distribution, etc.) electricity to end users or storing it.
The Omani power market is segmented by power generation by power source [thermal (coal, natural gas, oil, and diesel), nuclear, and renewables (solar, wind, hydro, geothermal, biomass & waste, tidal)], and by end user (utilities, commercial and industrial, and residential). The market size and forecasts for each segment have been based on installed capacity, except for power transmission and distribution (T&D), for which only qualitative analysis will be provided.
By Power Source
| Thermal (Coal, Natural Gas, Oil and Diesel) |
| Nuclear |
| Renewables (Solar, Wind, Hydro, Geothermal, Biomass & Waste, Tidal) |
By End User
| Utilities |
| Commercial and Industrial |
| Residential |
By T&D Voltage Level (Qualitative Analysis only)
| High-Voltage Transmission (Above 230 kV) |
| Sub-Transmission (69 to 161 kV) |
| Medium-Voltage Distribution (13.2 to 34.5 kV) |
| Low-Voltage Distribution (Up to 1 kV) |
| By Power Source | Thermal (Coal, Natural Gas, Oil and Diesel) |
| Nuclear | |
| Renewables (Solar, Wind, Hydro, Geothermal, Biomass & Waste, Tidal) | |
| By End User | Utilities |
| Commercial and Industrial | |
| Residential | |
| By T&D Voltage Level (Qualitative Analysis only) | High-Voltage Transmission (Above 230 kV) |
| Sub-Transmission (69 to 161 kV) | |
| Medium-Voltage Distribution (13.2 to 34.5 kV) | |
| Low-Voltage Distribution (Up to 1 kV) |


Key Questions Answered in the Report
What is the installed capacity forecast for the Oman power market by 2031?
Capacity is expected to reach 21.61 GW by 2031, expanding from 14.33 GW in 2026 at an 8.57% CAGR.
Which segment holds the largest Oman power market share today?
Thermal generation retains the lead with 87.55% of output in 2025, though renewables are catching up fast.
How will green-hydrogen projects affect electricity demand in Oman?
Hydrom's portfolio alone could add about 35 GW of dedicated renewables, effectively doubling national generation within a decade.
When will Oman complete its grid interconnection with the wider GCC network?
The 1,600 MW, 528 km link is slated for commissioning in Q4 2026, paving the way for regional power trading.
Are rooftop solar systems economically viable for Omani households?
Under current subsidies residential tariffs remain below the rooftop LCOE, but Sahim II reforms could improve payback periods post-2026.
What role do data centers and Bitcoin mining play in future load growth?
Compute loads could exceed 800 MW by 2028, representing nearly 5% of projected capacity and reshaping demand profiles.
Page last updated on:


