Market Overview
| Study Period | 2020 - 2031 |
|---|---|
| Forecast Data Period | 2026 - 2031 |
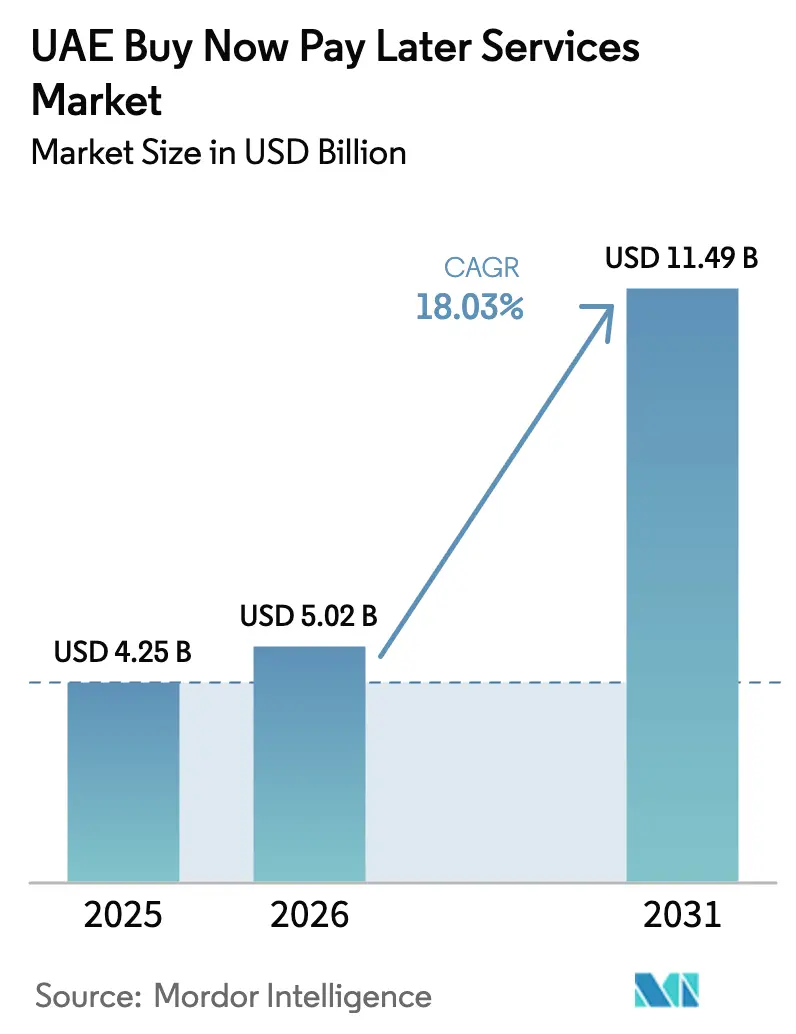
| Base Year Market Size (2025) | USD 4.25 Billion |
| Market Size (2026) | USD 5.02 Billion |
| Market Size (2031) | USD 11.49 Billion |
| Growth Rate (2026 - 2031) | 18.03% CAGR |
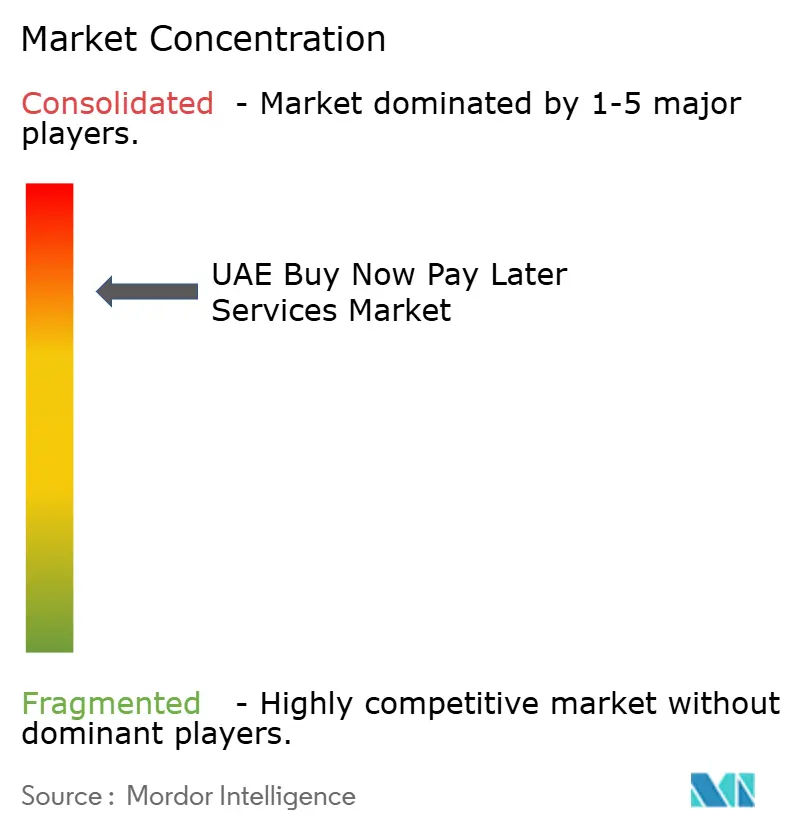
| Market Concentration | High |
Major Players *Disclaimer: Major Players sorted in no particular order Image © Mordor Intelligence. Reuse requires attribution under CC BY 4.0. | |
UAE Buy Now Pay Later Services Market Analysis by Mordor Intelligence
The UAE BNPL services market size was valued at USD 4.25 billion in 2025 and estimated to grow from USD 5.02 billion in 2026 to reach USD 11.49 billion by 2031, at a CAGR of 18.03% during the forecast period (2026-2031). Growth is fueled by high e-commerce penetration, a youthful digital-native population, and a regulatory framework that lends credibility without stifling innovation. Fintech-bank collaborations, the rise of Sharia-compliant installment plans, and luxury retail demand for friction-free high-ticket payments are amplifying adoption across both online and in-store environments. Providers are harnessing data analytics to refine risk scoring, while cross-border shopping from GCC neighbors enlarges the addressable customer base. Competitive intensity remains moderate; however, heightened capital requirements for non-bank lenders and merchant pushback on fees could temper the pace of expansion.
Key Report Takeaways
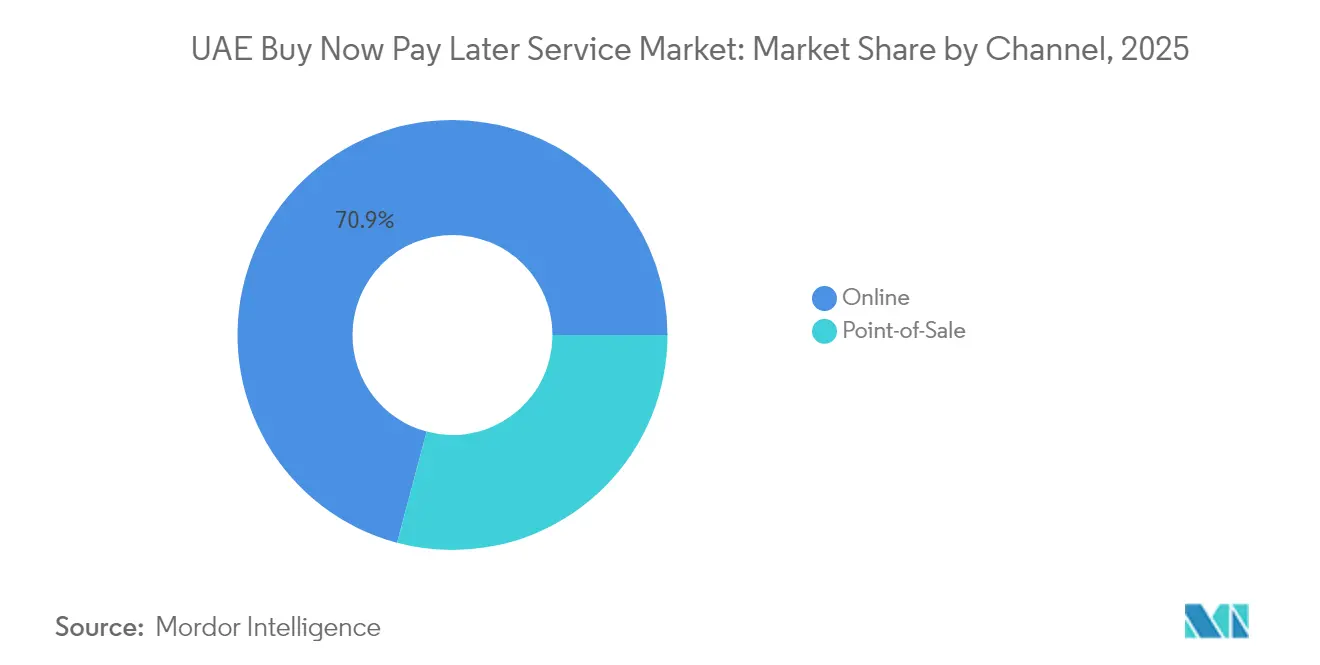
- By channel, the online segment led with 70.85% share of the UAE BNPL services market in 2025, while point-of-sale BNPL is forecasted to expand at a 20.18% CAGR through 2031.
- By end-use industry, consumer electronics accounted for 32.10% share of the UAE BNPL services market size in 2025; healthcare & wellness is projected to grow at 22.35% CAGR during 2026-2031.
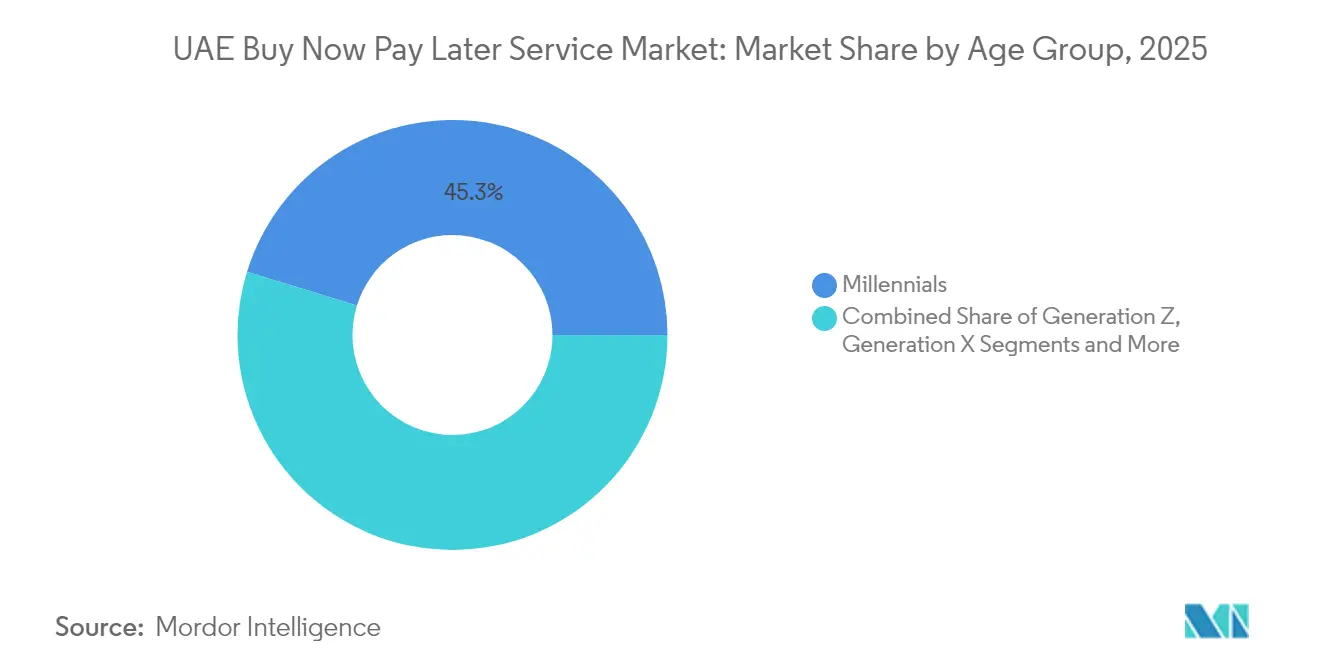
- By age group, millennials captured 45.25% share of the UAE BNPL services market in 2025, whereas Generation Z usage is set to rise at a 21.05% CAGR through 2031.
- By provider type, fintechs controlled 66.85% of the UAE BNPL services market in 2025, yet bank-led offerings are projected to advance at a 20.55% CAGR over the forecast horizon.
Note: Market size and forecast figures in this report are generated using Mordor Intelligence’s proprietary estimation framework, updated with the latest available data and insights as of 2026.
UAE Buy Now Pay Later Services Market Trends and Insights
Drivers Impact Analysis*
| Driver | (~) % Impact on CAGR Forecast | Geographic Relevance | Impact Timeline |
|---|---|---|---|
| Accelerated e-commerce growth among Gen Z & Millennials | +4.20% | Dubai, Abu Dhabi | Short term (≤ 2 years) |
| Retail-bank BNPL API integrations | +3.80% | National | Medium term (2-4 years) |
| Sharia-compliant adoption among unbanked expatriates | +5.10% | Dubai, Sharjah | Medium term (2-4 years) |
| POS financing demand from luxury retailers soaring with tourist inflows | +3.5% | Dubai, Abu Dhabi | Short term (≤ 2 years) |
| Cross-border GCC shopping supported by VAT-free re-export hubs | +2.9% | Dubai, with spillover to other emirates | Medium term (2-4 years) |
| Source: Mordor Intelligence | |||
Accelerated e-commerce growth among UAE Gen Z & Millennials
More than half of Gen Z consumers prefer digital payments, and BNPL is emerging as their favored instrument for discretionary and daily shopping. Retailers report BNPL basket sizes that are 30-50% higher than standard card purchases, prompting merchants to embed the option at checkout to boost conversion. Viral social media endorsements have normalized installment payments as a budgeting tool rather than credit substitution. Merchants now design marketing campaigns around “Pay in 4” offers timed to salary cycles, reinforcing a feedback loop of higher spend and repeat usage. As Gen Z’s purchasing power rises, lifetime customer value becomes a crucial metric for providers courting this cohort.
Retail-bank partnerships integrating BNPL APIs into mobile-bank apps
Incumbent banks are embedding BNPL modules directly inside their mobile apps, giving customers seamless access without downloading a separate fintech platform. Emirates NBD’s collaboration with Tabby showcases how bank compliance frameworks and deep data pools can lower default risk while retaining the nimble user experience of a dedicated BNPL specialist[1]Emirates NBD, “Emirates NBD and Tabby Announce Strategic BNPL Partnership,” emiratesnbd.com. Shared analytics improve credit decision accuracy, and instant installment approvals help banks cross-sell deposits and insurance. For fintechs, partnerships unlock vast customer bases at a fraction of their typical acquisition cost. The model is gaining traction across tier-one banks, signaling an era of hybrid BNPL solutions that blend regulated balance-sheet strength with specialized technology.
High adoption of Sharia-compliant installment products among unbanked expatriates
Roughly 88% of UAE residents are expatriates, many of whom are excluded from traditional credit. Sharia-compliant BNPL structures such as Murabaha and Ujrah offer interest-free flexibility that aligns with Islamic principles. Providers emphasizing religious compliance report markedly higher repeat-use rates and lower acquisition costs, as word-of-mouth spreads quickly within expatriate communities[2]Network International, “Annual Report 2025,” network.ae. The cultural resonance of fee-based rather than interest-based repayment unlocks segments such as grocery and utility payments that were previously cash-only. As GCC neighbors pursue similar regulatory clarity, the UAE model is becoming a regional blueprint for faith-aligned digital finance.
POS financing demand from luxury retailers soaring with tourist inflows
Dubai welcomed 17.15 million visitors in 2024, and luxury outlets now offer BNPL at in-store terminals to capture high-value tourist spending[3]Dubai Department of Economy and Tourism, “Dubai Tourism Performance Report 2024,” det.gov.ae. Average transaction values rise by up to 40% when split-pay options remove currency-conversion worries and card-limit constraints. Retailers gather first-party data from BNPL transactions, enabling targeted outreach once tourists return home. Partnerships with luxury brands such as Cartier and Louis Vuitton underline how BNPL has evolved from a mass-market tool to a premium retail necessity. The trend is expected to intensify as Emirates launches marketing campaigns positioning Dubai as the global capital for “luxury on installments.”
Restraints Impact Analysis*
| Restraint | (~) % Impact on CAGR Forecast | Geographic Relevance | Impact Timeline |
|---|---|---|---|
| Capital-adequacy rules for non-bank lenders | -2.70% | National | Medium term (2-4 years) |
| Merchant discontent over BNPL discount rates | -1.90% | Dubai | Short term (≤ 2 years) |
| Increasing defaults in the consumer-electronics vertical post-pandemic | -2.1% | National | Short term (≤ 2 years) |
| Regulatory Constraints on Interchange Fees for Installment Payment Schemes | -1.8% | National | Medium term (2-4 years) |
| Source: Mordor Intelligence | |||
Rising Central Bank capital-adequacy requirements for non-bank lenders
Revised regulations effective December 2023 compel BNPL firms to secure a Restricted License Finance Company status or partner with licensed institutions, tying up more capital in reserves[4]Central Bank of the UAE, “Short-Term Credit Regulations 2024,” cbuae.gov.ae. Stand-alone fintechs face higher compliance costs that can divert funds from product innovation. Smaller providers may seek buyouts, accelerating consolidation and raising entry barriers for new entrants. While enhanced solvency protects consumers, it reduces competitive diversity and could slow the pace at which niche BNPL use-cases reach the market. Larger banks with ample capital buffers stand to benefit as regulatory demands tilt the playing field in their favor.
Increasing merchant discontent with BNPL discount rates exceeding card fees
Typical BNPL merchant discount rates range from 3-7%, double the standard card fee. Electronics retailers with razor-thin margins have begun passing on BNPL surcharges to consumers or restricting availability to premium product lines. Merchant friction threatens BNPL penetration in categories where price sensitivity overrides the convenience premium. Providers experimenting with tiered fee models risk eroding profitability, especially if forthcoming interchange-fee caps further compress unit economics. Sustaining merchant enthusiasm may depend on demonstrable uplifts in basket size and conversion that offset higher acceptance costs.
*Our forecasts treat driver/restraint impacts as directional, not additive. The impact forecasts reflect baseline growth, mix effects, and variable interactions.
Segment Analysis
By Channel: Online Dominance Meets In-Store Resurgence
The online channel captured 70.85% of the UAE BNPL services market share in 2025 as frictionless digital checkouts matched the high mobile shopping appetite. E-commerce platforms embedded “Pay in 4” widgets that require minimal integration, propelling rapid uptake. Nonetheless, in-store BNPL is growing faster, with a 20.18% CAGR projected through 2031 due to QR-code and virtual-card innovations that eliminate hardware upgrades. Retailers offering unified online-offline installment experiences see higher loyalty, as consumers research online and complete big-ticket transactions in physical outlets.
Momentum toward a “phygital” ecosystem encourages providers to allocate capital to omnichannel APIs. The UAE BNPL services market size for in-store transactions is forecast to rise steeply as luxury and consumer-durable merchants enable tap-to-pay financing via existing terminals. Providers are testing features that let shoppers start a plan on-site and manage repayments in a mobile app, closing the gap between browsing and buying. As retailers add fulfillment options such as click-and-collect, channel distinctions blur, but the underlying installment logic remains central to customer conversion.


By End-Use Industry: Electronics Lead, Healthcare Accelerates
Consumer electronics dominated with 32.10% of UAE BNPL services market size in 2025, thanks to high average order values and rapid device replacement cycles that fit well with short tenures. Exclusive tie-ups with flagship smartphone and laptop brands ensure steady volume, and trade-in programs further anchor BNPL usage. Fashion and apparel follow, driven by impulse buys and high purchase frequency, though margins limit provider room to negotiate fees.
Healthcare & wellness is the fastest-growing vertical at a 22.35% CAGR to 2031, reflecting rising out-of-pocket costs for elective and cosmetic procedures. Multi-month installment plans extend beyond the typical four-payment structure, producing higher lifetime value per user. Providers form alliances with hospital networks, offering instant approvals through patient portals that bypass lengthy paperwork. This diversification reduces dependency on retail cycles and positions BNPL as an integral component of the UAE’s private-health financing landscape.
By Age Group: Millennials Hold Sway While Gen Z Surges
Millennials secured 45.25% UAE BNPL services market share in 2025, combining stable incomes with digital fluency. Their adoption spans essential and lifestyle spending, from groceries to travel, and average ticket sizes surpass other cohorts. Generation X favors BNPL for specific high-value categories, moderating overall momentum but contributing steady volumes.
Generation Z is the quickest adopter, expected to climb at a 21.05% CAGR through 2031. Mobile-first design, transparent fee structures, and gamified rewards align with Gen Z values. Providers emphasize social-commerce integrations that let users spread payments from within influencer storefronts. As this cohort approaches peak earning years, its share of the UAE BNPL services market size is set to expand, compelling providers to pivot marketing budgets toward student and first-job segments.
By Provider: Fintech First Movers, Bank Fast Followers
Fintechs held 66.85% of transaction volume in 2025, leveraging purpose-built platforms optimized for rapid onboarding and flexible repayment management. Product rollouts—virtual cards, open-loop networks, merchant marketplaces—keep customer engagement high. Yet banks are gaining ground with a forecast 20.55% CAGR, integrating BNPL modules into existing credit infrastructures.
This convergence yields hybrid models where banks handle regulatory risk and balance-sheet funding, while fintechs supply front-end agility. For consumers, the distinction blurs as white-labeled solutions surface within banking apps. Over time, the UAE BNPL services market share held by fintechs may decline modestly as universal banks convert cardholders to in-app split-pay plans, tightening competitive dynamics and nudging pricing toward parity.
Geography Analysis
Dubai generates roughly 60% of national BNPL transaction volume, benefiting from dense luxury retail districts, a thriving fintech sandbox, and a tourist influx that values flexible payment options. The emirate’s malls prominently display BNPL at checkout, and major providers maintain headquarters in Dubai, reinforcing the innovation ecosystem. Regulatory support via the Dubai International Financial Centre’s Innovation Hub accelerates pilot programs, making the city a testbed for installment-payment innovation.
Abu Dhabi ranks second, underpinned by higher average incomes and significant government spending on digital infrastructure. Healthcare and education payments represent a sizable share of BNPL usage here, as affluent households finance elective procedures and private-school fees. Hub71’s start-up environment attracts capital for vertical-specific BNPL platforms targeting the emirate’s distinct demographic profile. Consistent federal guidelines ease compliance, enabling providers to scale offerings seamlessly across both major emirates.
Sharjah, Ajman, and the Northern Emirates contribute smaller volumes but exhibit the fastest user-growth rates. Lower retail saturation allows BNPL providers to lock in exclusive agreements with merchants eager for differentiation. Arabic-first interfaces and explicit Sharia compliance resonate strongly with residents, many of whom are first-time users of formal credit. Smartphone penetration continues to rise, and providers leverage social outreach to build trust, propelling uptake in everyday categories such as groceries and household utilities.
Competitive Landscape
The UAE BNPL services market is moderately concentrated, with a few key providers collectively handling a significant portion of the volume. Tabby leads with the broadest merchant network and top-of-mind consumer awareness, while Tamara’s rapid GCC expansion strengthens regional scale. Competition centers on approval speed, transaction limits, and loyalty ecosystem perks rather than tenure length, which is fairly standardized across the industry.
Strategic partnerships shape market dynamics. Checkout.com’s integration with Tabby embeds BNPL into a wide merchant base, while Emirates NBD’s alliance with Tabby fuses bank-grade compliance with fintech agility. Consolidation is underway: Spotii’s acquisition by NymCard indicates infrastructure providers’ appetite to fold BNPL into broader payment stacks. Artificial-intelligence-driven credit models using alternative data seek to reduce default rates and defend margins amid forthcoming fee-cap regulations. Providers targeting niche verticals—healthcare, education, and B2B trade—could unlock incremental growth and dilute concentration over time.
Legacy card issuers face cannibalization risk and are piloting “split-pay on existing credit limits” to defend wallet share. Meanwhile, global payment networks explore white-label agreements to overlay installment logic on international rails, potentially intensifying rivalry. Rising capital requirements may push undercapitalized fintechs toward mergers, gradually lifting average provider size and solidifying market structure.
UAE Buy Now Pay Later Services Industry Leaders
Tabby
Tamara
Cashew Payments
Postpay
Spotii (Zip Co)
- *Disclaimer: Major Players sorted in no particular order

Recent Industry Developments
- March 2025: Checkout.com formed a strategic partnership with Tabby to expand BNPL solutions for retailers in the UAE and Saudi Arabia. This integration allows merchants to offer seamless payment methods through Checkout.com's platform, capitalizing on the region's high BNPL adoption rates of 39% in the UAE and 42% in Saudi Arabia.
- February 2025: Mastercard partnered with Tamara to launch a virtual card in the UAE, enhancing the split payment ecosystem. This initiative aims to change the conservative perception of BNPL by promoting its use for daily expenditures, with the virtual card allowing users to split purchases into four payments or pay in full, compliant with Sharia law.
- February 2025: Tabby secured USD 160 million in funding at a valuation of USD 3.3 billion, doubling its previous valuation and establishing it as the UAE's most valuable fintech. This substantial investment will fund Tabby's expansion beyond core BNPL services into broader financial offerings, including banking and investment products.
- September 2024: Network International partnered with ruya Bank to enhance Islamic banking through digital payment technology, integrating Sharia-compliant BNPL options into the bank's service portfolio. This collaboration aims to provide seamless digital banking experiences while adhering to Islamic finance principles, expanding access to BNPL services among religiously observant consumers.


Research Methodology Framework and Report Scope
Market Definitions and Key Coverage
Our study defines the UAE buy-now-pay-later (BNPL) services market as the total value of short-term, interest-free installment plans offered by licensed fintechs, banks, and merchants, both online and at point-of-sale, for consumer purchases settled within twelve months.
Scope exclusion: business-to-business invoice financing products fall outside this assessment.
Segmentation Overview
- By Channel
- Online
- Point-of-Sale (In-store)
- By End-Use Industry
- Consumer Electronics
- Fashion & Apparel
- Healthcare & Wellness
- Home Improvement
- Travel & Leisure
- Media & Entertainment
- Other End-Use Industries
- By Age Group
- Generation Z (18-28 Years)
- Millennials (29-44 Years)
- Generation X (45-60 Years)
- Baby Boomers (61-79 Years)
- Silent Generation (80 Years and Above)
- By Provider
- Fintechs
- Banks
- Others
Detailed Research Methodology and Data Validation
Primary Research
Mordor analysts held structured interviews with BNPL executives, payment-gateway integrators, and mid-tier retailers across Dubai, Abu Dhabi, and Sharjah. We also surveyed millennial and Gen Z shoppers to verify incidence rates, repayment behavior, and preferred tenure, letting us refine default assumptions and seasonality patterns.
Desk Research
We began by mapping the payments landscape using public sources such as the UAE Central Bank's Finance-Company directives, Dubai Statistics Center retail sales dashboards, Telecommunications and Digital Government Authority smartphone-penetration files, and trade data from UAE Customs. Insights were supplemented with Emirates NBD investor presentations, merchant take-rate disclosures in Tabby's 2024 bond deck, and news archives retrieved from Dow Jones Factiva. Regulatory notices clarified licence thresholds, while industry associations, like the Retail Business Group and the Arab Fintech Forum, helped size merchant acceptance points. These resources anchor channel splits and average ticket sizes before we layer proprietary figures from D&B Hoovers on provider revenue. The list is illustrative; our analysts review many additional documents to cross-check facts and plug data gaps.
Market-Sizing & Forecasting
A top-down construct starts with household consumption in electronics, fashion, healthcare, and home improvement, then applies BNPL penetration rates observed in card-acquiring datasets and survey responses. Resulting values are validated through selective bottom-up tests, merchant checkout volumes multiplied by sampled average selling prices and provider fee yields. Key variables include e-commerce GMV growth, smartphone adoption, retail footfall indices, central-bank licence issuances, and average merchant discount rate trends. A multivariate regression with ARIMA overlays projects each driver to 2030; scenario bands are stress-tested with expert feedback. Where provider roll-ups miss micro-merchants, spend shares are interpolated using POS device shipment data.
Data Validation & Update Cycle
Outputs undergo variance checks against independent payment volumes, followed by peer review and a senior analyst sign-off. Models refresh every twelve months, with interim updates triggered by material events such as regulatory changes or large capital raises; a final sweep is completed immediately before publication.
Why Our UAE Buy Now Pay Later Services Baseline Commands Reliability
Published estimates diverge because firms choose different service scopes, value definitions, and refresh cadences.
Key gap drivers include whether gross merchandise value or provider revenue is counted, the treatment of deferred-fee POS plans, and currency conversions at constant versus current dirham. Mordor reports state a 2025 market value of USD 4.25 billion, built from shopper-level demand and validated with provider roll-ups, whereas others lean on single-source merchant data or regional averages.
Benchmark comparison
| Market Size | Anonymized source | Primary gap driver |
|---|---|---|
| USD 4.25 B (2025) | Mordor Intelligence | - |
| USD 2.45 B (2024) | Regional Consultancy A | Counts only e-commerce GMV, excludes in-store plans |
| USD 0.13 B (2024) | Trade Journal B | Measures provider fee revenue, not transaction value |
| USD 0.05 B (2024) | Global Consultancy C | Uses retail sample confined to Dubai luxury segment |
In sum, our disciplined scope selection, mixed-method modelling, and annual refresh cycle give decision-makers a balanced, transparent baseline they can retrace and reuse with confidence.


Key Questions Answered in the Report
What is the current size of the UAE BNPL services market?
The UAE BNPL services market is valued at USD 5.02 billion in 2026 and is projected to reach USD 11.49 billion by 2031.
Which industry segment uses BNPL the most in the UAE?
Consumer electronics leads, capturing 32.10% of 2025 transaction value, driven by high average ticket sizes and rapid device replacement cycles.
How fast is point-of-sale BNPL growing compared with online BNPL?
In-store BNPL is forecast to expand at a 20.18% CAGR during 2026-2031, outpacing growth in the already-dominant online channel.
Why are Sharia-compliant BNPL products important in the UAE?
They appeal to the country’s large expatriate and Muslim populations by avoiding interest charges, thereby boosting adoption and customer loyalty.
Which age group is the fastest-growing BNPL user segment?
Generation Z users are expected to grow usage at a 21.05% CAGR through 2031, reflecting their digital-native habits and preference for transparent payment plans.
Page last updated on:


