Tower Cranes Market Size and Share
Market Overview
| Study Period | 2019 - 2031 |
|---|---|
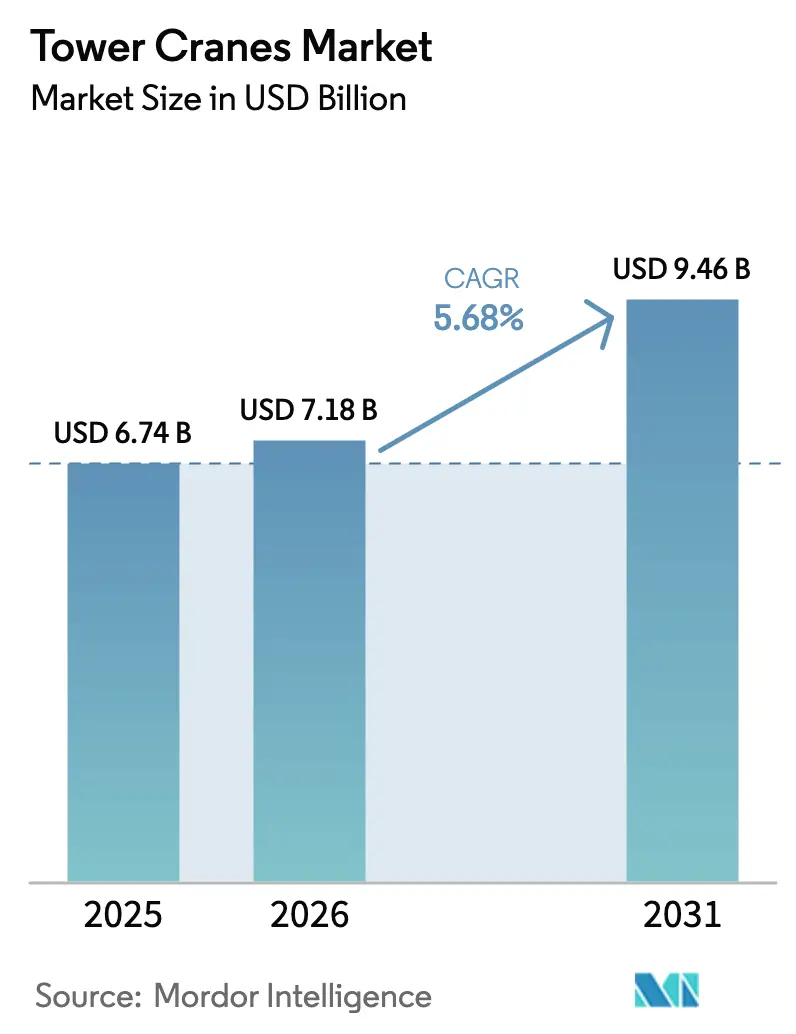
| Market Size (2026) | USD 7.18 Billion |
| Market Size (2031) | USD 9.46 Billion |
| Growth Rate (2026 - 2031) | 5.68% CAGR |
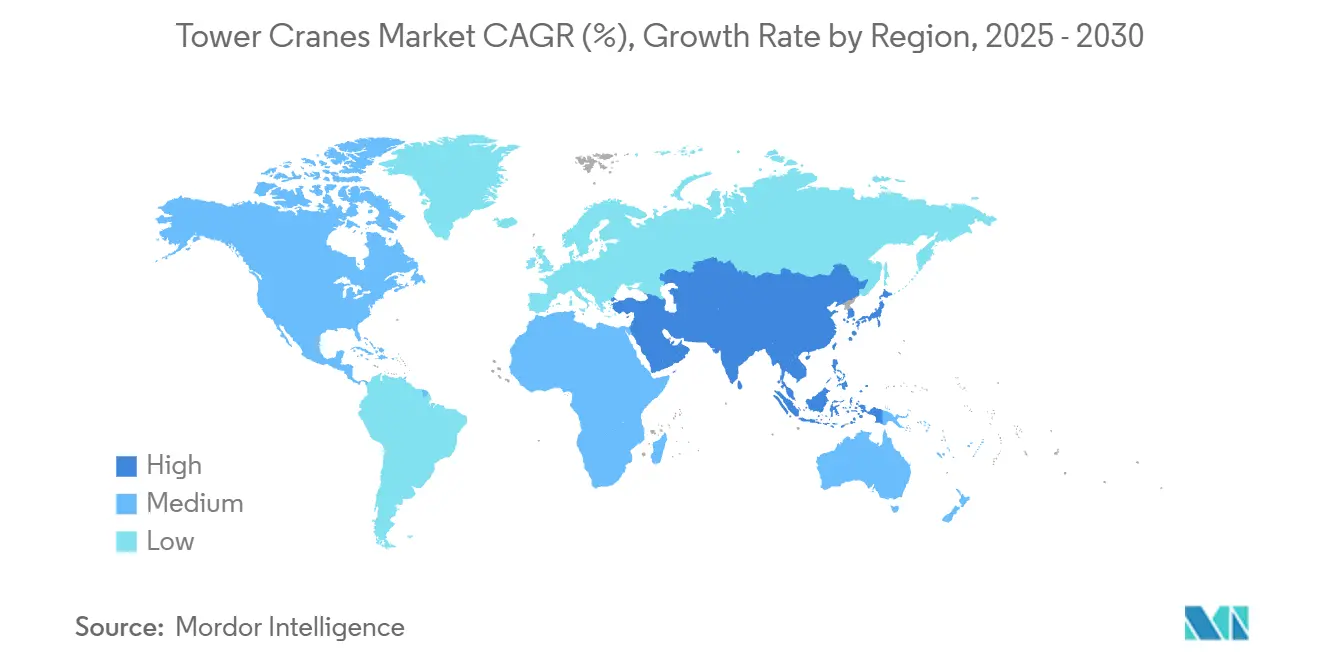
| Fastest Growing Market | Asia-Pacific |
| Largest Market | Asia-Pacific |
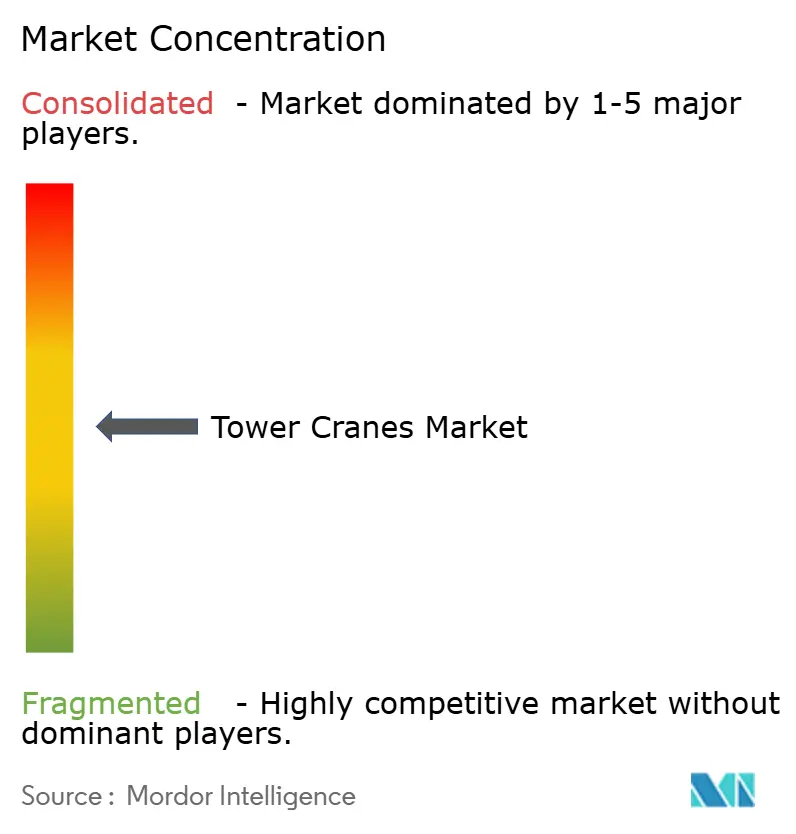
| Market Concentration | Medium |
Major Players
*Disclaimer: Major Players sorted in no particular order Image © Mordor Intelligence. Reuse requires attribution under CC BY 4.0. |
|
Tower Cranes Market Analysis by Mordor Intelligence
The tower cranes market size was valued at USD 6.74 billion in 2025 and is estimated to grow from USD 7.18 billion in 2026 to reach USD 9.46 billion by 2031, at a CAGR of 5.68% during the forecast period (2026-2031). Robust urban rail build-outs in the Asia-Pacific, ambitious giga-projects across the Gulf, and tightening EU zero-emission rules anchor near-term demand. Yet the volume picture is shifting: Chinese super-tall completions slowed while stalled projects climbed, pushing domestic fleets to seek work abroad. Rental penetration, digital-twin deployment, and electrification mandates are now shaping procurement faster than traditional ownership models can adapt. Competitive advantage increasingly rests on predictive-maintenance software, battery-hybrid power units, and the ability to mobilize mid-capacity cranes for modular construction schedules.
Key Report Takeaways
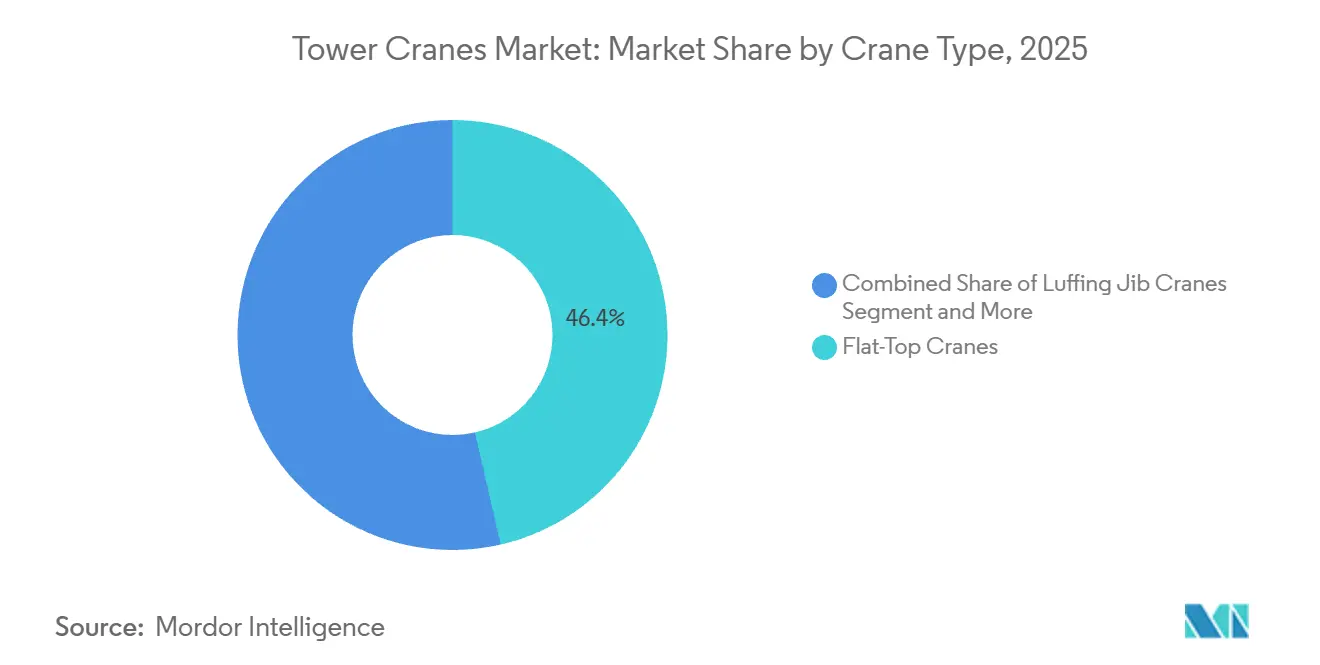
- Flat-top cranes captured 46.37% revenue in 2025, while self-erecting units clocked the fastest 7.52% CAGR through 2031.
- The 6-10 ton bracket held 37.25% of the tower cranes market share in 2025 and will expand at a 6.88% CAGR to 2031.
- Top-slewing designs secured 78.04% demand in 2025 and are forecast to advance at a 6.83% CAGR to 2031.
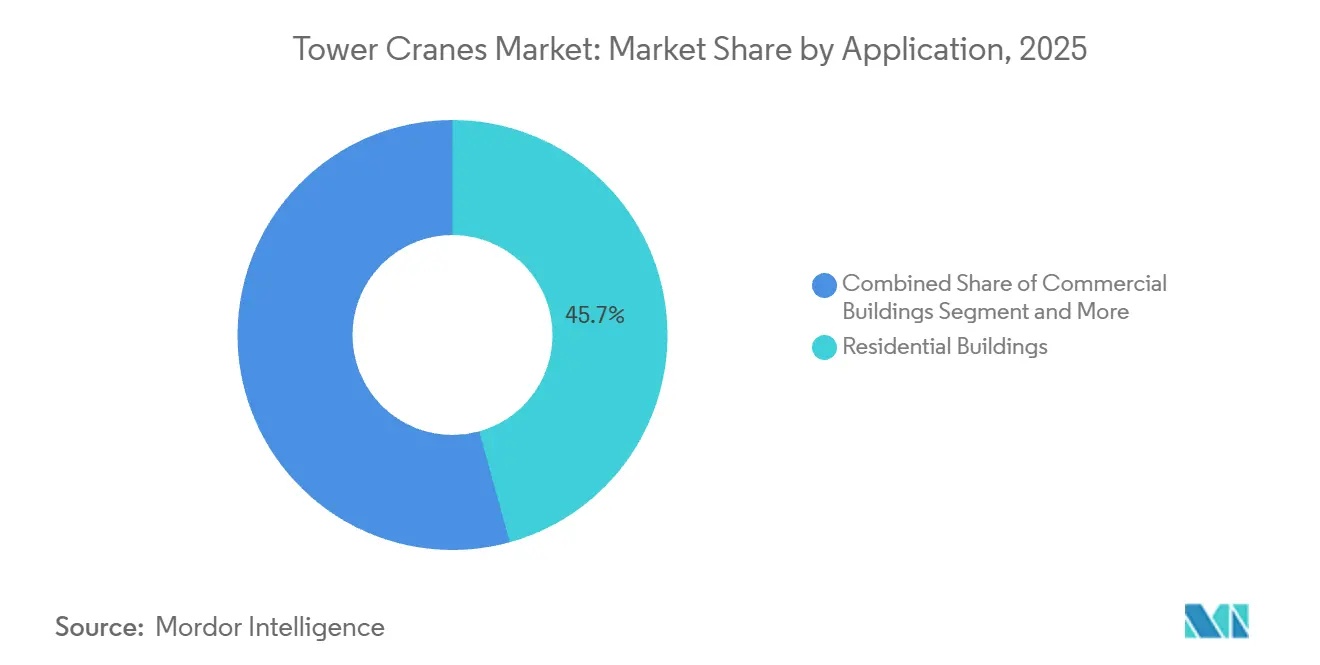
- Residential buildings represented 45.73% of applications in 2025; infrastructure projects are set to grow at a 7.19% CAGR.
- Construction companies commanded 55.02% end-user revenue in 2025, while rental firms will rise at a 6.38% CAGR, underscoring the structural pivot to leasing.
- Asia-Pacific accounted for 46.14% of the market revenue in 2025 and is projected to grow at an 8.12% CAGR, highlighting its dominance and rising demand.
Note: Market size and forecast figures in this report are generated using Mordor Intelligence’s proprietary estimation framework, updated with the latest available data and insights as of January 2026.
Global Tower Cranes Market Trends and Insights
Drivers Impact Analysis*
| Driver | (~) % Impact on CAGR Forecast | Geographic Relevance | Impact Timeline |
|---|---|---|---|
| Rapid Urbanization and Super-Tall Construction Boom | +1.2% | Asia-Pacific core (China, India), spill-over to GCC (UAE, Saudi Arabia) | Medium term (2-4 years) |
| Infrastructure Stimulus Programmes in Asia and GCC | +1.1% | Asia-Pacific (China, India), Middle East (UAE, Saudi Arabia, Qatar) | Long term (≥ 4 years) |
| Shift to Rental Model Among Contractors | +0.9% | Global, with early gains in North America, Europe, Asia-Pacific | Medium term (2-4 years) |
| Digital-Twin, IoT and Remote-Operation Adoption | +0.7% | North America, Europe, Asia-Pacific tier-1 contractors | Medium term (2-4 years) |
| Electrification Mandates for Zero-Emission Sites | +0.5% | Europe (EU EPBD), North America (California CARB), select Asia-Pacific cities | Short term (≤ 2 years) |
| Advancements in Safety and Automation Technologies | +0.6% | Global, with regulatory push in EU (EN 17076:2020) and North America (OSHA 1926.1435) | Short term (≤ 2 years) |
| Source: Mordor Intelligence | |||
Rapid Urbanization and Super-Tall Construction Boom
The Council on Tall Buildings and Urban Habitat tallied 2,583 buildings above 200 m completed globally by 2025, with 141 new additions that year[1]"CVU 2026 Trends & Forecasts," Council on Vertical Urbanism, skyscrapercenter.com.. China accounted for 65% of these completions, yet 259 other projects stalled, exposing a decoupling of groundbreaks from actual crane utilization. Average completion times stretched to 5.8 years, lengthening rental tenures and shifting value toward firms with deep maintenance networks. High-rise activity is migrating to the Gulf, where the resumed 1,000 m Jeddah Tower and 725 m Burj Azizi anchor multiyear pipelines. OEMs with established Riyadh or Dubai service hubs, such as Wolffkran, are positioned to capture this pivot. In contrast, Chinese brands that over-indexed on domestic tall-building cycles face utilisation gaps abroad.
Infrastructure Stimulus Programs in Asia and GCC
China’s Belt and Road Initiative booked USD 70.7 billion of construction contracts in 2024[2]Neil Gerrard, "How China is winning more construction work through the Belt and Road Initiative, as deal sizes rise," Construction Briefing, constructionbriefing.com., with the Middle East replacing Africa as the top recipient at USD 39 billion. India’s metro footprint reached 945 km in service, with another 939 km underway, while its highway program averages 34 km of construction per day. Saudi Arabia’s Vision 2030 slate, led by NEOM and The Line, could need roughly 20,000 tower cranes if plans materialize. Large, overlapping infrastructure schemes lock in multiyear demand, although execution risks, ranging from funding delays to labor shortages, temper the headline numbers.
Shift to Rental Model Among Contractors
More than half of large construction and infrastructure projects now rely on rented lifting equipment rather than outright ownership, reflecting a structural shift in procurement strategy. Developers and EPC contractors increasingly prioritize asset-light models that preserve balance sheets, reduce upfront capital expenditure, and transfer maintenance, certification, and residual-value risks to rental providers. This approach is particularly attractive in volatile interest-rate environments, where financing costs for heavy equipment purchases can materially impact project IRRs. Rental firms also bundle value-added services, such as telematics monitoring, operator training, and rapid on-site technical support, further strengthening the case for outsourced lifting capacity on complex, multi-phase builds.
Digital-Twin, IoT, and Remote Operation Adoption
Research at Lancaster University logged 93.85% object-detection accuracy for crane digital twins using YOLOv5x, enabling real-time collision avoidance. An IEEE study reported 20% faster positioning cycles enabled by service-oriented autonomous systems. ISO 12480-3:2019 now requires event data recorders, entwining telematics with basic safety compliance. Tier-1 rental houses embed these systems as contract prerequisites, while mid-tier players struggle to absorb software licenses and sensor retrofits, widening the technology gap.
Restraints Impact Analysis*
| Restraint | (~) % Impact on CAGR Forecast | Geographic Relevance | Impact Timeline |
|---|---|---|---|
| Steel Price and Supply-Chain Volatility | -0.8% | Global, with acute impact in North America (tariffs), Europe (energy costs) | Short term (≤ 2 years) |
| Skilled Operator Shortage and Ageing Workforce | -0.6% | North America, Europe, select Asia-Pacific markets (Japan, South Korea) | Medium term (2-4 years) |
| Stricter EU/OSHA Safety Compliance Costs | -0.4% | Europe (EU Machinery Regulation 2023/1230), North America (OSHA 1926.1435) | Short term (≤ 2 years) |
| Competition from High-Capacity Mobile Cranes in Mid-Rise Jobs | -0.3% | North America, Europe, select urban markets | Medium term (2-4 years) |
| Source: Mordor Intelligence | |||
Steel Price and Supply-Chain Volatility
U.S. Bureau of Labor Statistics data show the crane-parts producer-price index jumping 10% between December 2024 and March 2025. Section 232 tariff extensions set to take effect in 2026 will apply a roughly 50% tax on the steel content of imported mobile cranes, raising concerns about cascading cost pressure on tower units. European fabricators, meanwhile, face electricity costs several multiples of U.S. averages, squeezing margins even on electric-drive models. Chinese OEMs respond by localizing assembly in Saudi Arabia and the UAE to dodge tariffs, but geographic dispersion increases inventory carrying costs and parts logistics complexity.
Stricter EU/OSHA Safety Compliance Costs
The EU Machinery Regulation 2023/1230[3]"Regulation 2023/1230/EU - machinery," EU-OSHA, osha.europa.eu., effective January 2027, mandates digital product passports and life-cycle environmental analysis, pushing compliance costs up by 8-12% for importers. OSHA standards in North America similarly require additional limiting devices and record-keeping, raising retrofit expenses for older fleets. Large OEMs can amortize certification across high volumes, whereas SMEs and gray-import traders face margin erosion or exit.
*Our forecasts treat driver/restraint impacts as directional, not additive. The impact forecasts reflect baseline growth, mix effects, and variable interactions.
Segment Analysis
By Crane Type: Flat-Top Dominance Meets Self-Erecting Surge
Flat-top designs delivered 46.37% of 2025 revenue. Their collar-free mast segments allow multiple units to overlap jibs without interference, a key benefit in dense high-rise clusters. The tower crane market for self-erecting models is projected to grow at a 7.52% CAGR, outpacing all other types as European and North American residential contractors adopt single-day set-ups that bypass external erection cranes.
Self-erectors such as Manitowoc’s Potain Hup 40-30 (4 t, 30 m jib) compress start-to-lift timelines from days to hours, saving labor and street-closure permits. Meanwhile, SANY’s STT3330 flat-top reaches 3,300 t-m and 330 m hook height, underscoring that capacity ceilings continue to rise. Luffing-jib units defend tight air rights corridors near airports. At the same time, climbable in-building cranes remain indispensable for the mega-tall niche, though their order flow now centres on Gulf state projects.


By Lifting Capacity: Mid-Range Efficiency Drives Share
Cranes rated 6-10 ton captured 37.25% of revenue in 2025, the most significant slice of the tower cranes market. Prefabricated façade and modular pod lifts rarely exceed this window, explaining a 6.88% forecast CAGR. The tower crane market size for the 11-16 ton bracket also benefits from modular trends, but grows more slowly as heavier picks require more extended permit lead times.
Liebherr’s 550 EC-B 12 Fiber (12 t, 70 m jib) hits the mid-range sweet spot with four-ton tip loads, while Wolffkran’s 7534.16 pushes to 16 t without enlarging the ground footprint. Above 25 t, utilization turns episodic and project-specific—SANY’s STT2400 (2,400 t-m) only pays off on skyline-defining cores or industrial heavy-lift jobs. At the low end, sub-5 t self-erectors are growing in Europe’s townhouse renovations but remain marginal in Asia, where labor-friendly regulations and higher site densities still favor larger, shared units.
By Design: Top-Slewing Efficiency Anchors Market
Top-slewing cranes cornered 78.04% of 2025 revenue and should post a 6.83% CAGR. Their rotating upperworks trim the on-ground exclusion zone, which is critical on city infill sites, and make zoning sensors easier to mount. ISO and CEN safety rules now reference data-logger placement, allowing top-mounted platforms to house them without extra brackets, cementing their engineering edge.
Bottom-slewing units stay relevant for shipyards and industrial parks where hook radii exceed 60 m and ground clearances are generous. Yet new top-slewers such as Zoomlion’s T8030-25UE (800 t-m) blur the heavy-lift boundary, narrowing bottom-slewers’ traditional turf. As sensor packages and fibre ropes spread, speed gains further tilt preference toward top-rotation formats.
By Application: Infrastructure Growth Outpaces Buildings
Residential buildings accounted for 45.73% of 2025 deployments, but infrastructure projects are forecast to be the fastest-growing segment at a 7.19% CAGR. Metro viaducts, long-span bridges, and logistics corridors in the Asia-Pacific and the Middle East demand longer hook reaches and endurance picks rather than sheer load.
Saudi giga-projects alone may need close to 20,000 tower units this decade if timetables stick, dwarfing many national building markets. Conversely, office-tower pipelines in Europe and North America softened as hybrid work persisted, though data-center shells and life-science labs helped offset some of the slack. Marine/offshore wind installations add a nascent but rising demand pool, particularly in the North Sea and off China’s Fujian coast.
By End User: Rental Firms Overtake Ownership
Construction companies accounted for 55.02% of 2025 sales, yet rental providers are on course for a 6.38% CAGR, capturing share as financing rates remain elevated. The tower crane market share commanded by rental fleets has widened, partly because compliance costs and telematics subscriptions scale more easily across pooled assets.
North American top-five rental houses trimmed units but hired more technicians, signaling a pivot to uptime guarantees rather than fleet expansion. In China, rate wars pushed operators abroad, illustrating both the strength and peril of the rental thesis when local cycles falter. Industrial owners—mines and refiners—remain purchase-driven but constitute a shrinking share of global volume.
Geography Analysis
Asia–Pacific shoulders the highest crane volumes due to China’s 10,287 km operational metro grid across 55 cities and India’s twin-track rail and metro boom. Yet oversupply in China drove a 20% erosion in rental rates in 2024, compelling fleets to redeploy into the Philippines, Vietnam, and Gulf projects. Super-tall completions slowed even as starts linger, decoupling headline construction activity from actual tower-crane hours. The Middle East soaks up excess capacity, with Saudi Arabia’s Vision 2030 corridor and the UAE’s ever-expanding Dubai skyline setting the pace. Wolffkran’s new Riyadh joint venture has already bid for 90 units, reflecting the region’s service network premium. Execution risk remains: Jeddah Tower only resumed in 2024 after a multiyear pause, underscoring schedule volatility.
Europe’s outlook is regulatory-heavy. The EU Machinery Regulation 2023/1230 and Construction Products Regulation 2024/3110 layer digital passport and life-cycle duties on importers, reducing compliance spend by 8-12%. Germany, France, and the UK concentrate demand, but EU construction contracted 2.1% in 2024, tempering prospects. Offshore wind foundations in the North Sea support specialized tower and luffer demand despite broader building weakness. North America wrestles with steel tariffs that inflate mobile-crane costs by up to 45%, indirectly nudging contractors toward tower models for multi-year high-rise jobs. Equipment-rental revenues hit record highs, yet fleet counts slipped as firms de-emphasized ownership. Infrastructure Investment and Jobs Act funds cushion any residential slowdown, keeping bridge and rail projects in the queue.
South America’s growth hinges on Brazil’s revived Growth Acceleration Program, targeting 2 million housing units by 2026, and on multi-line São Paulo metro extensions. However, currency swings and uneven skill availability blur the outlook. Africa remains nascent, with mining shafts and select skyline projects in South Africa and Nigeria the main bright spots.

Competitive Landscape
The global tower crane market remains moderately concentrated, with leading OEMs such as Liebherr, Manitowoc, Terex, XCMG, Zoomlion, and SANY maintaining strong positions through extensive product portfolios, regional expansion, and robust service networks. Chinese manufacturers leverage volume advantages, aggressive pricing, and localized assembly to capture emerging markets. At the same time, European and North American stalwarts focus on premium engineering, telematics, and hybrid power solutions to differentiate their offerings. Strategic partnerships, service contracts, and regional production hubs are increasingly central to defending market share and expanding in high-growth geographies like Asia-Pacific.
Technological differentiation is emerging as a key competitive axis. Innovations such as digital twins achieving over 90% detection accuracy, autonomous cycle optimization, and advanced remote diagnostics remain confined mainly to tier-1 fleets. These innovative technologies enhance predictive maintenance, operational efficiency, and safety, giving early adopters a tangible advantage. However, most mid-tier and smaller fleets continue to rely on conventional cranes, highlighting a gap between cutting-edge innovation and widespread adoption.
White-space opportunities are clustered around electrification retrofits, self-erecting cranes for mid-rise construction, and AI-based job-site optimization. Used-equipment platforms help bridge cost gaps but face residual-value challenges when new safety or emissions regulations emerge. As demand for smarter, greener, and more efficient construction grows, the competitive landscape will increasingly favor players who combine technological leadership with scale, service excellence, and regional adaptability.
Tower Cranes Industry Leaders
-
Terex Corporation
-
The Manitowoc Company, Inc.
-
Zoomlion Heavy Industry Science&Technology Co., Ltd.
-
Liebherr Group
-
SANY Group
- *Disclaimer: Major Players sorted in no particular order

Recent Industry Developments
- January 2026: Hong Kong authorities announced that, starting April 1, 2026, all government construction projects must equip tower cranes with ground‑based remote‑control and monitoring systems in a bid to improve safety and productivity on dense urban sites.
- March 2024: The Manitowoc Company Inc. introduced a new Potain crane, the MCR 625 luffing jib tower crane, targeting Asia, the Middle East, and Latin America.
- February 2024: Terex Corporation expanded its City Class range by introducing the CTT 152-6 flat top. This new model comes with two winch options, 18 kW and 22 kW, enabling lifting speeds of up to 104 m/min. The CTT 152-6 boasts a maximum capacity of 6 tons and a tipping load of 1.7 t when using Terex Power Plus.


Global Tower Cranes Market Report Scope
Tower cranes are a type of construction machine equipped with a hoist, rope, and chain and used to lower, lift, and move heavy or bulk construction materials around.
The tower crane market is segmented by crane type, lifting capacity, end user, and geography. By crane type, the market is segmented into hammerhead tower cranes, luffing tower cranes, and self-erecting tower cranes. By lifting capacity, the market is segmented into up to 5 tons, 5-10 tons, 11-16 tons, 17-25 tons, and above 25 tons. By end user, the market is segmented into infrastructure, residential buildings, commercial buildings, mining and excavation, and other end users (marine, offshore, etc.). By geography, the market is segmented into North America, Europe, Asia-Pacific, and Rest of the World. For each segment, the market sizing and forecast have been done based on value (USD).
| Hammerhead Cranes |
| Flat-Top Cranes |
| Luffing Jib Cranes |
| Self-Erecting Cranes |
| Climbable Tower Cranes |
| Up to 5 ton |
| 6–10 ton |
| 11–16 ton |
| 17–25 ton |
| Above 25 ton |
| Top-Slewing |
| Bottom-Slewing |
| Residential Buildings |
| Commercial Buildings |
| Infrastructure Projects |
| Mining and Excavation |
| Industrial Projects |
| Marine/Offshore |
| Construction Companies |
| Rental Companies |
| Industrial Operators |
| Others |
| North America | United States |
| Canada | |
| Rest of North America | |
| South America | Brazil |
| Argentina | |
| Rest of South America | |
| Europe | Germany |
| United Kingdom | |
| France | |
| Italy | |
| Spain | |
| Rest of Europe | |
| Asia-Pacific | China |
| India | |
| Japan | |
| South Korea | |
| Rest of Asia-Pacific | |
| Middle East and Africa | United Arab Emirates |
| Saudi Arabia | |
| South Africa | |
| Turkey | |
| Rest of Middle East and Africa |
| By Crane Type | Hammerhead Cranes | |
| Flat-Top Cranes | ||
| Luffing Jib Cranes | ||
| Self-Erecting Cranes | ||
| Climbable Tower Cranes | ||
| By Lifting Capacity | Up to 5 ton | |
| 6–10 ton | ||
| 11–16 ton | ||
| 17–25 ton | ||
| Above 25 ton | ||
| By Design | Top-Slewing | |
| Bottom-Slewing | ||
| By Application | Residential Buildings | |
| Commercial Buildings | ||
| Infrastructure Projects | ||
| Mining and Excavation | ||
| Industrial Projects | ||
| Marine/Offshore | ||
| By End User | Construction Companies | |
| Rental Companies | ||
| Industrial Operators | ||
| Others | ||
| By Geography | North America | United States |
| Canada | ||
| Rest of North America | ||
| South America | Brazil | |
| Argentina | ||
| Rest of South America | ||
| Europe | Germany | |
| United Kingdom | ||
| France | ||
| Italy | ||
| Spain | ||
| Rest of Europe | ||
| Asia-Pacific | China | |
| India | ||
| Japan | ||
| South Korea | ||
| Rest of Asia-Pacific | ||
| Middle East and Africa | United Arab Emirates | |
| Saudi Arabia | ||
| South Africa | ||
| Turkey | ||
| Rest of Middle East and Africa | ||


Key Questions Answered in the Report
What is the forecast value of the tower cranes market by 2031?
The tower cranes market is projected to reach USD 9.46 billion by 2031, growing at a 5.68% CAGR from 2026.
Which crane type is expanding the fastest?
Self-erecting models are forecast to advance at 7.52% CAGR through 2031, buoyed by rapid-setup residential jobs.
How are rental trends influencing procurement?
Rental firms are expected to grow at 6.38% CAGR as contractors favor variable-cost leasing and outsource maintenance.
Which region will add the most new tower cranes?
The Middle East, led by Saudi Arabia’s Vision 2030 giga-projects, is poised for the sharpest fleet expansion this decade.
What role does electrification play in future demand?
EU and California zero-emission mandates are accelerating uptake of battery-hybrid power packs and plug-in tower cranes on urban jobsites.
How will steel tariffs affect crane choices in North America?
Section 232 expansions lifting mobile-crane prices up to 45% are likely to make tower cranes more cost-competitive for long-duration high-rise projects.
Page last updated on:


