Tomato Market Analysis by Mordor Intelligence
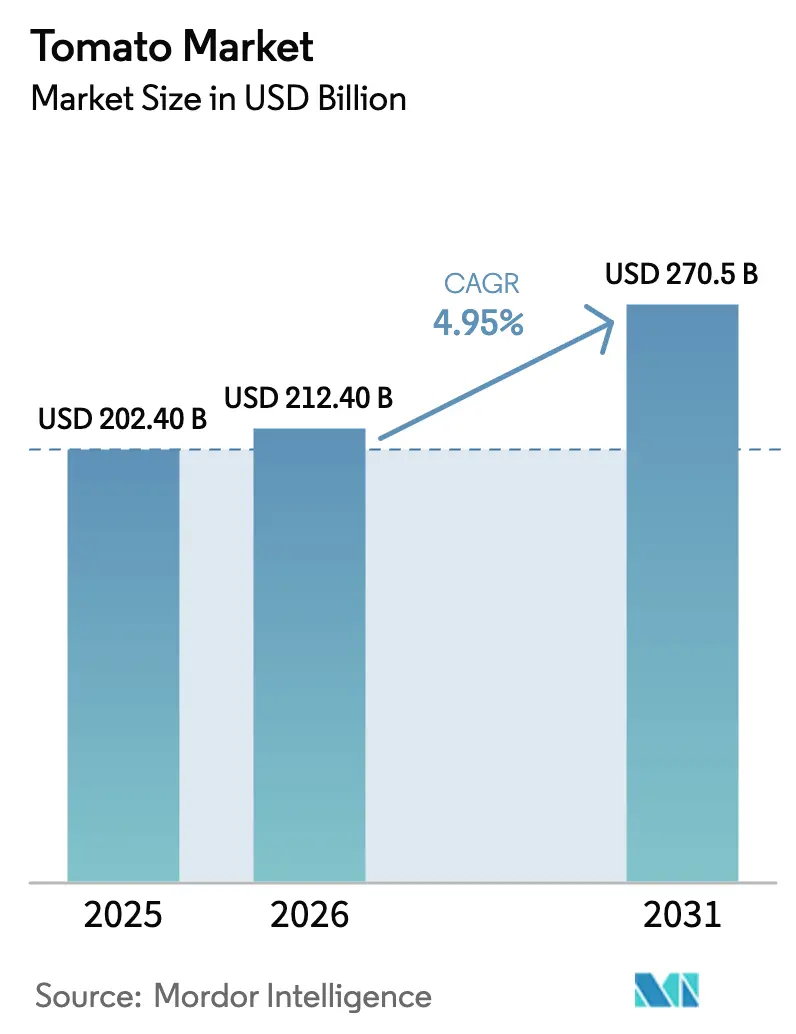
The tomato market value is projected to expand from USD 202.4 billion in 2025 and USD 212.4 billion in 2026 to USD 270.5 billion by 2031, registering a CAGR of 4.95% between 2026 to 2031. Surging demand for paste in quick-service restaurants, rapid adoption of greenhouse technology, and steady urban population growth are the primary drivers shaping the tomato commodity market. Producers in water-scarce regions are investing in drip irrigation while import-dependent nations are scaling domestic processing to curb trade deficits. Technology-led greenhouse clusters in the Netherlands, Mexico, and Japan now deliver yields that are two to three times higher than open-field benchmarks, thereby tightening global competition. At the same time, climate volatility, carbon-footprint scrutiny, and price swings of up to 60% per season continue to pressure margins across the supply chain.
Key Report Takeaways
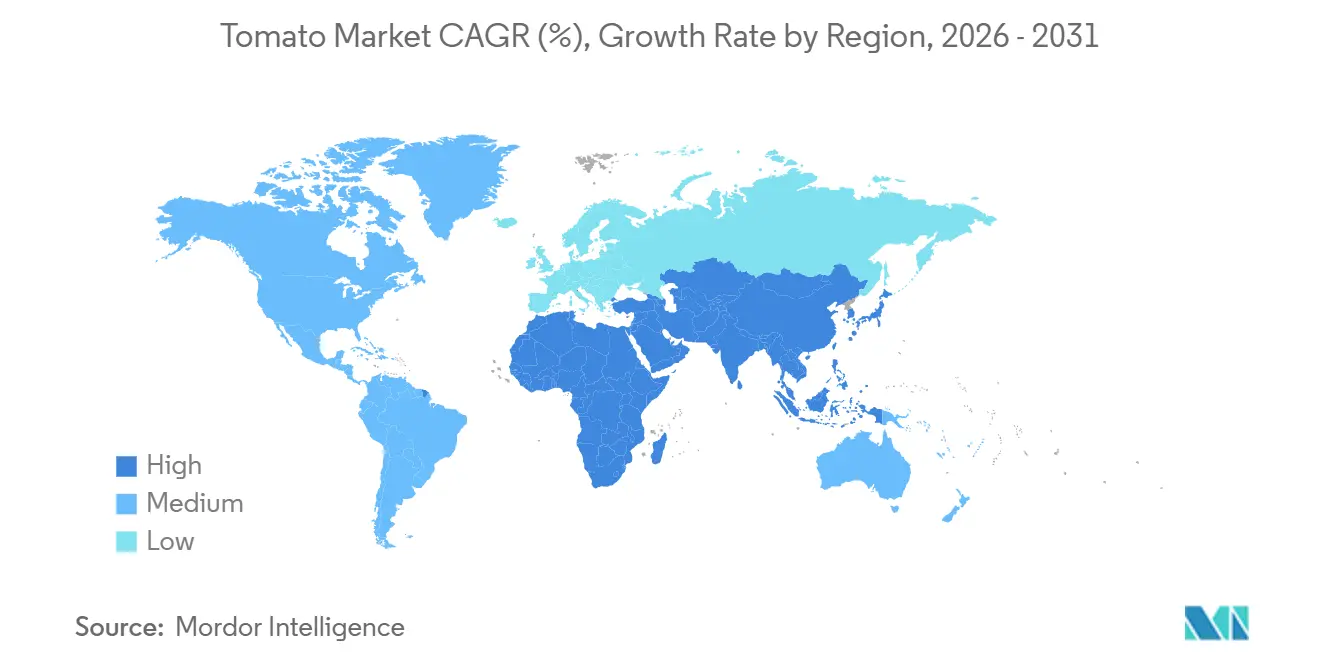
- By geography, Asia-Pacific dominated the tomato market with a 47.0% share in 2025, while Africa is anticipated to grow at the highest CAGR of 4.8% during 2026-2031.
Note: Market size and forecast figures in this report are generated using Mordor Intelligence’s proprietary estimation framework, updated with the latest available data and insights as of January 2026.
Global Tomato Market Trends and Insights
Drivers Impact Analysis*
| Driver | (~) % Impact on CAGR Forecast | Geographic Relevance | Impact Timeline |
|---|---|---|---|
| Rising demand for processed tomato products | 1.2% | Global, with concentration in North America, Europe, and Asia-Pacific QSR markets | Medium term (2-4 years) |
| Expansion of greenhouse and protected cultivation | 1.0% | Europe (Spain, Netherlands, Italy), Asia-Pacific (Japan, China), Middle East (Turkey, UAE) | Long term (≥ 4 years) |
| Government incentives for high-value horticulture | 0.9% | Asia-Pacific (India, China), Africa (Egypt, Nigeria), South America (Brazil) | Medium term (2-4 years) |
| Health and nutrition-driven fresh tomato uptake | 0.7% | Global, with premium segments in North America and Europe | Short term (≤ 2 years) |
| Premiumization via zero-residue hydroponic tomatoes | 0.5% | North America (urban centers), Europe (Netherlands, UK), Asia-Pacific (Japan, Singapore) | Medium term (2-4 years) |
| AI-driven optimization of high-tech greenhouses | 0.4% | Europe (Netherlands, Spain), North America (California, Canada), Asia-Pacific (Japan) | Long term (≥ 4 years) |
| Source: Mordor Intelligence | |||
Rising Demand for Processed Tomato Products
Multi-year supply contracts from quick-service restaurants and ready-meal brands continue to tighten spot availability of paste and diced tomatoes. China’s paste consumption is rising at 7% CAGR, outpacing its 1.5 million metric tons capacity and gradually eroding the country’s export surplus. Italy processed 5.2 million metric tons in 2024, and branded sauce, with a 6% CAGR, is diverting volumes from export channels. Nigeria spends USD 360 million on paste imports each year, encouraging local processors to integrate backward with growers and close raw material gaps[1]Source: Mutti S.p.A., “Annual Report 2024,” mutti-parma.com.
Expansion of Greenhouse and Protected Cultivation
Energy-efficient greenhouses enable year-round production, mitigate weather risk, and support premium pricing. The Netherlands exported USD 1.89 billion (EUR 1.8 billion) in greenhouse tomatoes in 2024, while reducing natural gas use by 30% through the use of LED lighting and advanced climate control algorithms. Mexico’s Sinaloa operations achieved a yield of 70 metric tons per acre, double California’s open-field yield, by coupling fertigation with precise nutrient delivery.
Government Incentives for High-Value Horticulture
Capital subsidies and soft loans are steering acreage toward tomatoes in emerging economies. India’s Production Linked Incentive Scheme has earmarked USD 1.31 billion (INR 109 billion) for processing expansion, while offering 50% support on greenhouse construction. Egypt expanded its use of drip irrigation to 120,000 hectares in 2024, resulting in a production increase to 6.7 million metric tons and a boost in exports to European and Middle Eastern buyers. Nigeria’s central bank provides concessional credit to processors, yet utilization lags because raw fruit supply remains erratic.
Health and Nutrition-Driven Fresh Tomato Uptake
Consumer awareness of lycopene and clean-label attributes is driving up demand for fresh tomatoes in high-income markets. In 2024, organic tomatoes not only saw a 4.7% uptick in sales but also commanded prices that were 111.6% higher than their conventional counterparts, according to the Organic Produce Network (OPN) and the Organic Trade Association (OTA). This surge outpaced the broader growth of organic produce, underscoring a clear consumer shift towards healthier, cleaner choices. Japan’s shoppers pay a 25% premium for zero-residue hydroponic produce, which encourages the development of urban vertical farms. The new European Union labeling, which mandates pesticide-residue disclosure from 2025, is already polarizing the shelf into certified and non-certified tiers, with a 15% price gap.
Restraints Impact Analysis*
| Restraint | (~) % Impact on CAGR Forecast | Geographic Relevance | Impact Timeline |
|---|---|---|---|
| Post-harvest losses and pest-driven spoilage | -0.8% | Africa, South Asia, other developing markets | Medium term (2-4 years) |
| Water stress and adverse climate volatility | -1.0% | Mediterranean Basin, California, other traditional growing regions | Long term (≥ 4 years) |
| Carbon-footprint scrutiny of energy-intensive greenhouses | -0.5% | Europe, North America | Medium term (2-4 years) |
| Price volatility in tomato market | -0.7% | Global, strongest in import-dependent regions | Short term (≤ 2 years) |
| Source: Mordor Intelligence | |||
Post-Harvest Losses and Pest-Driven Spoilage
Up to 20% of harvested tomatoes in developing regions never reach consumers because refrigerated transport and storage are scarce. India still loses 11.61% of its crop despite Operation Greens' cold-chain subsidies. Nigeria’s 18% spoilage rate inflates a USD 360 million paste import bill, and the invasive moth Tuta absoluta cuts yields by 30% across East Africa in 2024. These gaps invite investment in integrated cold-chain logistics and pest-management service firms.
Water Stress and Adverse Climate Volatility
Central Valley aquifers are depleting at a rate of 2% per year, prompting California to consider a 10% reduction in acreage by 2027. Spain’s Andalusia region suffered a 15% yield loss in 2024 amid a multi-year drought, prompting growers to adopt deficit irrigation, which reduces fruit size. Turkey’s Antalya greenhouses lost 12.56% of output during the 2022-2023 drought, while China’s Xinjiang faces rising capital outlays for drip irrigation to sustain processing farms. A Nature Food model predicts a 6% decline in global tomato production by 2050 under high-emission scenarios [2]Source: Nature Food, “Climate Scenarios for Global Tomato Yield,” nature.com.
*Our forecasts treat driver/restraint impacts as directional, not additive. The impact forecasts reflect baseline growth, mix effects, and variable interactions.
Geography Analysis
The Asia-Pacific region accounted for 47.0% of the global tomato production market share in 2025, yet disparities widened between water-stressed inland provinces and coastal greenhouse hubs. China’s Xinjiang region produced 90% of the country's processed tomatoes and shipped 1.5 million metric tons of paste, but rising irrigation costs are eroding its price competitiveness. India’s Karnataka, Maharashtra, and Andhra Pradesh states offer subsidies for processing plants, although post-harvest losses of 11.6% still plague growers. Japan’s hydroponic complexes triple open-field yields and supply premium retailers, underscoring the role of technology in countering land scarcity.
Africa is the fastest-growing region, with a 4.8% CAGR, anchored by Egypt’s 6.7 million-ton drip-irrigated harvest and Nigeria’s policy push to substitute USD 360 million in paste imports. South Africa and Cameroon meet domestic demand, yet they lack the cold-chain depth to capture off-season premiums. Strategic investment in storage and logistics could unlock latent demand across the continent, where per capita intake stays under 5 kilograms.
North America also held a significant share in 2025, with mature open-field systems in California complemented by rapid greenhouse expansion in Mexico and Canada. California delivered 11 million metric tons of processing tomatoes but faces a 10% acreage cut by 2027 due to aquifer depletion. Mexico’s Sinaloa and Baja California greenhouses reached 70 metric tons per acre and exported 1.8 million metric tons valued at USD 2.7 billion to the United States. Canada’s carbon tax lifted heating costs by 12% in 2024, pushing some growers to adopt geothermal heat or exit the market [3]Source: California Department of Water Resources, “Central Valley Aquifer Allocation Cuts,” water.ca.gov.


Competitive Landscape
The market consists of a diverse range of participants, including vertically integrated processors, advanced greenhouse operators, and regional grower cooperatives. Campbell Soup Company purchased a 49% stake in La Regina for USD 286 million in December 2025 to secure supply for its Rao’s brand and reduce exposure to spot-market swings. In March 2025, Morning Star’s acquisition of Del Monte’s Hanford plant adds 500,000 metric tons of annual throughput and cements its leadership position in North American paste supply. Kraft Heinz and Conesa Group opened a USD 15.7 million facility in Portugal in September 2025, which combines farming contracts with branded distribution across Europe.
Strategic moves increasingly center on energy efficiency and emissions targets. Dutch greenhouse operators are investing in geothermal loops and combined heat and power systems to meet a mandated 50% reduction in emissions by 2030. Mexican growers are adopting artificial intelligence-guided fertigation to increase yields to 70 metric tons per acre while reducing water use by 40%. Japanese producers utilize computer vision grading, which enhances export-grade yields and minimizes waste.
Regional policy also shapes rivalry between exporters. India’s USD 1.3 billion (INR 109 billion) incentive program and Egypt’s 120,000-hectare drip network attract private capital into new processing hubs. Carbon taxes in Canada and the European Union emissions levies tilt the cost curve away from gas-heated glasshouses toward sites with abundant renewable energy. The United States antidumping probes into Mexican tomatoes inject further uncertainty and encourage suppliers to diversify markets beyond North America.
Recent Industry Developments
- September 2025: Shriram Bioseed Genetics introduced the Raksha hybrid tomato variety to the Indian market, specifically targeting tropical and subtropical regions for year-round cultivation. This regional development offers farmers high-yielding, disease-resistant crops designed to enhance productivity and profitability across various sowing seasons.
- May 2025: Bayer AG has announced the introduction of new tomato varieties featuring multi-stacked resistance to Tomato Brown Rugose Fruit Virus (ToBRFV), a rapidly mutating plant RNA virus that poses ongoing challenges to growers globally. These new varieties are expected to be available across all major glasshouse tomato segments by 2025, marking a significant advancement in disease resistance and crop sustainability.
- October 2024: American Chemical Society researchers demonstrated that larger-droplet overhead irrigation can trigger immune responses that improve pest tolerance in tomato plants. This approach offers a sustainable and non-chemical solution for pest management.


Research Methodology Framework and Report Scope
Market Definitions and Key Coverage
Our study defines the global tomato market as the farm-gate value of every fresh tomato harvested for table or processing use, whether grown in open fields or protected structures across all six regions tracked by Mordor Intelligence. Volume in metric tons is converted to constant-2024 USD using average delivery-to-packer prices.
(Scope exclusion) Products that undergo secondary transformation, such as sauces, ketchup, powders, juice concentrates, and seed trade, remain outside this valuation.
Segmentation Overview
- By Geography
- North America
- United States
- Production Analysis (Area Harvested, Yield, and Production Volume)
- Consumption Analysis (Consumption Value and Volume)
- Import Market Analysis (Import Value, Volume, and Key Supplying Markets)
- Export Market Analysis (Export Value, Volume, and Key Destination Markets)
- Wholesale Price Trend Analysis and Forecast
- Regulatory Framework
- List of Key Players
- Logistics and Infrastructure
- Seasonality Analysis
- Canada
- Production Analysis (Area Harvested, Yield, and Production Volume)
- Consumption Analysis (Consumption Value and Volume)
- Import Market Analysis (Import Value, Volume, and Key Supplying Markets)
- Export Market Analysis (Export Value, Volume, and Key Destination Markets)
- Wholesale Price Trend Analysis and Forecast
- Regulatory Framework
- List of Key Players
- Logistics and Infrastructure
- Seasonality Analysis
- Mexico
- Production Analysis (Area Harvested, Yield, and Production Volume)
- Consumption Analysis (Consumption Value and Volume)
- Import Market Analysis (Import Value, Volume, and Key Supplying Markets)
- Export Market Analysis (Export Value, Volume, and Key Destination Markets)
- Wholesale Price Trend Analysis and Forecast
- Regulatory Framework
- List of Key Players
- Logistics and Infrastructure
- Seasonality Analysis
- United States
- Europe
- Spain
- Production Analysis (Area Harvested, Yield, and Production Volume)
- Consumption Analysis (Consumption Value and Volume)
- Import Market Analysis (Import Value, Volume, and Key Supplying Markets)
- Export Market Analysis (Export Value, Volume, and Key Destination Markets)
- Wholesale Price Trend Analysis and Forecast
- Regulatory Framework
- List of Key Players
- Logistics and Infrastructure
- Seasonality Analysis
- Netherlands
- Production Analysis (Area Harvested, Yield, and Production Volume)
- Consumption Analysis (Consumption Value and Volume)
- Import Market Analysis (Import Value, Volume, and Key Supplying Markets)
- Export Market Analysis (Export Value, Volume, and Key Destination Markets)
- Wholesale Price Trend Analysis and Forecast
- Regulatory Framework
- List of Key Players
- Logistics and Infrastructure
- Seasonality Analysis
- Germany
- Production Analysis (Area Harvested, Yield, and Production Volume)
- Consumption Analysis (Consumption Value and Volume)
- Import Market Analysis (Import Value, Volume, and Key Supplying Markets)
- Export Market Analysis (Export Value, Volume, and Key Destination Markets)
- Wholesale Price Trend Analysis and Forecast
- Regulatory Framework
- List of Key Players
- Logistics and Infrastructure
- Seasonality Analysis
- Italy
- Production Analysis (Area Harvested, Yield, and Production Volume)
- Consumption Analysis (Consumption Value and Volume)
- Import Market Analysis (Import Value, Volume, and Key Supplying Markets)
- Export Market Analysis (Export Value, Volume, and Key Destination Markets)
- Wholesale Price Trend Analysis and Forecast
- Regulatory Framework
- List of Key Players
- Logistics and Infrastructure
- Seasonality Analysis
- Poland
- Production Analysis (Area Harvested, Yield, and Production Volume)
- Consumption Analysis (Consumption Value and Volume)
- Import Market Analysis (Import Value, Volume, and Key Supplying Markets)
- Export Market Analysis (Export Value, Volume, and Key Destination Markets)
- Wholesale Price Trend Analysis and Forecast
- Regulatory Framework
- List of Key Players
- Logistics and Infrastructure
- Seasonality Analysis
- Spain
- Asia-Pacific
- China
- Production Analysis (Area Harvested, Yield, and Production Volume)
- Consumption Analysis (Consumption Value and Volume)
- Import Market Analysis (Import Value, Volume, and Key Supplying Markets)
- Export Market Analysis (Export Value, Volume, and Key Destination Markets)
- Wholesale Price Trend Analysis and Forecast
- Regulatory Framework
- List of Key Players
- Logistics and Infrastructure
- Seasonality Analysis
- India
- Production Analysis (Area Harvested, Yield, and Production Volume)
- Consumption Analysis (Consumption Value and Volume)
- Import Market Analysis (Import Value, Volume, and Key Supplying Markets)
- Export Market Analysis (Export Value, Volume, and Key Destination Markets)
- Wholesale Price Trend Analysis and Forecast
- Regulatory Framework
- List of Key Players
- Logistics and Infrastructure
- Seasonality Analysis
- Japan
- Production Analysis (Area Harvested, Yield, and Production Volume)
- Consumption Analysis (Consumption Value and Volume)
- Import Market Analysis (Import Value, Volume, and Key Supplying Markets)
- Export Market Analysis (Export Value, Volume, and Key Destination Markets)
- Wholesale Price Trend Analysis and Forecast
- Regulatory Framework
- List of Key Players
- Logistics and Infrastructure
- Seasonality Analysis
- China
- South America
- Brazil
- Production Analysis (Area Harvested, Yield, and Production Volume)
- Consumption Analysis (Consumption Value and Volume)
- Import Market Analysis (Import Value, Volume, and Key Supplying Markets)
- Export Market Analysis (Export Value, Volume, and Key Destination Markets)
- Wholesale Price Trend Analysis and Forecast
- Regulatory Framework
- List of Key Players
- Logistics and Infrastructure
- Seasonality Analysis
- Argentina
- Production Analysis (Area Harvested, Yield, and Production Volume)
- Consumption Analysis (Consumption Value and Volume)
- Import Market Analysis (Import Value, Volume, and Key Supplying Markets)
- Export Market Analysis (Export Value, Volume, and Key Destination Markets)
- Wholesale Price Trend Analysis and Forecast
- Regulatory Framework
- List of Key Players
- Logistics and Infrastructure
- Seasonality Analysis
- Chile
- Production Analysis (Area Harvested, Yield, and Production Volume)
- Consumption Analysis (Consumption Value and Volume)
- Import Market Analysis (Import Value, Volume, and Key Supplying Markets)
- Export Market Analysis (Export Value, Volume, and Key Destination Markets)
- Wholesale Price Trend Analysis and Forecast
- Regulatory Framework
- List of Key Players
- Logistics and Infrastructure
- Seasonality Analysis
- Brazil
- Middle East
- Turkey
- Production Analysis (Area Harvested, Yield, and Production Volume)
- Consumption Analysis (Consumption Value and Volume)
- Import Market Analysis (Import Value, Volume, and Key Supplying Markets)
- Export Market Analysis (Export Value, Volume, and Key Destination Markets)
- Wholesale Price Trend Analysis and Forecast
- Regulatory Framework
- List of Key Players
- Logistics and Infrastructure
- Seasonality Analysis
- Saudi Arabia
- Production Analysis (Area Harvested, Yield, and Production Volume)
- Consumption Analysis (Consumption Value and Volume)
- Import Market Analysis (Import Value, Volume, and Key Supplying Markets)
- Export Market Analysis (Export Value, Volume, and Key Destination Markets)
- Wholesale Price Trend Analysis and Forecast
- Regulatory Framework
- List of Key Players
- Logistics and Infrastructure
- Seasonality Analysis
- Iran
- Production Analysis (Area Harvested, Yield, and Production Volume)
- Consumption Analysis (Consumption Value and Volume)
- Import Market Analysis (Import Value, Volume, and Key Supplying Markets)
- Export Market Analysis (Export Value, Volume, and Key Destination Markets)
- Wholesale Price Trend Analysis and Forecast
- Regulatory Framework
- List of Key Players
- Logistics and Infrastructure
- Seasonality Analysis
- Turkey
- Africa
- Egypt
- Production Analysis (Area Harvested, Yield, and Production Volume)
- Consumption Analysis (Consumption Value and Volume)
- Import Market Analysis (Import Value, Volume, and Key Supplying Markets)
- Export Market Analysis (Export Value, Volume, and Key Destination Markets)
- Wholesale Price Trend Analysis and Forecast
- Regulatory Framework
- List of Key Players
- Logistics and Infrastructure
- Seasonality Analysis
- South Africa
- Production Analysis (Area Harvested, Yield, and Production Volume)
- Consumption Analysis (Consumption Value and Volume)
- Import Market Analysis (Import Value, Volume, and Key Supplying Markets)
- Export Market Analysis (Export Value, Volume, and Key Destination Markets)
- Wholesale Price Trend Analysis and Forecast
- Regulatory Framework
- List of Key Players
- Logistics and Infrastructure
- Seasonality Analysis
- Nigeria
- Production Analysis (Area Harvested, Yield, and Production Volume)
- Consumption Analysis (Consumption Value and Volume)
- Import Market Analysis (Import Value, Volume, and Key Supplying Markets)
- Export Market Analysis (Export Value, Volume, and Key Destination Markets)
- Wholesale Price Trend Analysis and Forecast
- Regulatory Framework
- List of Key Players
- Logistics and Infrastructure
- Seasonality Analysis
- Egypt
- North America
Detailed Research Methodology and Data Validation
Primary Research
Mordor analysts interview greenhouse agronomists, cooperative heads, bulk traders, and food-service procurement managers across Asia, Europe, the Americas, and Africa.
Their insights on yield swings, farmgate prices, and cultivar demand close information gaps and stress-test every secondary data point before model lock-in.
Desk Research
We first mine tier-1 public datasets, including FAOSTAT, USDA-ERS, Eurostat, UN COMTRADE, and the World Processing Tomato Council, to secure harmonized statistics on area, yield, trade flows, and processing ratios.
National horticulture boards, peer-reviewed agronomy journals, and reputable press releases add context on varietal shifts, water policies, and greenhouse roll-outs.
Paid repositories, such as D&B Hoovers for processor financials and Dow Jones Factiva for real-time price movements, complement the open data.
Company filings, investor decks, and customs shipment logs help triangulate acreage and export values.
These titles illustrate key inputs; many other sources are reviewed for completeness and consistency.
Market-Sizing & Forecasting
A top-down production-plus-trade reconstruction establishes base value; selective bottom-up checks, including processor throughput samples and average selling price times volume tests, validate totals.
Key variables modeled include protected acreage growth, yield per hectare, processing utilization, export parity price, and per-capita income.
A multivariate regression forecasts each driver to 2030, capturing climate indices and subsidy trends, and back-tests neatly against a ten-year history.
Data Validation & Update Cycle
Outputs face variance screens, peer reviews, and senior analyst sign-off.
The dataset refreshes annually, with interim updates when droughts, tariff shifts, or disease outbreaks materially alter supply or demand.
A final pass ensures clients receive the latest calibrated view.
Why Mordor's Tomato Baseline Earns Stakeholder Confidence
Published estimates often diverge because firms draw boundaries differently, anchor on dissimilar price points, and revisit assumptions at uneven intervals. We acknowledge those realities and show our workings.
Competitor gaps usually stem from omitting processing tomatoes, valuing output at wholesale or retail levels, or locking forecasts to a one-off supply shock, whereas our yearly reset blends both cultivation pathways and inflates nothing beyond farm-gate.
Benchmark comparison
| Market Size | Anonymized source | Primary gap driver |
|---|---|---|
| USD 208.4 B (2025) | Mordor Intelligence | - |
| USD 166.1 B (2025) | Global Consultancy A | Counts only fresh-market exports and applies landed-price basis |
| USD 213.9 B (2025) | Industry Journal B | Adds processed derivatives and values output at retail shelf prices |
The comparison shows that our balanced scope, dual-path validation, and disciplined annual refresh give decision-makers a transparent, reproducible baseline they can trust.


Key Questions Answered in the Report
What is the current size of the global tomato market?
The tomato market stands at USD 212.4 billion in 2026 and is projected to reach USD 270.5 billion by 2031 at a 4.95% CAGR.
Which region holds the largest share of the tomato market?
Asia-Pacific leads with a 47.0% tomato market share in 2025, driven by China’s production scale and India’s expanding greenhouse acreage.
Why are greenhouse tomatoes gaining prominence?
Yields are up to 6.4 times higher than field crops, quality is more consistent, and protected systems mitigate climate risks, fueling rapid adoption.
What are the main challenges facing tomato producers?
Key constraints include water stress, post-harvest losses, pest infestations such as Tuta absoluta, and scrutiny of greenhouse carbon footprints.
How is AI influencing tomato cultivation?
AI-guided greenhouse platforms optimize temperature, humidity, and lighting, providing 10.1% higher yields and almost doubling profits in trials.
Page last updated on:


