
Textile Market Analysis by Mordor Intelligence
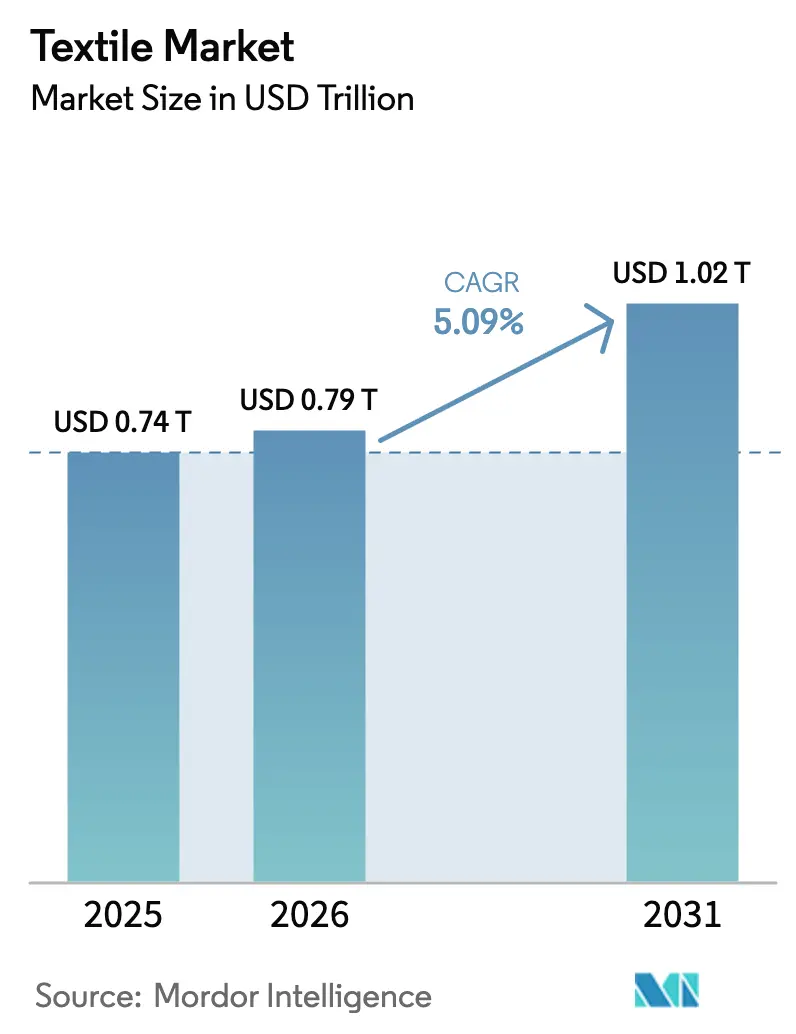
The textile market size was valued at USD 0.79 trillion in 2026 and estimated to grow from USD 0.83 trillion in 2027 to reach USD 1.04 trillion by 2032, at a CAGR of 4.55% during the forecast period (2027-2032).
Demand for fabrics with verified fiber origin can create an opening for suppliers that preserve end-use performance while meeting buyers’ sourcing objectives. Cotton-sourcing pressure in the United States and European product-information preparation reinforce the commercial value of these offers. Recycled-polyester commitments provide a substitution route, although recovery constraints can delay repeat commercial fabric supply. Suppliers can respond through traceability and recycled-content programs, while rooftop-solar network charges for Tamil Nadu spinning mills and possible EU qualification work for synthetic fabrics can raise production and development costs.
Key Report Takeaways
- Within applications, fashion and apparel held a 55.9% textile market share in 2026, while industrial/technical textiles are forecast to be the fastest-growing segment at a CAGR of 5.65% during 2027-2032.
- Among raw materials, synthetic fibers led with a 54.19% share of the textile market size in 2026, and recycled fibers are projected to grow fastest at a CAGR of 6.1% during 2027-2032.
- By process and technology, woven textiles accounted for 48.16% of the market in 2026, while non-woven textiles are forecast to be the fastest-growing segment at a CAGR of 5.55% during 2027-2032.
- Across geographies, Asia-Pacific held 54.2% of the market in 2026, and the Middle East and Africa region is projected to grow fastest at a CAGR of 5.4% during 2027-2032.
Note: Market numbers in this report are based on Mordor Intelligence's proprietary estimation framework, which combines nine months of actuals with Q4 projections for base year 2026.
Market Trends and Insights
Drivers Impact Analysis of Textile Market*
| Driver | (~) % Impact on CAGR Forecast | Geographic Relevance | Impact Timeline |
|---|---|---|---|
| EU Digital Product Passport accelerating traceability technology investments | +1.7% | European Union member states | Short term (≤ 2 years) |
| Uyghur Forced Labor Prevention Act (UFLPA) shifting sourcing toward certified non-Xinjiang cotton | +1.5% | United States and China | Short term (≤ 2 years) |
| Bio-based PEF polyester advancing from European pilot toward commercial-scale production | +1.2% | Netherlands industrial locations | Medium term (2-4 years) |
| Proposed carbon-credit methodology for textile recycling could boost recycled-fiber profitability | +1% | Hammarsdale in KwaZulu-Natal | Long term (≥ 4 years) |
| AI-driven on-demand manufacturing reducing inventory waste and enabling micro-batch runs | +0.8% | Canada and China | Short term (≤ 2 years) |
| Protective & antiviral textiles demand surge for pathogen-resilient indoor environments | +0.6% | United Kingdom healthcare locations | Medium term (2-4 years) |
| Source: Mordor Intelligence | |||
EU Digital Product Passport accelerating traceability technology investments
Fabric suppliers can strengthen their position when material provenance travels with the garment made from their output. Erreà launched a Digital Product Passport with Ympact in July 2025, connecting company systems and digital modules with supply-chain data for individual garments.[1] Regulation (EU) 2024/1781 makes market access for products covered by applicable delegated acts conditional on a digital product passport under those acts and Articles 10 and 11, with accurate, complete, up-to-date data. Erreà’s business systems and Ympact’s mapping tool channel collected data into the passport associated with each item. Supplying fabric data those systems can ingest can reduce the brand’s integration work, giving an apparel-facing mill a practical advantage when its material is onboarded.
Uyghur Forced Labor Prevention Act (UFLPA) shifting sourcing toward certified non-Xinjiang cotton
U.S. apparel buyers can influence cotton selection before textile manufacturers commit materials to fabric production. In 2026, approximately 63% of surveyed U.S. fashion companies encouraged suppliers to incorporate more U.S. cotton in response to UFLPA, up from 59% in 2025.[2] Import enforcement adds a separate incentive to substantiate sourcing. In August 2025, the Forced Labor Enforcement Task Force reported 78 UFLPA Entity List additions over the preceding year, bringing the total to 144 Chinese entities whose goods were presumptively prohibited from U.S. entry. Buyer requests can consequently favor fabric suppliers able to demonstrate cotton origin. For mills serving these companies, a supportable sourcing record becomes part of securing access to U.S. apparel programs.
Bio-based PEF polyester advancing from European pilot toward commercial-scale production
Bio-based polyester adoption depends on whether its underlying production technology can progress toward repeatable industrial supply. Avantium produced its first FDCA batch at its Delfzijl plant in the Netherlands in September 2026, advancing production of a building block for PEF. The company expected commercial-scale validation after start-up and qualification, with commercial sales expected toward the end of 2026. The qualification program was intended to establish that the product met customer specifications while production gradually scaled toward continuous operation. Any textile demand therefore depends on qualified PEF supply becoming available, making qualification outcomes more commercially decisive than the FDCA first-batch milestone alone.
Proposed carbon-credit methodology for textile recycling could boost recycled-fiber profitability
Carbon-credit income can create an additional economic outlet for textile waste alongside revenue from recovered material. In South Africa, Connacher recycles pre-consumer cut-make-trim waste into fiber sold as a substitute for virgin flexible polyurethane foam in bedding and automotive components. Its January 2026 project proposal said pursuing carbon-credit revenue was essential to financial sustainability and competitive pricing of its recycled products. An independent audit estimated approximately 63,234 tCO₂e of emissions reductions from July 2022 through June 2025, reflecting avoided landfill methane and foam substitution after electricity and diesel adjustments. Potential carbon revenue could help sustain competitively priced foam substitutes for bedding and automotive-component buyers, supporting textile-waste recovery through an outlet beyond fabric manufacturing.
Restraints Impact Analysis of Textile Market*
| Restraint | (~) % Impact on CAGR Forecast | Geographic Relevance | Impact Timeline |
|---|---|---|---|
| Escalating renewable-energy surcharges raising electricity costs for energy-intensive spinning mills | -0.9% | Tamil Nadu state | Short term (≤ 2 years) |
| Tightening microplastic shedding regulations increasing R&D and compliance spend for synthetics | -0.7% | European Union member states | Medium term (2-4 years) |
| Red Sea shipping disruptions inflating freight costs for Asia-to-EU textile trade lanes | -0.4% | Asian hubs and European ports | Short term (≤ 2 years) |
| PFAS "forever-chemicals" bans forcing costly reformulation of performance finishes | -0.3% | California and France | Short term (≤ 2 years) |
| Source: Mordor Intelligence | |||
Escalating renewable-energy surcharges raising electricity costs for energy-intensive spinning mills
Electricity-network costs can constrain the economic case for rooftop solar at spinning mills. On July 4, 2026, the Southern India Spinners Association called for removal of a Tamil Nadu network charge levied on rooftop-solar projects. In 2025, the Southern India Mills’ Association (SIMA) said higher wheeling, transmission and system-operation charges would make renewable energy and open-access power unviable for Tamil Nadu textile mills. This broader exposure can limit the cost advantage of changing electricity sources, constraining the economics of yarn production even when renewable power is available. For a Tamil Nadu spinning mill subject to the rooftop-solar charge, installing its own generation leaves a network payment attached to the electricity it produces.
Tightening microplastic shedding regulations increasing R&D and compliance spend for synthetics
Regulation (EU) 2024/1781 establishes an ecodesign framework under which future product-specific performance requirements could address nano- and microplastic release. The applicable criteria would be set through product-specific delegated acts, making those acts the basis for defining a synthetic fabric’s release-related qualification work. For developers serving apparel converters, the commercial constraint is committing to a fabric construction before the relevant criterion is defined, with possible additional development work delaying repeat supply.
*Our forecasts treat driver/restraint impacts as directional, not additive. The impact forecasts reflect baseline growth, mix effects, and variable interactions.
Textile Market Segment Analysis
By Application:
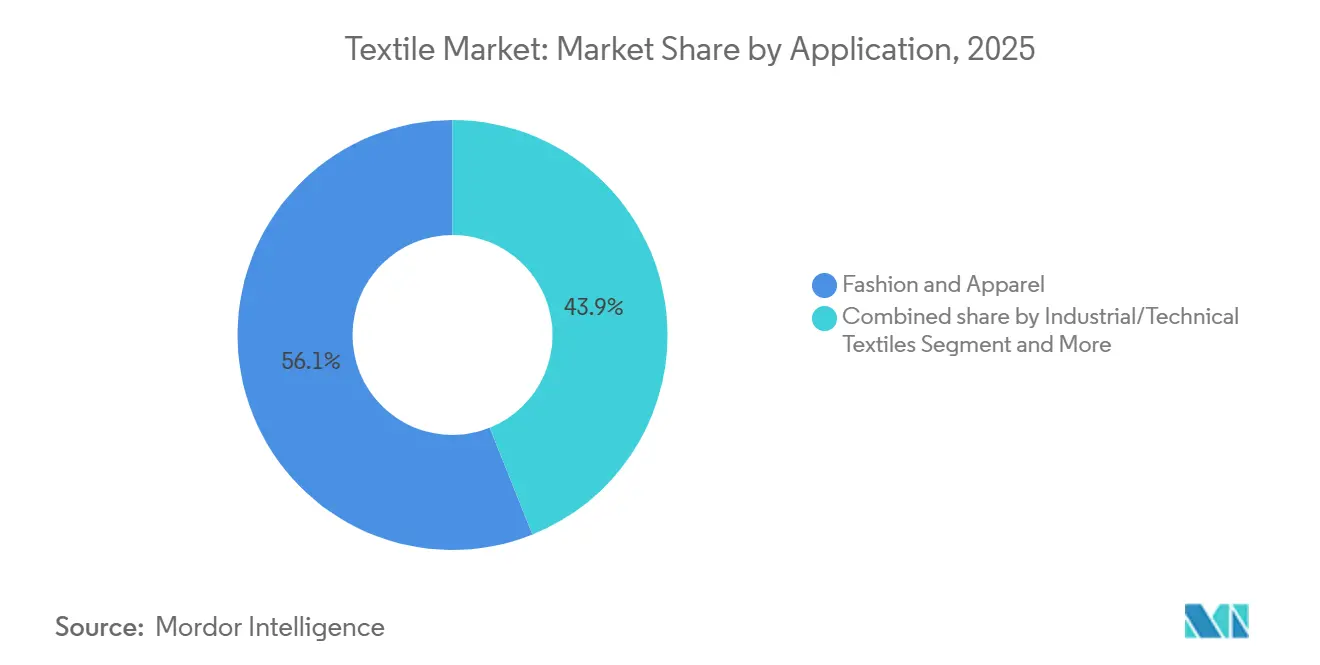
Apparel Scale and Technical Fabric EconomicsFashion and apparel accounted for a 55.9% share of the textile market size in 2026. Textile Exchange’s 2026 report identified apparel as the largest broad end-use market for fiber production. Arvind Ltd. reported denim-fabric business volume of 59.5 million meters in the year ended March 31, 2026, compared with 51.6 million meters in the preceding fiscal year. Arvind’s denim-fabric volume rose by 7.9 million meters in one fiscal year, showing that a fabric maker serving apparel buyers can add volume within an existing product line.
Industrial/technical textiles are projected to be the fastest-growing segment, at a CAGR of 5.65% during 2027-2032. In China, above-scale technical-textile enterprises’ operating revenue rose 4.5% year over year in January-February 2026. China’s exports of nonwovens, a technical-textile product family, rose 13.8% in value to USD 720 million in January-February 2026 compared with the same period in 2025. The operating profit margin among China’s above-scale technical-textile enterprises held at 3.6%, unchanged from January-February 2025. Export demand gives technical-textile suppliers an expansion channel, while an unchanged operating margin makes the profitability of additional application programs central to that growth.

By Raw Material:
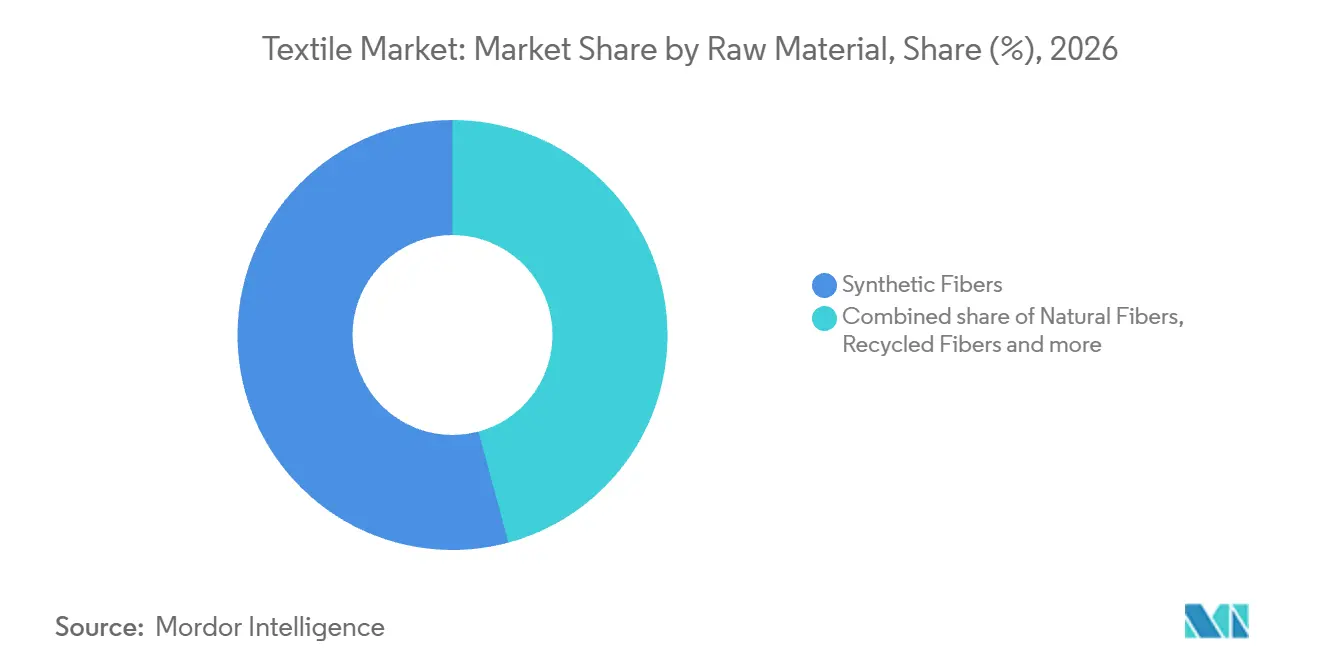
Established Supply and Recovery ConstraintsSynthetic fibers represented a 54.19% textile market share in 2026. Global polyester fiber production reached 82.5 million metric tons in 2025, up from 77.7 million metric tons in 2024, according to Textile Exchange. Polyester accounted for 59% of global fiber production in 2025. For fabric makers using polyester, these production gains broaden the supply base available for expanding an established synthetic-fabric line.
Recycled fibers are forecast to be the fastest-growing segment, at a CAGR of 6.1% during 2027-2032. In September 2026, Circ announced a multi-year offtake agreement with Primark for recycled polyester from textile waste, with introduction into clothing planned for 2029. Textile Exchange’s directional estimate put textile-to-textile recycled spinnable-fiber availability for apparel and home textiles at about 1 to 1.5 million metric tons in 2025. Collection, sorting, processing, and technology constraints restrict how much feedstock can become spinnable fiber. Committed buyers and conversion-ready supply therefore jointly determine how quickly manufacturers can expand recycled-content fabric programs.
By Process / Technology:
Woven Scale and Selective Nonwoven ExpansionWoven textiles held 48.16% of the market in 2026, making them the largest segment. In 2025, Texhong International Group Limited (formerly Texhong Textile Group Limited) sold around 100 million meters of woven garment fabrics, mainly into overseas markets, up approximately 4.8% year over year. The group linked that performance to rebounding overseas workwear demand and its nearshore production layout. The group also reported U.S. tariff-related front-loading in the first half of 2025, making order timing an additional exposure for converters supplying overseas workwear buyers.
Non-woven textiles are projected to be the fastest-growing segment, at a CAGR of 5.55% during 2027-2032. Fibertex Nonwovens, a Schouw & Co. subsidiary, reported 7% year-over-year revenue growth in Q4 2025 as positive volume effects outweighed negative exchange-rate effects. Its recently installed Greenville, South Carolina, spunlacing line enabled higher U.S. sales of wipes and other products. Greater Europe’s nonwoven production nevertheless declined around 2.2% in 2025. The U.S. wipes example shows how a newly installed process line can capture application-specific sales even while another region’s aggregate production contracts.
Geography Analysis
Asia-Pacific Textile Market
Asia-Pacific accounted for a 54.2% share of the textile market size in 2026, making it the largest region. In 2025, China’s technical-textile industry processed 22.796 million metric tons of fiber, up 6.6% from 2024, according to the China Nonwovens & Industrial Textiles Association. China also exported 1.69 million metric tons of nonwoven rolls in 2025, with the association describing strong overseas demand for that finished textile product. In Bangladesh, local yarn primarily supplies domestic knitwear and fabric manufacturers, reducing yarn-import reliance and garment exporters’ production lead times while providing a nearby input channel for fabric production.
Middle East and Africa Textile Market
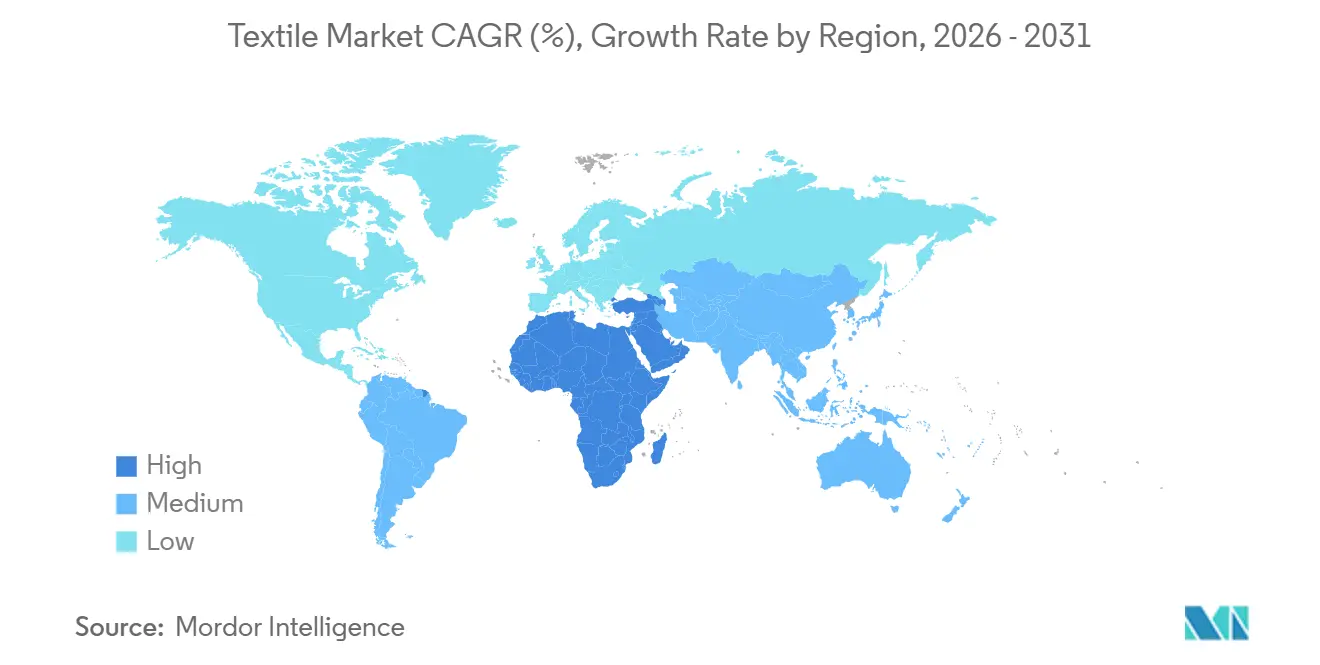
The Middle East and Africa region is projected to grow fastest, at a CAGR of 5.4% during 2027-2032. The Industrial Development Authority reported annual fabric capacity of 8.3 million meters at Misr Spinning and Weaving Company’s Al-Mahalla factories in Egypt in July 2026. Its integrated spinning, weaving, dyeing and finishing operations offer fabric buyers several production stages within one complex. Valerius Morocco, a joint venture between Morocco’s SG3H and Portugal’s VALERIUS GROUP, inaugurated a garment manufacturing unit in Salé on May 29, 2025. The Moroccan ministry linked the investment to proximity-based co-production, making garment manufacturing a potential local outlet for textile-material suppliers.
In North America, U.S. textile producers supply the U.S. military, giving domestic fabric makers an institutional sales channel. Brazilian textile production rose 6.8% in January-November 2025 against the same period in 2024, according to Abit data, reinforcing domestic production as a source of textile supply in South America. Colombia’s 0% import tariff on 10 specified clothing and footwear input codes from December 1, 2025, through November 30, 2026, removes the tariff component of those inputs’ landed costs. The EU specializes in technical textiles, while Portugal’s Tecealfa produces custom jacquard fabrics for hospitality, decorative and home-textile customers, including hotels and designers. For suppliers serving hotel and designer programs, that tailored jacquard model places fabric development close to the customer’s chosen application.
Regulatory Framework and Outlook
The comparison assesses compliance conditions in selected jurisdictions from the perspective of a manufacturer selling completed textile materials. Textile-product information rules apply in France and Brazil, while China’s revised rules require incoming-material checks and records for covered fiber products. EPA’s April 2026 timing rule starts PFAS reporting on January 31, 2027, or 60 days after the forthcoming substantive final rule’s effective date, whichever comes first. Product-specific compliance evidence consequently becomes part of the manufacturer’s market-access offer, with the required records determined by both material scope and destination.
Regulatory Table of Textile Market
| Decision factor | United States | Brazil | France | China | Saudi Arabia |
|---|---|---|---|---|---|
| Primary authority | Environmental Protection Agency | Inmetro | DGCCRF, Bureau des produits industriels 5A | State Administration for Market Regulation and local market-supervision departments | SASO framework and designated regulatory and market-surveillance authorities |
| Key instruments or direction | TSCA section 8(a)(7) PFAS reporting; imported-article exemption proposed | Portaria Inmetro No. 118/2021 | EU Regulation 1007/2011 | SAMR Order No. 119, effective July 1, 2026 | Textile Products Technical Regulation Issue 2, mandatory July 12, 2024 |
| Commercial effect | Historical PFAS uses, production, disposal, exposure and hazard reporting for covered entities | Permanent, visible Portuguese supplier-identity, origin, fiber-content and care information, plus size when applicable | Compliant textile labeling, marking or accompanying commercial documents | Incoming-material records for covered household-use and nonhousehold wadding products; recycled-input labeling where applicable | Safety, labeling and conformity documentation for covered nonmedical textile categories |
| Current policy attractiveness | Medium | Medium | Medium | Medium | Medium |
| Future direction of policy attractiveness | Easing | No change | No change | No change | No change |
| Source: Mordor Intelligence | |||||
France and Brazil receive Medium ratings with No change directions because their covered textile-product obligations center on material information, with Brazil additionally requiring permanent, visible Portuguese-language presentation. China’s Medium and No change assessment reflects quality-management, incoming-material and applicable recycled-input disclosure duties already effective for its covered fiber-product categories. The U.S. timing relief and the imported-article exemption proposed in November 2025 support an Easing outlook, while historical PFAS-reporting work for covered manufacturers and importers sustains the Medium current rating. Saudi Arabia’s operative Issue 2 duties support its Medium and No change assessment, leaving documented product conformity as the practical market-access task for covered nonmedical textiles.
Value Chain Stages
The comparison follows fiber and yarn supply, fabric manufacture, and functional conversion as successive activities in textile production. Toray Industries Inc. manufactures and sells fibers, yarns, and fabrics, while Arvind Ltd. produces woven and denim fabrics. Freudenberg Performance Materials, part of Freudenberg Group, manufactures coated textiles and other technical materials. These roles allow integrated manufacturers to capture product-sales value at several transformation steps, while specialists can compete through the functionality of their textile output.
Value Chain Analysis Table of Textile Market
| Primary activity | Key participants | Value capture | Bottleneck | Resilience response |
|---|---|---|---|---|
| Fiber and yarn supply | Fiber and yarn manufacturers such as Toray Industries Inc. | Fiber and yarn sales | Matching input specifications to downstream fabric requirements | Agree fiber and yarn specifications with fabric converters |
| Fabric manufacture | Fabric manufacturers such as Toray Industries Inc. and Arvind Ltd. | Sales of manufactured fabrics | Reproducing the specified fabric construction at production scale | Qualify construction settings before extending a fabric program |
| Functional textile conversion | Coated-textile manufacturers such as Freudenberg Performance Materials | Sales of coated textile materials | Translating application requirements into a repeatable coated construction | Qualify coated constructions with the intended industrial user |
| Source: Mordor Intelligence | ||||
EU member states must establish separate collection systems for used textiles from 2025 under the Waste Framework Directive.[3] That obligation creates a reason to connect manufacturing specifications with material streams that may return after use. For manufacturers considering recovered inputs, the structural opening is to connect collection with a defined conversion route that can deliver a usable fabric.
Competitive Landscape
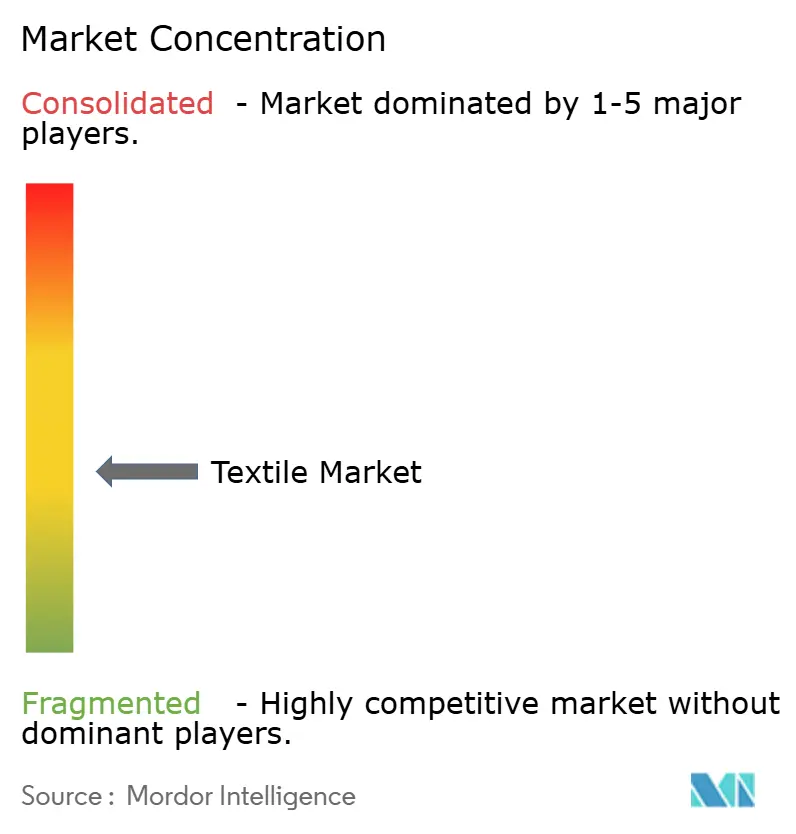
The supply base is fragmented across material and fabric operations, while downstream fashion groups provide another source of commercial influence. Toray Industries Inc.’s Fibers & Textiles segment accounted for 41% of its company revenue in FY2025 and included synthetic fibers, textiles, garments, airbag fabrics, and nonwovens. Weiqiao Pioneering Group Co. Ltd. and Texhong International Group Limited operate textile-manufacturing businesses. Inditex S.A. and Aditya Birla Fashion & Retail Ltd. operate downstream fashion businesses, with the latter’s retained platform spanning ethnic, value and masstige, digital-first brands, and luxury. These different roles give manufacturing integration and control of apparel brands distinct forms of influence over fabric supply relationships.
In 2025, Shandong’s Department of Industry and Information Technology selected Weiqiao Pioneering Group’s textile AI model project for a provincial program covering spinning, weaving, dyeing and garment production. At December 31, 2025, Texhong International Group Limited’s operating facilities in China, Vietnam, Turkey and the Americas had about 4.26 million spindles and more than 1,700 weaving and knitting machines. Aditya Birla Fashion & Retail Ltd. completed the demerger of Madura Fashion & Lifestyle into Aditya Birla Lifestyle Brands Limited, effective May 1, 2025, with separate listing following in June 2025. These developments distinguish digital-production strategy and multi-country manufacturing capability from portfolio restructuring, which changes the commercial counterpart for suppliers serving the transferred brands.
In 2025, Sunbrella completed PFAS-free manufacturing across all its fabrics. The brand, marketed by Dickson-Constant within Glen Raven, retained upholstery water repellency under ISO 4920, while reporting possible reductions in oil resistance and gradual increases in wettability over time. This makes material-compliance positioning a performance tradeoff that suppliers need to explain for the intended textile use. In 2025, 88% of the fibers in Inditex products met its own lower-impact criteria, and recycled fibers accounted for 47% of its total fiber use. For fabric producers, the competitive opening is to combine documented material content with end-use performance, allowing a single textile offer to address both a brand’s sourcing criteria and its functional requirements.
Textile Industry Leaders
-
Toray Industries Inc.
-
Weiqiao Pioneering Group Co. Ltd.
-
Texhong Textile Group Ltd.
-
Inditex S.A.
-
Aditya Birla Fashion & Retail Ltd.
- *Disclaimer: Major Players sorted in no particular order
Textile Market Companies Covered in this Report
- Toray Industries Inc.
- Weiqiao Pioneering Group Co. Ltd.
- Texhong Textile Group Ltd.
- Inditex S.A.
- Aditya Birla Fashion & Retail Ltd.
- Hyosung TNC Corp.
- Far Eastern New Century Corp.
- PVH Corp.
- Nisshinbo Holdings Inc.
- Arvind Ltd.
- Chori Co. Ltd.
- DuPont de Nemours Inc.
- Freudenberg Group
- Magnera Corporation
- Lenzing AG
- Reliance Industries Ltd. (RIL)
- Shandong Ruyi Technology Group
- Low & Bonar Limited
- Kimberly-Clark Corp.
Key Opportunities for Market Participants
The comparison assesses textile-material openings for suppliers serving apparel brands and producers responsible for products at the end of use. The European Commission plans textile-apparel ecodesign and Digital Product Passport requirements through a delegated act with indicative adoption in Q4 2027, subject to timing changes. Directive (EU) 2025/1892 also establishes a duty for member states to ensure producer responsibility for listed textile, textile-related, and footwear products first made available on their markets through national implementation. Manufacturers can compete on how well their fabric and its supporting information fit those downstream obligations and sourcing objectives.
Market Opportunities Table of Textile Market
| Opportunity | Why now | Buyer / lead segment | Recommended play | Main barrier | Likely beneficiaries |
|---|---|---|---|---|---|
| Apparel fabrics with transferable provenance records | Preparation for the planned EU textile-apparel framework | Apparel brands serving EU consumers | Supply fabric with material records usable in the brand’s garment data system | Maintaining information continuity through apparel conversion | Fabric mills able to provide usable provenance records |
| Fiber-to-fiber recycled-polyester apparel fabrics | PUMA and Cobra’s 2025 fiber-to-fiber share was 11.5% of recycled polyester apparel fabric, against a 30% target for 2030 | PUMA and Cobra apparel programs | Qualify fabric with documented fiber-to-fiber recycled-polyester content | Demonstrating consistent claimed content in the finished fabric | Fabric manufacturers qualifying for these buyer programs |
| Recovery-oriented fabric constructions | Adopted EU producer-responsibility framework | Producers of covered textile products serving EU consumers | Develop material constructions around the buyer’s intended recovery route | Preserving end-use performance while changing construction | Textile manufacturers linking fabric design with recovery requirements |
| Source: Mordor Intelligence | |||||
These plays converge on a fabric that a brand can qualify as part of a defined material program. An early supplier position depends on demonstrating the claimed material attributes in the finished fabric and carrying supporting information through apparel conversion. The opening is strongest where that work advances a named buyer’s sourcing objective, as PUMA and Cobra’s fiber-to-fiber goal does, with textile performance maintained during qualification.
Recent Industry Developments in Textile Market
- Sep 2026: Carbios reported successful production of recycled-polyester T-shirts from complex textile and plastic waste on European industrial manufacturing lines with Patagonia, PUMA, and Salomon.
- Jun 2026: Grasim Industries announced plans for 110,000 metric tons per year of lyocell capacity in two 55,000-metric-ton-per-year lines at Harihar, Karnataka, with commissioning expected in 2028 and 2030.
- Apr 2026: The U.S. Environmental Protection Agency set the start of covered manufacturers’ and importers’ PFAS reporting for January 31, 2027, or 60 days after a substantive final rule’s effective date, whichever comes first.
Textile Market Report Scope and Research Methodology
Market Definition and Coverage
The global textile market measures annual spending on manufactured textile materials and structures sold for use in industries and households worldwide. It covers textile products classified by fiber material, manufacturing method, end use, and region.
Scope exclusions: Separately sold raw fibers and yarns, finished apparel and garments, textile manufacturing machinery and equipment, and standalone textile finishing or treatment services are excluded.
Segments Covered in This Report
- By Application
- Fashion and Apparel
- Industrial/Technical Textiles
- Household and Home Textiles
- Medical and Healthcare Textiles
- Automotive and Transport Textiles
- Other Applications (Protective, Sports Textiles, etc.)
- By Raw Material
- Natural Fibers
- Cotton
- Wool
- Silk
- Synthetic Fibers
- Polyester
- Nylon
- Rayon / Viscose
- Acrylic
- Polypropylene
- Recycled Fibers
- Other Raw Materials (Specialty High-Performance Fibers (Aramid, Carbon, UHMWPE))
- Natural Fibers
- By Process / Technology
- Woven
- Knitted
- Non-woven
- Spunlaid (Spunbond / Melt-blown)
- Dry-laid Hydro-entangled
- Wet-Laid
- Needle-punched
- 3-D Weaving and Spacer Fabrics
- By Geography
- North America
- United States
- Canada
- Mexico
- South America
- Brazil
- Argentina
- Peru
- Rest of South America
- Europe
- United Kingdom
- Germany
- France
- Italy
- Spain
- BENELUX (Belgium, Netherlands, and Luxembourg)
- NORDICS (Denmark, Finland, Iceland, Norway, and Sweden)
- Rest of Europe
- Asia-Pacific
- China
- India
- Japan
- Australia
- South Korea
- ASEAN (Indonesia, Thailand, Philippines, Malaysia, Vietnam)
- Rest of Asia-Pacific
- Middle East and Africa
- Saudi Arabia
- United Arab Emirates
- Qatar
- Kuwait
- Turkey
- Egypt
- South Africa
- Nigeria
- Rest of Middle East and Africa
- North America
Data Sources, Market Sizing, and Validation
Desk Research
Public evidence such as the WTO merchandise trade statistics, USDA Economic Research Service cotton and wool outlook, European Environment Agency textile value-chain data, and European Commission textile policy materials can anchor trade, input supply, manufacturing activity, and end-use context. These sources also help interpret regulatory and circularity changes that can shape product demand and specifications.
Company filings, annual reports, investor materials, and reputable business or trade press can add producer capacity, sales, product mix, prices, and announced investments for cross-checks against those industry signals. These sources are illustrative and not exhaustive, and further sources inform collection, validation, and clarification.
Primary Interviews and Surveys
Interviews and structured surveys can include textile manufacturers, fiber and yarn suppliers, fabric converters, and buyers in apparel, home, medical, transport, and technical applications, with respondents selected across global regions and company sizes. The analyst uses their input to check source definitions, capacity and utilization assumptions, material and end-use shares, pricing and demand drivers, and forecast variables against secondary evidence. Where answers or source series leave a gap, the analyst records the affected variable, checks it against an independent production, trade, price, or company disclosure series, and uses a bounded estimate only when the evidence supports it.
Distribution of primary research fieldwork respondents
| Company type | Respondent position | Region |
|---|---|---|
| Top tier: 30% | CXOs: 20% | APAC: 50% |
| Mid tier: 45% | Functional/Unit leaders: 35% | EMEA: 28% |
| Smaller Players: 25% | Managers: 45% | Americas: 22% |
Market-Sizing & Forecasting
A top-down global model estimates annual manufacturer sales of completed textile materials and structures at ex-factory value, then distributes the total across material, process, application, and regional categories using production, trade, and end-use evidence. Key indicators include fiber output and input prices, textile manufacturing production and capacity utilization, merchandise trade values and volumes, apparel and home demand, and technical-textile demand from medical, automotive, and construction users. Each indicator informs the relevant market driver, price or mix movement, and segment share. A multivariate regression can relate historical textile sales to production, trade, end-use demand, and input-price movements, while scenario analysis adjusts the forecast for changes in sourcing, recycled-fiber availability, energy costs, and compliance requirements. Selective bottom-up checks use supplier sales roll-ups or sampled average selling price times output volume to test regional and product totals. Where a supplier series covers only part of the market, the analyst aligns it to the included products and corroborates the adjustment with independent production or trade data. When source series use different product classifications, the analyst maps each indicator to completed textile products before incorporating it, and primary experts can check the plausibility of each variable's forecast against operating conditions and buyer demand.
Data Validation & Update Cycle
Analysts triangulate the market total and segment estimates across public trade and production series, company disclosures, pricing evidence, and primary inputs, then investigate variance and outliers against the source definition, period, currency, and unit before sign-off. They re-contact a respondent when an answer conflicts materially with a cited company disclosure, when a key assumption changes, or when a source definition needs clarification. The model is refreshed annually, updated between cycles for material trade, input-cost, regulatory, or capacity events, and reviewed in a fresh pre-delivery pass.
Mordor Intelligence's Textile Market Size Versus Other Published Estimates
Published estimates can differ in the transactions and products they count and the inputs used to model demand. The global textile market measures annual spending on manufactured textile materials and structures sold for use in industries and households worldwide.
Key Gap Drivers include the study's defined coverage and market-specific modeling choices. Key indicators include fiber output and input prices, textile manufacturing production and capacity utilization, merchandise trade values and volumes, apparel and home demand, and technical-textile demand from medical, automotive, and construction users.
Benchmark comparison
| Source | Market Size | Gaps in Research Methodology |
|---|---|---|
| Mordor Intelligence | USD 0.83 T (2027) | |
| Global Consultancy A | USD 2.12 T (2025) | At its 2025 base, this estimate is 155.4% above this report's 2027 value of USD 0.83 T, 2 years later. Its published application categories include fashion and clothing, including apparel, clothing accessories, and handbags, beyond completed textile-material sales. |
| Global Consultancy B | USD 2.15 T (2025) | At its 2025 base, this estimate is 159.0% above this report's 2027 value of USD 0.83 T, 2 years later. Its stated market categories include fiber and yarn mills, plus textile finishing and coating mills, beyond completed textile-material sales. |
Mordor Intelligence's analysts triangulate the market total and segment estimates across public trade and production series, company disclosures, pricing evidence, and primary inputs, then investigate variance and outliers against the source definition, period, currency, and unit before sign-off.
Key Questions Answered in the Report
What is the textile market size and growth outlook?
The size is estimated at USD 0.83 trillion in 2027 and is forecast to reach USD 1.04 trillion by 2032, at a CAGR of 4.55% during 2027-2032.
What is driving demand for textile materials?
Traceability and sourcing requirements are important forces. In 2026, approximately 63% of surveyed U.S. fashion companies encouraged suppliers to incorporate more U.S. cotton in response to UFLPA.
Which application leads fabric demand?
Fashion and apparel accounted for 55.9% of the market in 2026. Industrial/technical textiles are forecast to grow fastest at a CAGR of 5.65% during 2027-2032.
Which companies shape textile supply and apparel buying?
Toray Industries Inc., Weiqiao Pioneering Group Co. Ltd., and Texhong International Group Limited participate in manufacturing. Inditex S.A. and Aditya Birla Fashion & Retail Ltd. operate downstream fashion businesses.
What cost pressure constrains textile manufacturers?
In July 2026, the Southern India Spinners Association called for removal of a Tamil Nadu rooftop-solar network charge. Such costs can limit the economic attraction of on-site generation for mills.
Which regions lead the textile-material industry?
Asia-Pacific held 54.2% of the market in 2026. The Middle East and Africa region is projected to grow fastest at a CAGR of 5.4% during 2027-2032.