Synthetic Aperture Radar Market Size and Share
Market Overview
| Study Period | 2020 - 2031 |
|---|---|
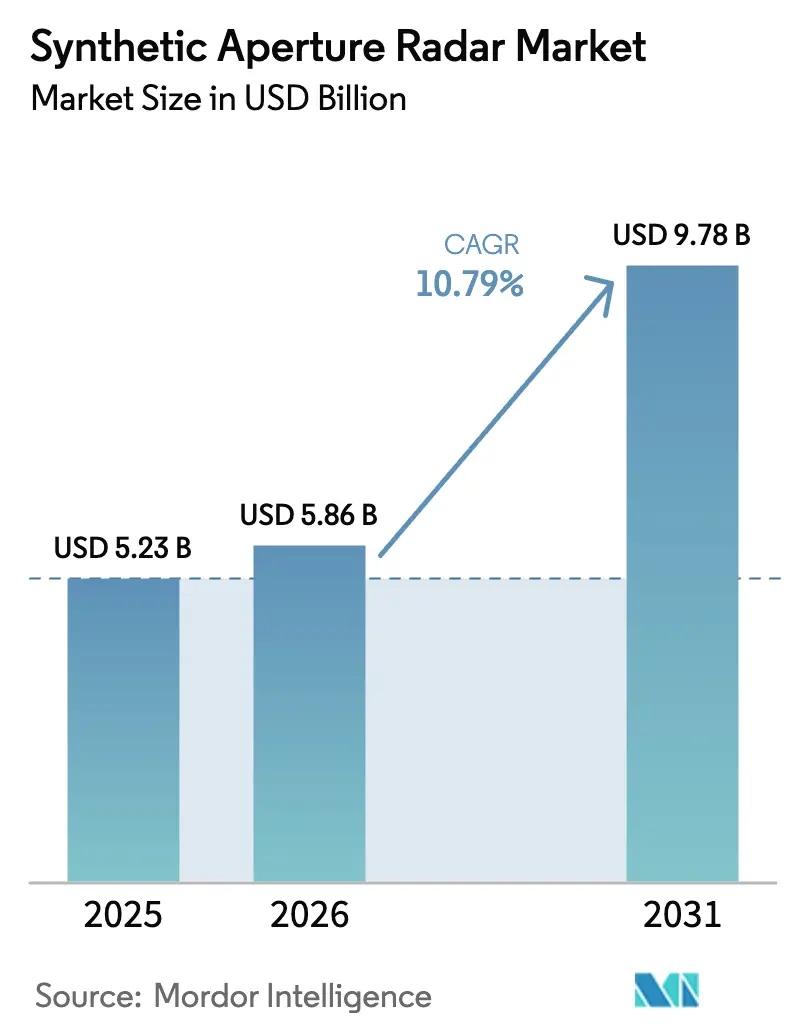
| Market Size (2026) | USD 5.86 Billion |
| Market Size (2031) | USD 9.78 Billion |
| Growth Rate (2026 - 2031) | 10.79% CAGR |
| Fastest Growing Market | Asia Pacific |
| Largest Market | North America |
| Market Concentration | Medium |
Major Players *Disclaimer: Major Players sorted in no particular order Image © Mordor Intelligence. Reuse requires attribution under CC BY 4.0. | |
Synthetic Aperture Radar Market Analysis by Mordor Intelligence
The Synthetic Aperture Radar Market size is projected to expand from USD 5.23 billion in 2025 and USD 5.86 billion in 2026 to USD 9.78 billion by 2031, registering a CAGR of 10.79% between 2026 to 2031.
This growth reflects an industry pivot toward proliferated small-satellite constellations that compress revisit times to less than one day and push commercial image resolution toward 16 centimeters. Defense ministries in Europe and North America are reallocating procurement budgets from bespoke platforms to subscription-based data feeds, while commercial customers adopt SAR data for infrastructure integrity, maritime domain awareness, and disaster response. Competitive pressure is intensifying as new-space operators adopt cloud-native delivery models, and spectrum congestion in X-band and C-band is nudging the industry toward Ka-band architectures. Government carbon-monitoring mandates in Europe and North America add another durable growth vector by institutionalizing the use of interferometric techniques for surface-deformation tracking.
Key Report Takeaways
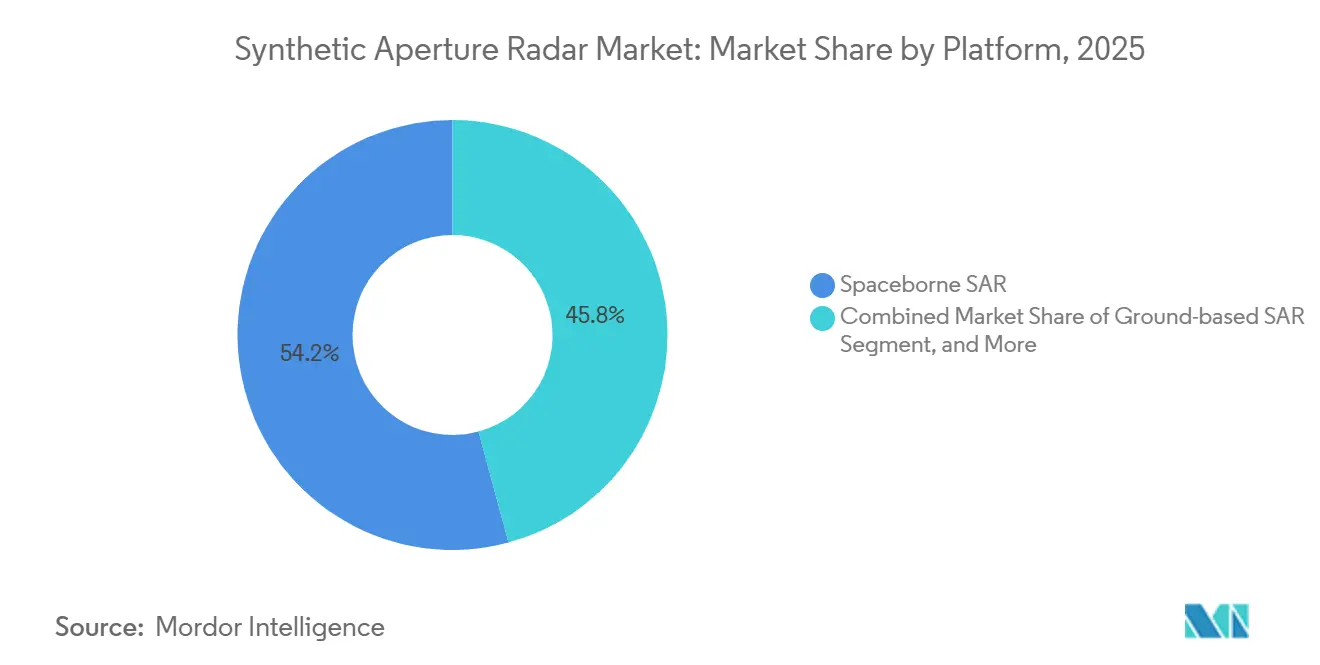
- By platform, spaceborne systems led with 54.19% revenue share in 2025; maritime-based systems are projected to expand at an 11.29% CAGR through 2031.
- By frequency band, X-band commanded 35.28% revenue share in 2025; Ka-band is forecast to grow at an 11.16% CAGR to 2031.
- By component, antennas held 27.16% share of the synthetic aperture radar market size in 2025, while data processor and software is expected to advance at a 12.01% CAGR through 2031.
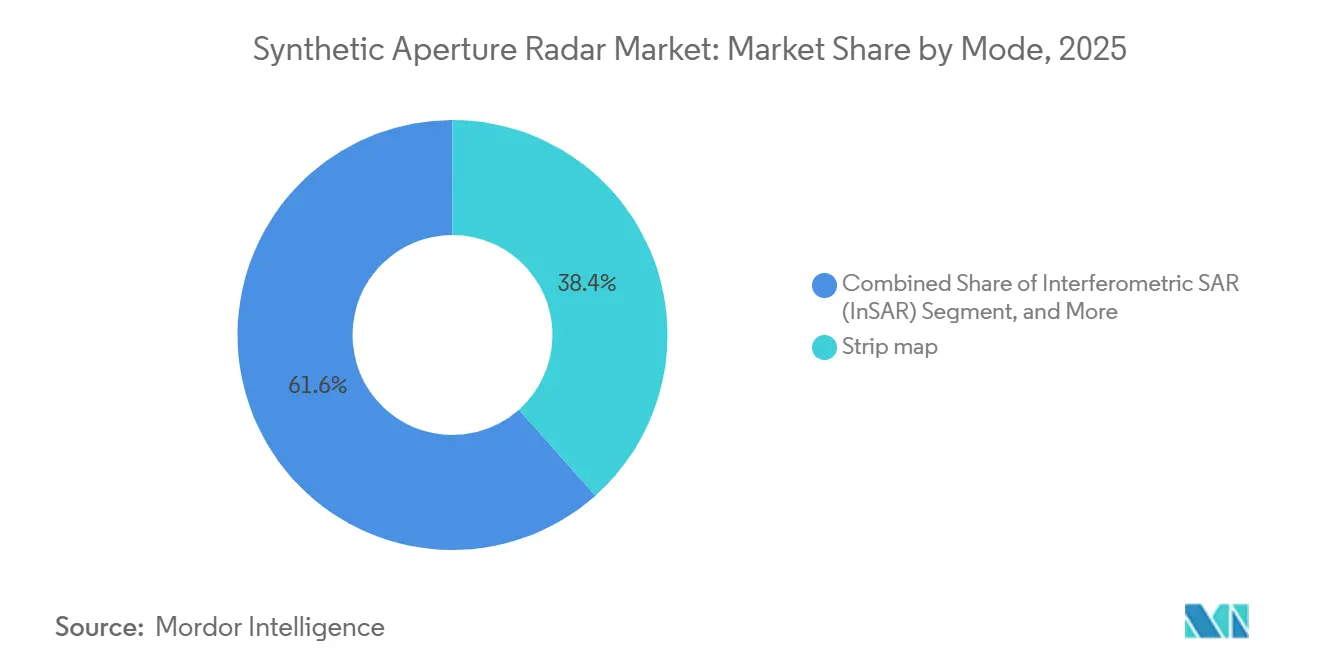
- By mode, stripmap captured 38.43% of synthetic aperture radar market share in 2025; interferometric SAR is poised to grow at an 11.59% CAGR through 2031.
- By application, military and defense accounted for 48.67% of 2025 revenue; infrastructure monitoring is projected to post an 11.95% CAGR to 2031.
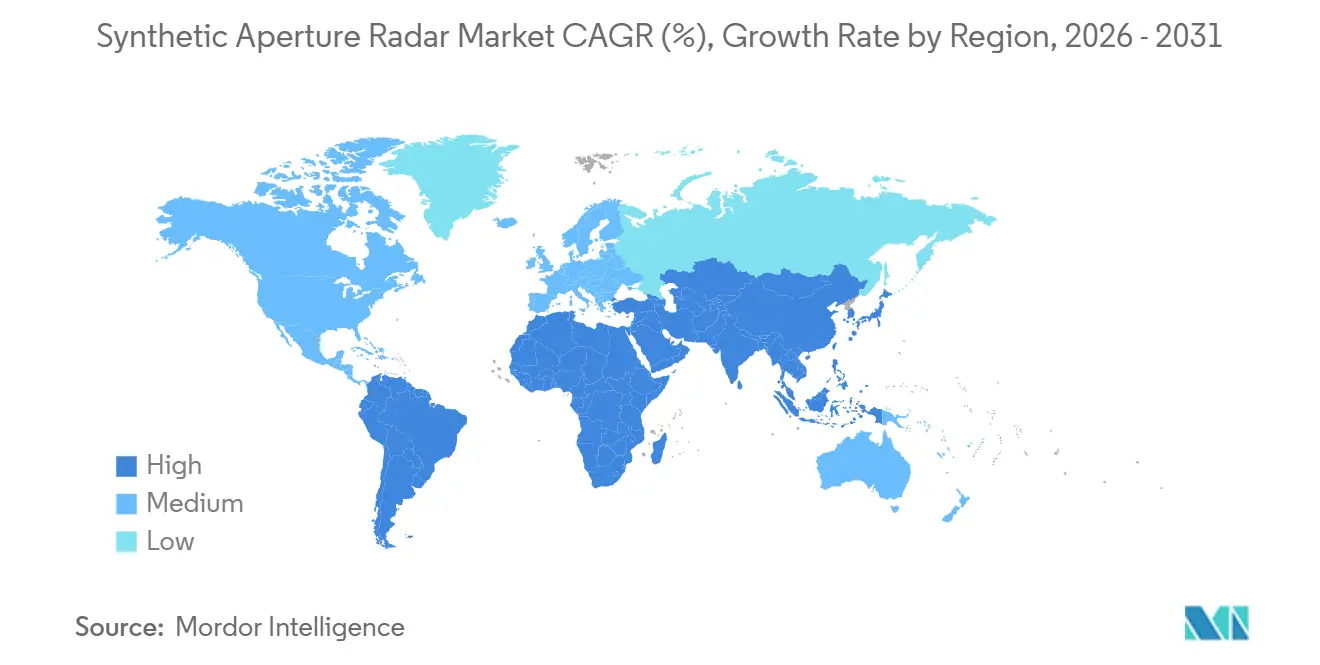
- By geography, North America led with 41.39% share in 2025; Asia-Pacific is forecast to be the fastest-growing region at a 12.22% CAGR through 2031.
Note: Market size and forecast figures in this report are generated using Mordor Intelligence’s proprietary estimation framework, updated with the latest available data and insights as of January 2026.
Global Synthetic Aperture Radar Market Trends and Insights
Drivers Impact Analysis*
| Driver | (~) % Impact on CAGR Forecast | Geographic Relevance | Impact Timeline |
|---|---|---|---|
| Increased Defence-Sector Surveillance Budgets | +2.30% | Global, concentrated in North America, Europe, and Asia Pacific | Medium term (2-4 years) |
| Proliferation of Small-Satellite SAR Constellations | +2.80% | Global, led by North America and Europe, expanding to Asia Pacific | Short term (≤ 2 years) |
| All-Weather Disaster-Response Imaging Demand | +1.40% | Global, peak impact in Asia Pacific, South America, and Africa | Medium term (2-4 years) |
| AI-Driven SAR Analytics Service Models | +1.90% | Global, early adoption in North America and Europe | Medium term (2-4 years) |
| Multi-Static SAR Constellations (≤30-Minute Revisit) | +1.20% | Global, initial deployments in North America and Europe | Long term (≥ 4 years) |
| Sovereign ISR Demand From Mid-Tier Nations | +1.60% | Asia Pacific, Middle East, and South America | Medium term (2-4 years) |
| Carbon-Monitoring Mandates for Net-Zero Compliance | +1.10% | Global, strongest in Europe and North America | Long term (≥ 4 years) |
| Source: Mordor Intelligence | |||
Increased Defense-Sector Surveillance Budgets
Defense agencies now prioritize commercial SAR subscriptions over sovereign satellite builds because subscriptions cut acquisition time and spread geopolitical risk across multiple vendors. Finland awarded ICEYE EUR 158 million (USD 172 million) in November 2024 for persistent coverage, and Poland followed with a USD 227 million contract in 2025.[1]Jason Rainbow, “ICEYE Wins EUR 158 Million Finnish Defense Contract,” SpaceNews, spacenews.com Greece and the Netherlands signed additional agreements totalling USD 150 million, showing that smaller NATO members view rapid-refresh SAR as essential for intelligence dominance. The United Kingdom’s Oberon program dedicated GBP 127 million (USD 161 million) to integrate commercial feeds into joint fusion centers, sidestepping traditional prime-contractor models.[2]UK Ministry of Defence, “Defence Space Strategy: Oberon Program,” gov.uk These deals indicate that budget allocations increasingly favour analytics software and ground-segment upgrades rather than new spacecraft builds.
Proliferation of Small-Satellite SAR Constellations
Operators have validated that constellations of 50-100 satellites deliver sub-hourly revisit intervals at lower capital risk than a single heavy spacecraft. ICEYE operated 62 satellites by November 2025, each weighing under 100 kilograms yet offering 16-centimeter resolution and 400-kilometer swath widths.[3]ICEYE, “Generation 4 Product Sheet,” iceye.com Capella Space’s Acadia series targets 36 satellites by 2027 with sub-meter resolution, and Umbra plans further launches to broaden global coverage.[4]Capella Space, “Acadia Constellation Expansion,” capellaspace.com The distributed model supports incremental technology refresh every two years and enables tasking to surge during crises without compromising uptime.
AI-Driven SAR Analytics Service Models
Machine-learning models now automate vessel detection, change analysis, and deformation mapping, moving revenue toward cloud-delivered insights rather than pixel downloads. The European Space Agency’s mission proved that onboard AI could filter scenes and cut downlink volume by 70%. ICEYE’s AI4SAR toolkit delivers pretrained models through cloud APIs, while Amazon Web Services and Google Earth Engine host SAR libraries that non-specialists can query at petabyte scale. These advances unlock new addressable markets in insurance, finance, and logistics, where users lack remote-sensing expertise yet demand actionable intelligence.
All-Weather Disaster-Response Imaging Demand
Emergency management agencies rely on SAR for flood mapping, earthquake deformation, and landslide detection because optical sensors fail at night or under clouds. The Copernicus Emergency Management Service processed more than 1,200 SAR activations in 2024-2025, often delivering wall-to-wall coverage within 12 hours. NASA integrates forthcoming NISAR L-band data to monitor Asian river basins where monsoon clouds block optical revisits for weeks. Operators are pre-positioning ground stations near disaster-prone regions to slash latency and meet humanitarian response timelines.
Restraints Impact Analysis*
| Restraint | (~) % Impact on CAGR Forecast | Geographic Relevance | Impact Timeline |
|---|---|---|---|
| High Spaceborne SAR Development and Launch Costs | -1.80% | Global, most acute in emerging markets and mid-tier nations | Medium term (2-4 years) |
| Power and Down-Link Limits in Small-Sat Platforms | -1.30% | Global, concentrated in small-satellite operators | Short term (≤ 2 years) |
| RF-Spectrum Congestion in X / C Bands | -0.90% | Global, peak interference in North America, Europe, and Asia Pacific | Medium term (2-4 years) |
| Export-Control Barriers for Dual-Use SAR Payloads | -1.10% | Global, most restrictive for technology transfers to Middle East, Africa, and South America | Long term (≥ 4 years) |
| Source: Mordor Intelligence | |||
High Spaceborne SAR Development and Launch Costs
Even miniaturized SAR payloads require precision phased-array antennas, high-power transmitters, and radiation-hardened processors, keeping unit hardware costs in the USD 15 million–USD 30 million range. Although rideshare launches have lowered ticket prices, a 500-kilogram class mission still pays USD 10 million–USD 20 million for launch alone. Mid-tier nations often pivot to data subscriptions because sovereign programs demand upfront financing and long qualification cycles. Insurance premiums add another 10%-15% because deployable antennas and high-power amplifiers raise on-orbit risk profiles.
Power and Down-Link Limits in Small-Sat Platforms
A 100-kilogram satellite generates only 200-400 watts from solar arrays, yet a high-resolution stripmap requires peak power near 1 kilowatt, forcing operators to duty-cycle imaging and accept gaps. A single high-resolution scene can exceed 10 gigabits, but typical X-band or Ka-band downlinks peak at 1 gigabit per second, necessitating several ground passes. ICEYE offsets the mismatch with onboard compression and queued downloads, but operators still must balance revisit frequency against data-throughput bottlenecks. Transitioning to Ka-band eases spectrum congestion yet introduces rain-fade challenges in tropical regions.
*Our forecasts treat driver/restraint impacts as directional, not additive. The impact forecasts reflect baseline growth, mix effects, and variable interactions.
Segment Analysis
By Platform: Spaceborne Dominance with Emerging Maritime Upside
Spaceborne platforms generated 54.19% of revenue in 2025, underscoring their unmatched ability to image denied areas and deliver global coverage without overflight clearances. The synthetic aperture radar market size for spaceborne systems is set to climb steadily thanks to falling launch prices, smaller bus architectures, and direct-to-cloud downlink pipelines that shorten tasking-to-delivery cycles. Maritime-based systems, although small today, are expected to log an 11.29% CAGR to 2031 as navies equip patrol craft with compact X-band radars that close gaps left by satellite revisit intervals.
Spaceborne constellations benefit from economies of scale, and operators refresh technology every 24 months rather than the decade-long cadence of legacy spacecraft. Maritime installations exploit ship power and hull stability to host larger antennas than aerial drones, improving detection of low-observable vessels in littoral zones. Airborne SAR, spanning manned aircraft and UAVs, retains tactical relevance because real-time line-of-sight links enable rapid target prosecution. Ground-based SAR remains a niche used for millimeter-precision monitoring of dams and mines yet contributes invaluable calibration data to on-orbit systems. Collectively, these dynamics ensure that the synthetic aperture radar market continues integrating multi-platform architectures that trade coverage for latency in mission-specific ratios.


By Frequency Band: X-Band Maturity Versus Ka-Band Precision
X-band captured 35.28% of 2025 revenue and will remain the synthetic aperture radar market’s workhorse because its 3-centimeter wavelength balances resolution against atmospheric attenuation. Operators favour X-band for day-night maritime surveillance, moving-target indication, and urban mapping. Ka-band, now advancing at an 11.16% CAGR, promises sub-decimeter resolution that unlocks infrastructure monitoring use cases, yet it struggles with rain fade that limits reliability in equatorial climates.
L-band’s longer wavelength penetrates vegetation and soil, making it indispensable for deforestation analysis and earthquake deformation studies as highlighted by the upcoming NISAR mission. C-band sits in the middle, offering wider swath coverage for ice tracking and maritime domain awareness, while S-band and Ku-band support specialized missions such as dual-frequency interferometry and high-throughput experiments. Frequency diversity strategies that blend X-band dependability with Ka-band acuity are emerging, allowing operators to tier services based on customer tolerance for weather risk and resolution needs.
By Component: Hardware Share Shifts Toward Software Differentiation
Antenna assemblies accounted for 27.16% of 2025 component revenue because phased-array technologies still command premium prices. However, data processor and software lines are forecast to grow at a 12.01% CAGR as value migrates from hardware to algorithms that deliver analytics in near real time. The synthetic aperture radar market size tied to cloud processing rises each time an operator exposes APIs that let non-experts query deformation or vessel-tracking products in minutes.
Gallium-nitride power amplifiers and software-defined radios are commoditizing transmitters and receivers, lowering entry barriers for new-space firms. Power subsystems face thermal constraints on small buses, forcing innovations in deployable radiators and battery chemistries to sustain high-duty operation. Antenna vendors respond with lighter meta surface reflectors and digital beam-forming networks that cut mass without sacrificing gain, yet the strategic locus now sits in AI models that classify ships, predict floods, or flag millimetre-scale bridge sagging.
By Mode: Stripmap Breadth Competes with InSAR Precision
Stripmap retained 38.43% revenue share in 2025 because it delivers a pragmatic blend of resolution and wide-area coverage for reconnaissance and land-use change detection. In contrast, interferometric SAR is projected to expand at an 11.59% CAGR through 2031, driven by regulatory mandates that require continuous deformation monitoring of bridges, pipelines, and rail corridors across the European Union.
Spotlight mode offers resolutions below 50 centimeters, prized by defense agencies for denied area targeting, yet its narrow scene size limits commercial scalability. ScanSAR covers swaths beyond 400 kilometres, making it indispensable for maritime patrol and disaster assessment, though resolution tops out near 20 meters. Polarimetric SAR unlocks biomass estimation and land-cover classification but remains research-centric due to high processing complexity. As customers demand both coverage and precision, operators increasingly blend modes within a single pass, scheduling spotlight on high-priority targets while collecting stripmap context on the flanks, a practice that optimizes revenue per orbit in the synthetic aperture radar market.
By Application: Defense Core, Infrastructure Momentum
Military and defense contributed 48.67% of 2025 revenue, cementing their role as anchor customers for the synthetic aperture radar market. Infrastructure monitoring, projected to grow at an 11.95% CAGR, is scaling because millimetre-accurate InSAR reveals structural fatigue before catastrophic failure. Earth observation and environmental monitoring remain indispensable for climate science and carbon accounting, while oil and gas operators deploy SAR to detect offshore leaks and onshore subsidence.
Maritime surveillance uses wide-swath modes to spot illegal fishing and oil spills, with 500,000 vessel detections processed by the European Maritime Safety Agency in 2024 alone. Disaster-management authorities leverage SAR’s cloud-penetration to map floods within hours, and agriculture stakeholders integrate soil-moisture snapshots into yield models. As cloud platforms automate analytics, nontraditional verticals such as insurance and commodity trading enter the demand pool, ensuring that the synthetic aperture radar market opportunities diversify well beyond the defense sector.
Geography Analysis
North America commanded 41.39% of 2025 revenue thanks to multi-year imagery procurements by the National Reconnaissance Office and the National Geospatial-Intelligence Agency, whose collective contracts with ICEYE, Capella Space, and Umbra exceeded USD 400 million. Canada’s RADARSAT Constellation Mission reinforced Arctic sovereignty by supplying C-band data for ice charting and maritime safety. Mexico initiated pilot programs for flood response and border surveillance, albeit on constrained budgets, leveraging commercial subscriptions rather than sovereign spacecraft.
Asia Pacific is projected to lead growth at a 12.22% CAGR through 2031 as China, India, Japan, and South Korea invest in sovereign constellations to secure strategic autonomy. India’s NASA-ISRO NISAR mission, scheduled for 2026, will yield 12-day repeat-pass interferometry over all land masses, empowering Himalayan landslide monitoring and coastal subsidence studies. Japan’s ALOS-4, launched in March 2024, introduced enhanced L-band penetration for crop and forest analytics. China’s Gaofen-3 series and burgeoning commercial players scale capacity for Belt and Road monitoring, while South Korea targets a 2027 launch for its first indigenous high-resolution SAR. Southeast Asia leverages the Copernicus Emergency Management Service for typhoon and flood mapping, with over 200 activations recorded in 2024-2025.
Europe sustains leadership in open-data policy through Sentinel-1 and the European Ground Motion Service mandate, which requires millimetre-precision deformation monitoring of critical infrastructure. Germany, France, Italy, and the United Kingdom have parallel national programs that hedge dependency on shared assets. The Middle East accelerates adoption, exemplified by the UAE’s Space42 Foresight constellation launched in 2024 for Gulf maritime security. Africa and South America trail in absolute spending but exploit international charters to access imagery for agriculture and disaster relief, with Brazil focusing on Amazon deforestation oversight.

Competitive Landscape
Competition in the synthetic aperture radar market centers on resolution, revisit frequency, and latency from tasking to delivery. Legacy defense contractors Lockheed Martin, Northrop Grumman, RTX, BAE Systems, Thales, Leonardo, Airbus dominate capital-intensive large-satellite and airborne segments. New-space firms such as ICEYE, Capella Space, and Umbra tilt the playing field by launching agile constellations that refresh technology every two years, forcing incumbents to partner, acquire, or build their own small-sat units.
ICEYE’s Generation 4 bus achieves 16-centimeter resolution with a 400-kilometer swath width on sub-100-kilogram spacecraft, proving that small satellites can rival legacy systems while reducing unit risk. Capella Space secured an approximately USD 150 million National Geospatial-Intelligence Agency contract extension in 2025, underlining government appetite for commercial capacity. Umbra’s sub-meter constellation broadens coverage over contested maritime corridors, prompting traditional primes to market hosted-payload slots or data-subscription bundles to stay relevant.
Regulatory regimes shape competition: Wassenaar export restrictions limit dual-use technology transfers, which indirectly protect Western suppliers by constraining new entrants in the Middle East and Africa. Spectrum congestion in X-band and C-band incentivizes investments in Ka-band and multi-static architectures that distribute transmitter and receiver functions, thereby cutting per-satellite power budgets. Standards initiatives such as IEEE P3397 for image-quality metrics give customers transparent benchmarks and, over time, may commoditize basic imagery, shifting value capture toward analytics and fusion services.
Synthetic Aperture Radar Industry Leaders
Lockheed Martin Corporation
Airbus SE
Aselsan A.S.
BAE Systems PLC
Cobham PLC
- *Disclaimer: Major Players sorted in no particular order

Recent Industry Developments
- May 2025: ICEYE and Safran formed an AI-centric alliance to blend 25 cm radar imagery with multisensor analytics, targeting faster strategic decision cycles for governmental clients
- May 2025: Rheinmetall ICEYE Space Solutions launched to domestically manufacture SAR satellites in Germany from Q2 2026, reinforcing supply-chain sovereignty
- May 2025: IHI Corporation signed an MoU with ICEYE for a 24-satellite constellation, broadening Japan’s autonomous imaging network.
- January 2025: ICEYE added two mid-inclination satellites on SpaceX Bandwagon-2, pushing its constellation to 40 units.


Research Methodology Framework and Report Scope
Market Definitions and Key Coverage
Our study defines the synthetic aperture radar (SAR) market as all new airborne and spaceborne imaging radar systems, their payload hardware, and the enabling ground-segment software and processing electronics that together deliver two- or three-dimensional radar imagery for defense, civil, and commercial users. According to Mordor Intelligence, the market was valued at USD 5.79 billion in 2025 and is projected to reach roughly USD 9.9 billion by 2030, reflecting an 11.3 percent compound annual growth rate.
Scope exclusion: terrestrial fixed-site perimeter radars and purely passive radar data-analytics services are outside this study.
Segmentation Overview
- By Platform
- Airborne SAR
- Manned Aircraft
- UAV
- Spaceborne SAR
- Small Satellites (Less than equal 500 kg)
- Large Satellites (Greater than 500 kg)
- Ground-Based SAR
- Maritime-Based SAR
- Airborne SAR
- By Frequency Band
- X-Band
- L-Band
- C-Band
- S-Band
- Ku-Band
- Ka-Band
- Others, Frequency Band
- By Component
- Antenna
- Transmitter
- Receiver
- Data Processor and Software
- Power Supply
- Others, Component
- By Mode
- Stripmap
- Spotlight
- ScanSAR (Wide-Swath)
- Interferometric SAR (InSAR)
- Polarimetric SAR (PolSAR)
- By Application
- Military and Defence
- Earth Observation and Environmental Monitoring
- Oil and Gas Exploration
- Infrastructure Monitoring
- Maritime Surveillance
- Disaster Management and Agriculture
- Other Applications
- By Geography
- North America
- United States
- Canada
- Mexico
- South America
- Brazil
- Argentina
- Rest of South America
- Europe
- Germany
- United Kingdom
- France
- Italy
- Spain
- Russia
- Rest of Europe
- Asia Pacific
- China
- Japan
- India
- South Korea
- Australia and New Zealand
- Southeast Asia
- Rest of Asia Pacific
- Middle East
- Saudi Arabia
- United Arab Emirates
- Turkey
- Israel
- Rest of Middle East
- Africa
- South Africa
- Nigeria
- Egypt
- Rest of Africa
- North America
Detailed Research Methodology and Data Validation
Primary Research
Mordor analysts interviewed radar engineers at satellite manufacturers, procurement officers within defense ministries, and commercial geospatial-analytics buyers across North America, Europe, and Asia Pacific. Discussions validated average selling prices, typical satellite bus mass classes, constellation replenishment cycles, and emergent demand signals not captured in desk research.
Desk Research
We began with open data streams such as the United Nations launch registry, the European Space Agency's Copernicus archives, NASA's Earth Observatory missions, International Telecommunication Union filings on spectrum assignments, and Stockholm International Peace Research Institute defense-spending tables, which supply counts of satellites, imaging hours, program budgets, and regulatory milestones. Company 10-Ks, investor decks, and trade-association white papers round out pricing and procurement patterns. Paid intelligence from D&B Hoovers and Aviation Week provided revenue splits and production run insights for key SAR platform builders. These sources anchor historical baselines and cross-check each other; however, they are illustrative, not exhaustive, and many additional references inform our files.
Market-Sizing & Forecasting
A top-down reconstruction based on annual satellite launches, average payload cost, and unit shipment data created the initial market pool, which is then corroborated with selective bottom-up supplier roll-ups for antennas, transmit-receive modules, and onboard processors. Core variables inside our model include small-satellite launch counts, defense ISR budget growth, commercial imagery subscription revenues, mean payload mass to power ratios, and frequency-band mix shifts. Multivariate regression, guided by expert consensus, links these drivers to revenue trajectories, while gap-handling rules distribute unreported volumes proportionally across known vendors.
Data Validation & Update Cycle
Each draft output is stress tested through variance checks against independent capacity trackers and ASP benchmarks, followed by a two-step analyst review. The dataset refreshes annually, and interim updates are triggered when launch manifests, contract wins, or material regulatory rulings change the underlying assumptions.
Why Mordor's Synthetic Aperture Radar Market Baseline Commands Reliability
Published SAR figures often diverge because studies vary in platform coverage, currency conversion timing, and refresh cadence.
By selecting only platforms that carry imaging payloads and by revisiting key variables every twelve months, we keep our baseline tightly aligned with real delivery schedules.
Key gap drivers with other publishers include inclusion of ground radars, omission of small-satellite discounting, and the use of flat price escalators rather than cost-curve-based ASPs.
Benchmark comparison
| Market Size | Anonymized source | Primary gap driver |
|---|---|---|
| USD 5.79 B (2025) | Mordor Intelligence | - |
| USD 5.39 B (2024) | Global Consultancy A | Excludes processing software; applies higher future ASP uplift |
| USD 5.42 B (2024) | Industry Association B | Counts ground surveillance radars within scope |
| USD 4.65 B (2024) | Regional Consultancy C | Uses production units only, no services revenue |
Taken together, the comparison shows that Mordor's disciplined scope definition, variable selection, and yearly refresh provide a balanced and repeatable baseline that decision makers can rely upon when sizing opportunities or benchmarking performance.


Key Questions Answered in the Report
How large is the synthetic aperture radar market today?
The market was valued at USD 5.86 billion in 2026 and is projected to reach USD 9.78 billion by 2031.
Which platform segment leads revenue?
Spaceborne systems generated 54.19% of 2025 revenue, well ahead of airborne, maritime, and ground-based platforms.
What region will grow the fastest through 2031?
Asia Pacific is forecast to record a 12.22% CAGR as China, India, Japan, and South Korea deploy sovereign constellations.
Why is Ka-band attracting attention?
Ka-band enables sub-decimeter resolution that supports urban infrastructure monitoring, even though it faces rain-fade challenges.
What is driving uptake in infrastructure monitoring?
European Ground Motion Service mandates and cloud-based InSAR analytics reveal millimeter-scale deformation, prompting asset owners to adopt SAR subscriptions.
How are small-satellite constellations changing SAR economics?
Constellations of 50-100 low-mass spacecraft deliver sub-hourly revisits, lower capital risk, and faster technology refresh than traditional large satellites.
Page last updated on:


