Styrene Copolymers (ABS And SAN) Market Size and Share
Market Overview
| Study Period | 2020 - 2031 |
|---|---|
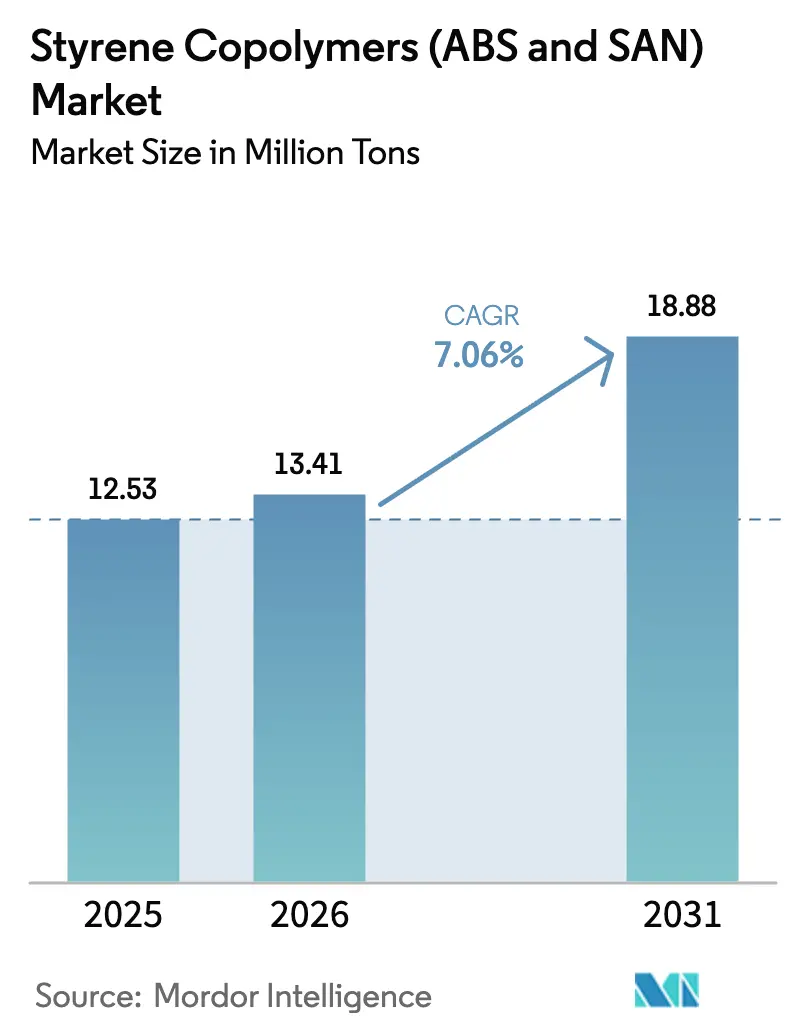
| Market Volume (2026) | 13.41 Million tons |
| Market Volume (2031) | 18.88 Million tons |
| Growth Rate (2026 - 2031) | 7.06% CAGR |
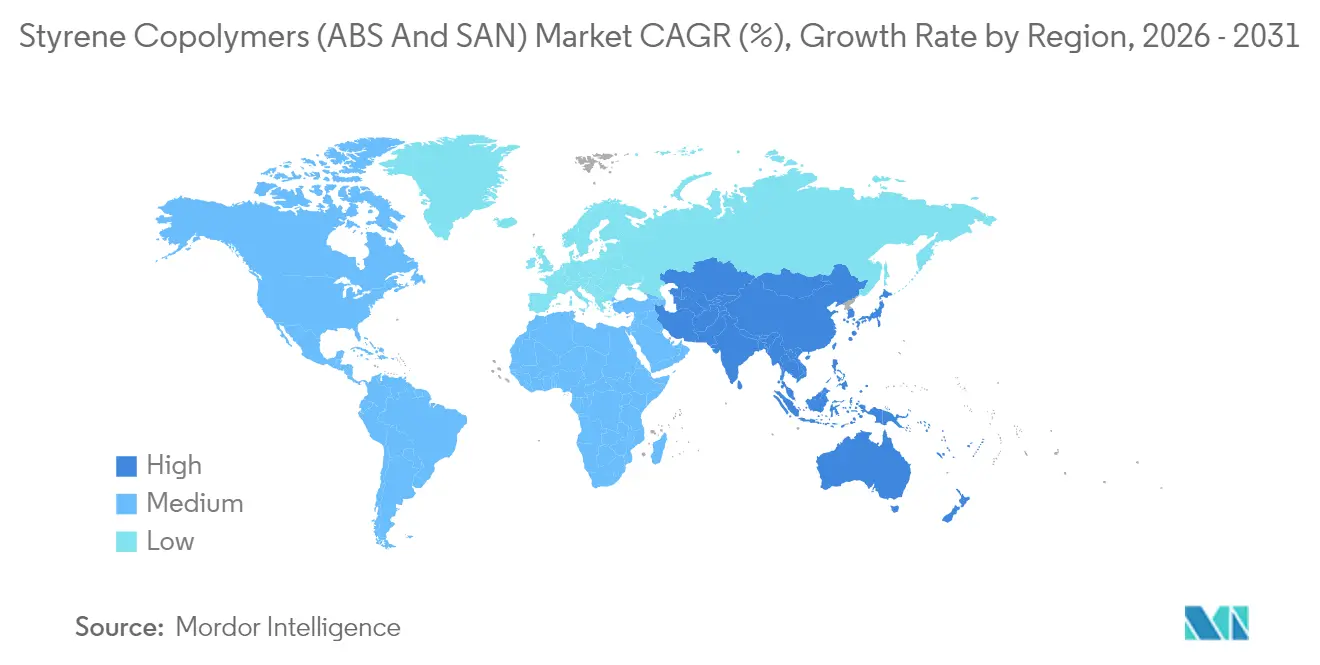
| Fastest Growing Market | Asia Pacific |
| Largest Market | Asia Pacific |
| Market Concentration | High |
Major Players *Disclaimer: Major Players sorted in no particular order Image © Mordor Intelligence. Reuse requires attribution under CC BY 4.0. | |
Styrene Copolymers (ABS And SAN) Market Analysis by Mordor Intelligence
The Styrene Copolymers (ABS and SAN) Market size is expected to grow from 12.53 million tons in 2025 to 13.41 million tons in 2026 and is forecast to reach 18.88 million tons by 2031 at 7.06% CAGR over 2026-2031. This growth curve reflects how electronics miniaturization, electric-vehicle interior innovations, and demand for recyclable packaging resins converge to elevate performance-grade polymers over commodity plastics. End-use customers now emphasize dimensional stability, impact resistance, and low-VOC emissions, prompting producers to prioritize specialty formulations and process upgrades. Capacity expansions in China, Vietnam, and Thailand are reshaping global trade flows, while bulk-polymerization routes gain favor for their lower emission profiles. Feedstock volatility and evolving European chemical-safety rules add cost pressure but also accelerate transitions toward integrated supply chains that can buffer price swings and streamline compliance.
Key Report Takeaways
- By polymer type, acrylonitrile-butadiene-styrene held a 70.12% styrene copolymers market share in 2025. Styrene-acrylonitrile is forecast to expand at a 7.22% CAGR through 2031, the fastest among polymer types.
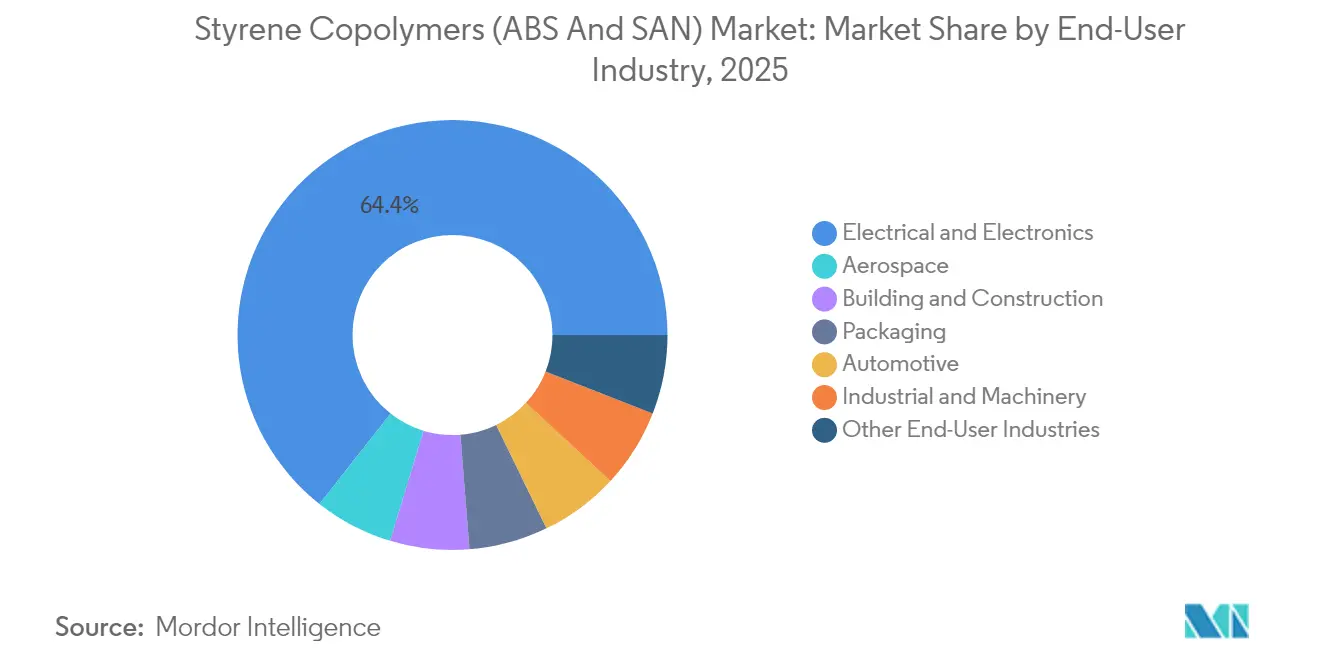
- By end-user industry, electrical and electronics commanded 64.38% of the styrene copolymers market size in 2025 and is advancing at an 8.23% CAGR to 2031.
- By geography, Asia-Pacific captured 72.05% revenue in 2025; it is projected to grow at a 7.58% CAGR, the highest among regions.
Note: Market size and forecast figures in this report are generated using Mordor Intelligence’s proprietary estimation framework, updated with the latest available data and insights as of 2026.
Global Styrene Copolymers (ABS And SAN) Market Trends and Insights
Drivers Impact Analysis*
| Driver | (~) % Impact on CAGR Forecast | Geographic Relevance | Impact Timeline |
|---|---|---|---|
| Booming e-mobility demand for high-impact interior parts | +1.80% | Global, led by China, Europe, North America | Medium term (2-4 years) |
| Rising appliance production in Southeast Asia | +1.20% | APAC core, spill-over to MEA | Short term (≤ 2 years) |
| 3D-printing grade ABS commercialization | +0.90% | North America & EU, expanding to APAC | Long term (≥ 4 years) |
| OEM shift toward low-VOC, odor-free ABS | +1.10% | Global, regulation-driven in EU & North America | Medium term (2-4 years) |
| Rapid SAN uptake in recycled PET alloy blends | +0.70% | Global, early adoption in packaging hubs | Long term (≥ 4 years) |
| Source: Mordor Intelligence | |||


Booming E-Mobility Demand for High-Impact Interior Parts
Electric-vehicle makers favor ABS for cockpit modules because the polymer delivers impact toughness, flame retardancy, and dimensional stability at reduced wall thickness. These properties support single-material dashboard concepts that simplify assembly and improve recyclability. OEM supplier consolidation intensifies, and qualified ABS grades with proven low-VOC performance become preferred specifications. Plant-based styrenics launched by INEOS Styrolution illustrate how sustainability imperatives now intersect with automotive material choices.
Rising Appliance Production in Southeast Asia
Vietnam, Thailand, and Malaysia attract refrigerator and washing-machine assembly through competitive labor costs and favorable trade rules. Local producers specify high-impact ABS housings to meet durability standards required for global exports. Regional supply contracts shorten lead times and lower logistics costs, allowing appliance firms to reduce dependence on Chinese imports. This distributed production landscape supports incremental demand for styrene copolymers market volumes and underpins new compounding capacity near assembly clusters.
3D-Printing Grade ABS Commercialization
Industrial additive-manufacturing lines now print jigs, fixtures, and small-batch parts with ABS variants engineered for low warpage and superior layer adhesion. Material certificates covering thermal shrinkage, dimensional tolerance, and flame performance command premium prices over commodity grades. Aerospace tooling, dental aligners, and custom electronics housings illustrate applications where printed ABS reduces machining steps and shortens design cycles. Suppliers that couple formulation know-how with printer-specific technical support secure defensible positions in this niche of the styrene copolymers market.
OEM Shift Toward Low-VOC, Odor-Free ABS
Consumer-electronics brands audit supply chains for indoor-air quality compliance, prompting demand for ultra-low emission grades. Trinseo’s 2024 price increase on ABS and SAN highlights willingness to pay for compliance-ready materials[1]“Trinseo Announces Price Increase for Polystyrene and ABS in Europe,” Trinseo, trinseo.com . Automakers, especially in Europe, extend similar protocols to interior trim. Testing regimes covering fogging, smell, and volatile organic compounds create high entry barriers that favor global producers with accredited laboratories and experience in formulation tweaks.
Restraints Impact Analysis*
| Restraint | (~) % Impact on CAGR Forecast | Geographic Relevance | Impact Timeline |
|---|---|---|---|
| Volatile butadiene & acrylonitrile feedstock prices | −1.40% | Global, especially integrated producers | Short term (≤ 2 years) |
| Regulatory pressure on styrenics in EU (CLP revision) | −0.80% | Europe with spillover to exporting regions | Medium term (2-4 years) |
| Competition from polypropylene-based alloys | -1.00% | Global, with highest impact in automotive and packaging | Medium term (2-4 years) |
| Source: Mordor Intelligence | |||
Volatile Butadiene & Acrylonitrile Feedstock Prices
Rapid shifts in crude-oil benchmarks ripple through C4 and nitrile supply chains, pushing monomer costs upward during tight cycles. Producers with captive crackers can smooth profitability, yet merchant compounders often face bid-ask mismatches that erode margins. Contract formulas offer partial relief but lag spot swings. This volatility restrains expansion plans in Europe and North America, although hedging strategies and dual-feedstock flexibility blunt the downside for Asia-Pacific petrochemical hubs.
Regulatory Pressure on Styrenics in EU (CLP Revision)
The EU is realigning chemical-hazard criteria, adding compliance layers for additives used in styrene copolymers. Large integrated firms marshal toxicology data and reformulation labs to meet new evidence requirements, while smaller converters consider outsourcing or product withdrawal. Importers must also submit dossiers, raising transaction costs that could redirect trade toward in-region production or certified supply corridors. These dynamics temper the styrene copolymers market penetration in Europe during the compliance cycle.
*Our forecasts treat driver/restraint impacts as directional, not additive. The impact forecasts reflect baseline growth, mix effects, and variable interactions.
Segment Analysis
By Polymer Type: Innovation Revitalizes ABS and SAN
ABS accounted for 70.12% of the styrene copolymers market share in 2025. The ABS segment is forecasted to grow, driven by appliance shells, EV interior modules, and game console casings. Bulk-polymerization investments aim to reduce benzene emissions and improve gloss uniformity, giving producers cost and sustainability advantages. SAN, while smaller, is projected to capture a 7.22% CAGR as recycled-PET blends, medical device hubs, and optical lenses reward its clarity and chemical resistance. This polymer bifurcation illustrates how the styrene copolymers market differentiates between mass-application resilience and niche-application transparency.
SAN’s rise also amplifies competitive intensity because capacity barriers are lower than for ABS lines that require elastomer rubber grafting. Fast-ramp projects allow regional converters to integrate SAN to meet local packaging mandates without large-scale capital. In contrast, new ABS mega-plants in China harness captive butadiene streams, reinforcing territorial supply dominance that may pressure ex-Asia export pricing. Thus, strategic responses vary: Western firms channel R&D funds into specialty resins, while Asian newcomers leverage scale to court commodity buyers.


By End-User Industry: Electronics Outpaces All Segments
Electrical and electronics commanded 64.38% of the styrene copolymers market size in 2025. The segment is anticipated to grow at an 8.23% CAGR by 2031. Smartphones, routers, and wearables require miniaturized, flame-retardant housings where ABS meets UL-94 ratings without sacrificing surface finish. Concurrent 5G rollouts expand demand for base-station radomes molded from UV-stabilized ABS. Automotive interior electronics, including infotainment clusters, intensify the same trend, accelerating polymer penetration per vehicle.
Other industries lag but still contribute. Building-and-construction applications rely on ABS junction boxes and pipe fittings because of easy processing and toughness. Packaging leans on SAN blends for transparent food containers that satisfy recycled-content quotas. Industrial machinery employs ABS for light housings and guard panels, valuing impact resistance and color consistency. Aerospace remains exploratory, focusing on 3D-printed mandrels and cabin inserts. Collectively, these niches diversify exposure yet reinforce electronics leadership within the styrene copolymers market.
Geography Analysis
Asia-Pacific generated 72.05% of global revenue in 2025, a dominance rooted in integrated electronics corridors that couple resin supply with high-volume assembly lines. China’s mega-plants and Southeast Asia’s appliance clusters elevate regional throughput. The region is forecast to reflect a 7.58% CAGR. Government incentives for EV production and favorable cross-border trade within ASEAN reinforce demand visibility. India climbs the value chain, adding compounding sites near consumer-electronics parks, while Vietnam’s free-trade accords lure OEM relocation.
North America benefits from shale-gas feedstock economics that lower ethylene and propylene costs, yet import competition forces rationalization. INEOS Styrolution’s decision to shutter its Ohio ABS plant underscores how overseas supply can undercut domestic commodity grades. Nonetheless, specialty ABS and SAN grades tailored for aerospace tooling and medical devices retain regional advantages tied to local certification and just-in-time delivery. U.S. tariffs on petrochemical imports could tilt the cost curve but remain politically contingent.
Europe faces triple headwinds: high energy costs, CLP regulatory tightening, and currency volatility. Producers concentrate on specialty compounds while divesting commodity lines, evidenced by planned closures and joint-venture exits. Import substitution from Asia increases, yet the need for guaranteed REACH compliance preserves turf for established EU suppliers in high-margin niches. Eastern Europe shows modest growth driven by white-goods exports to the EU. Meanwhile, Middle East capacity centered on integrated refineries targets export markets, with local demand still embryonic.

Competitive Landscape
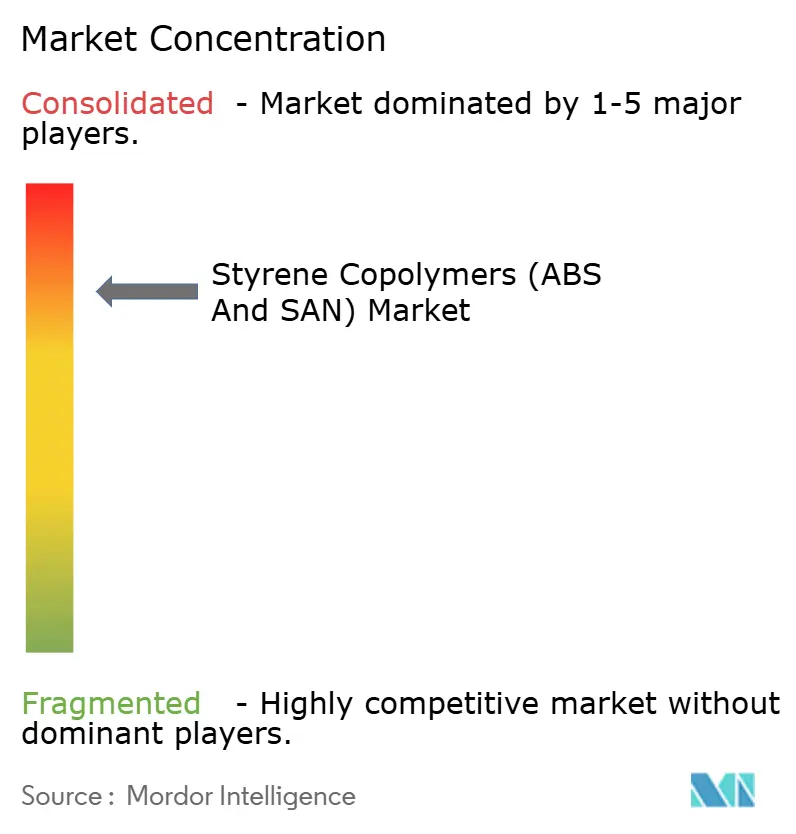
The styrene copolymers (ABS and SAN) market is consolidated. Global competition clusters around large integrated producers, such as SABIC, LG Chem, and INEOS Styrolution, which secure feedstock through captive crackers and wield extensive worldwide logistics networks. These leaders prioritize bulk-polymerization retrofits and bio-feedstock pilots to defend market share. Asian entrants, especially in China, commission 450 kt per-year ABS lines that leverage lower capex and proximity to appliance plants, eroding price premiums in commodity segments. Strategic alliances, including technology-license deals with European firms, enable rapid scale-up and quality parity.
Product differentiation focuses on low-VOC, flame-retardant, and bio-based resins. Specialty catalogs yield EBITDA margins that cushion feedstock shocks. Western firms expand 3D-printing resin portfolios for aerospace and prosthetics, while Asian players target automotive interiors under regional emission norms. Geographic portfolio pruning, such as asset divestitures in Thailand, reflects efforts to reduce fixed-cost exposure and optimize freight economics[2]“Styrolution to sell ABS and SAN production site in Thailand,” INEOS, ineos.com. Overall, the styrene copolymers market rewards firms that pair scale with application engineering.
Styrene Copolymers (ABS And SAN) Industry Leaders
CHIMEI
Formosa Plastics Group
INEOS
LG Chem
Trinseo
- *Disclaimer: Major Players sorted in no particular order

Recent Industry Developments
- December 2024: INEOS Styrolution, a subsidiary of INEOS, has entered into a definitive agreement to sell its ABS and SAN production facility in Map Ta Phut, Thailand, to Styrenix Performance Materials Limited. The transaction is anticipated to close by early 2025.
- October 2025: Trinseo has reduced the prices of its ABS and SAN grades by EUR 10 per ton. This price adjustment is likely to influence the styrene copolymer market by intensifying competition and potentially driving price adjustments across the supply chain.


Global Styrene Copolymers (ABS And SAN) Market Report Scope
Aerospace, Automotive, Building and Construction, Electrical and Electronics, Industrial and Machinery, Packaging are covered as segments by End User Industry. Africa, Asia-Pacific, Europe, Middle East, North America, South America are covered as segments by Region.| Acrylonitrile-Butadiene-Styrene (ABS) |
| Styrene-Acrylonitrile (SAN) |
| Aerospace |
| Automotive |
| Building and Construction |
| Electrical and Electronics |
| Industrial and Machinery |
| Packaging |
| Other End-User Industries |
| Asia-Pacific | China |
| Japan | |
| India | |
| South Korea | |
| Australia | |
| Malaysia | |
| Rest of Asia-Pacific | |
| North America | United States |
| Canada | |
| Mexico | |
| Europe | Germany |
| France | |
| Italy | |
| United Kingdom | |
| Russia | |
| Rest of Europe | |
| South America | Brazil |
| Argentina | |
| Rest of South America | |
| Middle East and Africa | Saudi Arabia |
| United Arab Emirates | |
| Nigeria | |
| South Africa | |
| Rest of Middle East and Africa |
| By Polymer Type | Acrylonitrile-Butadiene-Styrene (ABS) | |
| Styrene-Acrylonitrile (SAN) | ||
| By End-User Industry | Aerospace | |
| Automotive | ||
| Building and Construction | ||
| Electrical and Electronics | ||
| Industrial and Machinery | ||
| Packaging | ||
| Other End-User Industries | ||
| By Geography | Asia-Pacific | China |
| Japan | ||
| India | ||
| South Korea | ||
| Australia | ||
| Malaysia | ||
| Rest of Asia-Pacific | ||
| North America | United States | |
| Canada | ||
| Mexico | ||
| Europe | Germany | |
| France | ||
| Italy | ||
| United Kingdom | ||
| Russia | ||
| Rest of Europe | ||
| South America | Brazil | |
| Argentina | ||
| Rest of South America | ||
| Middle East and Africa | Saudi Arabia | |
| United Arab Emirates | ||
| Nigeria | ||
| South Africa | ||
| Rest of Middle East and Africa | ||


Market Definition
- End-user Industry - Building & Construction, Packaging, Automotive, Aerospace, Industrial Machinery, Electrical & Electronics, and Others are the end-user industries considered under the styrene copolymers market.
- Resin - Under the scope of the study, virgin styrene copolymer resins like acrylonitrile butadiene styrene and styrene acrylonitrile in the primary forms are considered.
| Keyword | Definition |
|---|---|
| Acetal | This is a rigid material that has a slippery surface. It can easily withstand wear and tear in abusive work environments. This polymer is used for building applications such as gears, bearings, valve components, etc. |
| Acrylic | This synthetic resin is a derivative of acrylic acid. It forms a smooth surface and is mainly used for various indoor applications. The material can also be used for outdoor applications with a special formulation. |
| Cast film | A cast film is made by depositing a layer of plastic onto a surface then solidifying and removing the film from that surface. The plastic layer can be in molten form, in a solution, or in dispersion. |
| Colorants & Pigments | Colorants & Pigments are additives used to change the color of the plastic. They can be a powder or a resin/color premix. |
| Composite material | A composite material is a material that is produced from two or more constituent materials. These constituent materials have dissimilar chemical or physical properties and are merged to create a material with properties unlike the individual elements. |
| Degree of Polymerization (DP) | The number of monomeric units in a macromolecule, polymer, or oligomer molecule is referred to as the degree of polymerization or DP. Plastics with useful physical properties often have DPs in the thousands. |
| Dispersion | To create a suspension or solution of material in another substance, fine, agglomerated solid particles of one substance are dispersed in a liquid or another substance to form a dispersion. |
| Fiberglass | Fiberglass-reinforced plastic is a material made up of glass fibers embedded in a resin matrix. These materials have high tensile and impact strength. Handrails and platforms are two examples of lightweight structural applications that use standard fiberglass. |
| Fiber-reinforced polymer (FRP) | Fiber-reinforced polymer is a composite material made of a polymer matrix reinforced with fibers. The fibers are usually glass, carbon, aramid, or basalt. |
| Flake | This is a dry, peeled-off piece, usually with an uneven surface, and is the base of cellulosic plastics. |
| Fluoropolymers | This is a fluorocarbon-based polymer with multiple carbon-fluorine bonds. It is characterized by high resistance to solvents, acids, and bases. These materials are tough yet easy to machine. Some of the popular fluoropolymers are PTFE, ETFE, PVDF, PVF, etc. |
| Kevlar | Kevlar is the commonly referred name for aramid fiber, which was initially a Dupont brand for aramid fiber. Any group of lightweight, heat-resistant, solid, synthetic, aromatic polyamide materials that are fashioned into fibers, filaments, or sheets is called aramid fiber. They are classified into Para-aramid and Meta-aramid. |
| Laminate | A structure or surface composed of sequential layers of material bonded under pressure and heat to build up to the desired shape and width. |
| Nylon | They are synthetic fiber-forming polyamides formed into yarns and monofilaments. These fibers possess excellent tensile strength, durability, and elasticity. They have high melting points and can resist chemicals and various liquids. |
| PET preform | A preform is an intermediate product that is subsequently blown into a polyethylene terephthalate (PET) bottle or a container. |
| Plastic compounding | Compounding consists of preparing plastic formulations by mixing and/or blending polymers and additives in a molten state to achieve the desired characteristics. These blends are automatically dosed with fixed setpoints usually through feeders/hoppers. |
| Plastic pellets | Plastic pellets, also known as pre-production pellets or nurdles, are the building blocks for nearly every product made of plastic. |
| Polymerization | It is a chemical reaction of several monomer molecules to form polymer chains that form stable covalent bonds. |
| Styrene Copolymers | A copolymer is a polymer derived from more than one species of monomer, and a styrene copolymer is a chain of polymers consisting of styrene and acrylate. |
| Thermoplastics | Thermoplastics are defined as polymers that become soft material when it is heated and becomes hard when it is cooled. Thermoplastics have wide-ranging properties and can be remolded and recycled without affecting their physical properties. |
| Virgin Plastic | It is a basic form of plastic that has never been used, processed, or developed. It may be considered more valuable than recycled or already used materials. |


Research Methodology
Mordor Intelligence follows a four-step methodology in all our reports.
- Step-1: Identify Key Variables: The quantifiable key variables (industry and extraneous) pertaining to the specific product segment and country are selected from a group of relevant variables & factors based on desk research & literature review; along with primary expert inputs. These variables are further confirmed through regression modeling (wherever required).
- Step-2: Build a Market Model: In order to build a robust forecasting methodology, the variables and factors identified in Step-1 are tested against available historical market numbers. Through an iterative process, the variables required for market forecast are set and the model is built on the basis of these variables.
- Step-3: Validate and Finalize: In this important step, all market numbers, variables and analyst calls are validated through an extensive network of primary research experts from the market studied. The respondents are selected across levels and functions to generate a holistic picture of the market studied.
- Step-4: Research Outputs: Syndicated Reports, Custom Consulting Assignments, Databases & Subscription Platforms


