
Market Overview
| Study Period | 2018 - 2031 |
|---|---|
| Forecast Data Period | 2026 - 2031 |
| Base Year Market Size (2025) | USD 7.78 Billion |
| Market Size (2026) | USD 8.11 Billion |
| Market Size (2031) | USD 10.01 Billion |
| Growth Rate (2026 - 2031) | 4.30 % |
| Market Concentration | Low |
Major Players *Disclaimer: Major Players sorted in no particular order Image © Mordor Intelligence. Reuse requires attribution under CC BY 4.0. | |
Sri Lanka Freight And Logistics Market Analysis by Mordor Intelligence
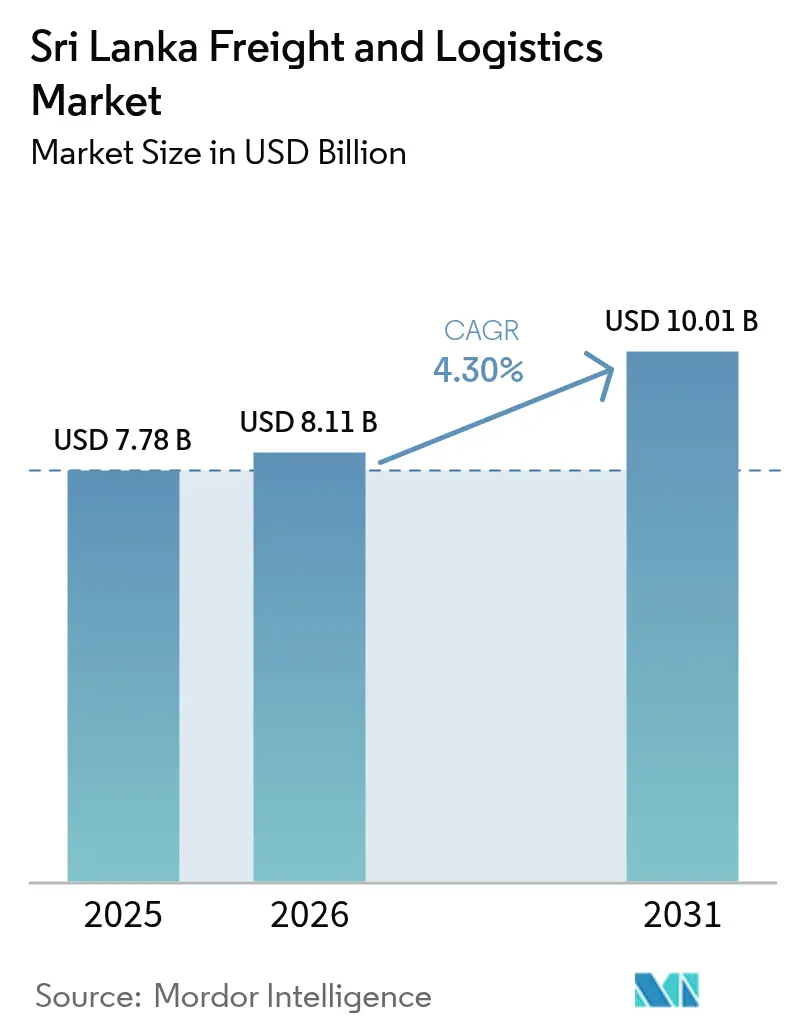
The Sri Lanka freight and logistics market size is expected to grow from USD 7.78 billion in 2025 to USD 8.11 billion in 2026 and is forecast to reach USD 10.01 billion by 2031 at 4.3% CAGR over 2026-2031. This trajectory underscores the pivotal role of the Sri Lanka freight and logistics market in the Indian Ocean’s maritime corridors as port expansions, integrated logistics parks, and end-to-end digital customs platforms raise operating efficiency and throughput. Modernization at Colombo and Hambantota, the move toward value-added warehousing, and a surge in cross-border e-commerce collectively reinforce revenue growth, while supportive trade agreements diversify shipment profiles and encourage new third-party logistics models. Strategically, operators that embrace data-driven route optimization, partner with integrated port-park clusters, and hedge against currency volatility are best positioned to capture incremental volumes and margin improvements.
Key Report Takeaways
- By logistics function, freight transport captured 64.12% of Sri Lanka's freight and logistics market share in 2025; courier, express, and parcel (CEP) services are forecast to expand at a 5.20% CAGR between 2026-2031.
- By end user industry, wholesale and retail trade led with a 33.52% of the Sri Lanka freight and logistics market size in 2025, while manufacturing records the highest projected CAGR at 4.96% between 2026-2031.
- By CEP type, domestic parcels accounted for 62.48% revenue share in 2025, whereas international parcels are expected to grow at a 5.35% CAGR between 2026-2031.
- By freight forwarding mode, sea and inland waterways retained 50.22% of the revenue share in 2025, yet air freight forwarding is projected to grow at a 4.37% CAGR between 2026-2031.
- By freight transport mode, road freight transport represented 66.96% of revenue share in 2025, while air freight transport is expected to grow at a CAGR of 4.90% between 2026-2031.
- By warehousing and storage, non-temperature controlled facilities commanded 91.54% of the revenue size in 2025 and temperature controlled is projected to grow at 4.12% CAGR between 2026-2031.
Note: Market size and forecast figures in this report are generated using Mordor Intelligence’s proprietary estimation framework, updated with the latest available data and insights as of 2026.
Sri Lanka Freight And Logistics Market Trends and Insights
Drivers Impact Analysis*
| Driver | (~) % Impact on CAGR Forecast | Geographic Relevance | Impact Timeline |
|---|---|---|---|
| Expansion of regional transshipment and hub port status boosts connectivity | +1.1% | Colombo and Hambantota | Medium term (2–4 years) |
| Growing investment in integrated logistics parks and inland container depots (ICDs) | +0.9% | Western Province and urban centers | Long term (≥ 4 years) |
| Rising international trade flows driving market demand | +1.0% | Major port cities and corridors | Short term (≤ 2 years) |
| Colombo Port City SEZ incentives attract strategic business investments | +0.7% | Western Province | Medium term (2–4 years) |
| Accelerated adoption of digital customs through ASYCUDA World | +0.6% | Nationwide | Short term (≤ 2 years) |
| Development of Palaly Airport multimodal transshipment corridor enhances connectivity | +0.5% | Northern Province | Long term (≥ 4 years) |
| Source: Mordor Intelligence | |||
Expansion of Regional Transshipment and Hub Port Status Boosts Connectivity
Sri Lanka’s central location on East-West trade lanes positions the Sri Lanka freight and logistics market to absorb cargo diverted from congested regional hubs. The development of the Eastern Container Terminal and the USD 800 million Colombo West International Terminal adds 3.6 million TEU of annual capacity, enabling carriers to deploy larger vessels and cut turnaround times[1]“Eastern Container Terminal Development,” Sri Lanka Ports Authority, slpa.lk. Competitive feeder tariffs and synchronized hinterland connections bolster throughput, although maintaining low service charges remains essential vis-a-vis Singapore and Dubai. Hambantota complements Colombo by providing deep-draft alternatives for energy cargoes and vehicle transshipments, thereby broadening route flexibility and lowering congestion risk during peak seasons.
Growing Investment in Integrated Logistics Parks and Inland Container Depots (ICDs)
Integrated logistics parks that blend bonded warehousing, customs, distribution, and light processing are shifting revenue pools away from pure port handling toward bundled supply-chain solutions. Initiatives in Horana and Muthurajawela connect directly to expressways and rail spurs, reducing container dwell times and easing Colombo gate congestion. Operators exploit shared infrastructure, ro-ro ramps, value-added packaging lines, and 24/7 customs outposts to improve asset utilization and service differentiation. The chief hurdle remains high upfront capital outlays; nevertheless, PPP structures with 30-year concessions are unlocking foreign direct investment and stabilizing tariff trajectories for tenants.
Rising International Trade Flows Driving Market Demand
Total merchandise trade rebounded to USD 30.6 billion in 2024, lifting freight forwarding, customs brokerage, and multimodal demand. The Sri Lanka-Thailand Free Trade Agreement eliminates duties on 80% of tariff lines, catalyzing containerized flows of electronics, automotive parts, and processed foods[2]“Sri Lanka–Thailand FTA,” Ministry of Trade, trade.gov.lk. E-commerce marketplaces deepen parcel density, compelling CEP networks to deploy zonal sort centers and dynamic line-haul routing. To capitalize, forwarders digitalize booking and visibility platforms, which mitigates documentation errors and accelerates invoice cycles. The upside potential rests on synchronized capacity additions across roads, ICDs, and cold chain nodes to match rising TEU and parcel volumes.
Colombo Port City SEZ Incentives Attract Strategic Business Investments
Tax holidays, duty-free equipment imports, and single-window approvals inside the Port City SEZ attract regional head offices and value-added distribution centers. Logistics firms benefit from co-located grade-A warehouses linked to automated quay cranes and expressway exits, cutting total landed costs and enabling cross-docking within four hours of vessel discharge. Execution risks include shifting regulatory directives and the need for harmonized policy between onshore and SEZ jurisdictions to avoid duplicate compliance steps.
Restraints Impact Analysis*
| Restraint | (~) % Impact on CAGR Forecast | Geographic Relevance | Impact Timeline |
|---|---|---|---|
| High port and logistics service charges continue to challenge competitiveness | −1.0% | Colombo and major ports | Short term (≤ 2 years) |
| Currency depreciation and rising import costs impact margins | −0.8% | Nationwide | Short term (≤ 2 years) |
| Forex shortages hamper fleet maintenance and operations | −0.7% | Nationwide | Medium term (2–4 years) |
| Policy volatility creates uncertainty in terminal privatization | −0.6% | Major port facilities | Medium term (2–4 years) |
| Source: Mordor Intelligence | |||
High Port and Logistics Service Charges Continue to Challenge Competitiveness
Elevated terminal handling, storage, and ancillary tariffs erode cost competitiveness and divert relay cargo toward cheaper hubs. While new automation lowers per-box operating costs, recoveries are frequently passed to users through higher published tariffs, negating efficiency gains. Currency depreciation aggravates the issue because most fees are dollar-denominated. Without a calibrated tariff regime, volume growth may stall despite capacity expansions.
Currency Depreciation and Rising Import Costs Impact Margins
A weakening rupee inflates local currency prices for imported trucks, yard equipment, and fuel, compressing margins across the Sri Lanka freight and logistics industry. Smaller fleets that rely on short-term overdrafts confront a liquidity shock as debt service on USD loans escalates[3]“Exchange-Rate Policy 2024,” Central Bank of Sri Lanka, cbsl.gov.lk. Hedging options remain limited, prompting operators to prioritize preventive maintenance, retrofit older assets, and optimize route assignment to conserve cash.
*Our forecasts treat driver/restraint impacts as directional, not additive. The impact forecasts reflect baseline growth, mix effects, and variable interactions.
Segment Analysis
By End User Industry: Manufacturing Accelerates Trade Diversification
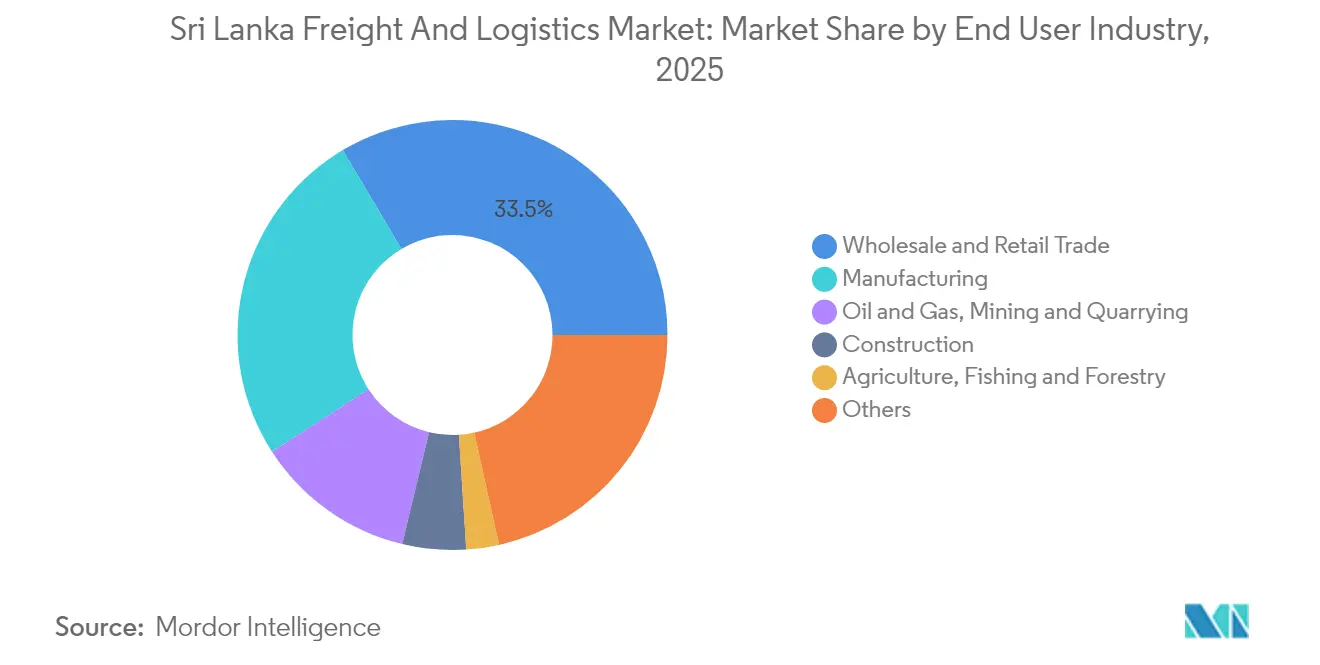
Wholesale and retail trade captured 33.52% of the Sri Lanka freight and logistics market share during 2025; whereas the manufacturing industry is forecast to progress at a 4.96% CAGR (2026-2031), supported by export-processing zones, electronics assembly, and apparel value-addition. This pace outstrips wholesale and retail trade, which, although still the largest, advances more modestly on maturing urban consumption. Oil & gas, mining, and quarrying are anchored in petroleum imports and mineral exports that require specialized handling. Construction activity hinges on port and highway projects that simultaneously raise logistics demand and improve network reach. Agriculture, fishing, and forestry contributed the least, with cold-chain uptake expanding on seafood exports. Collectively, these dynamics diversify revenue streams within the Sri Lanka freight and logistics market and limit overreliance on any single end-use cluster.
Further momentum arises from FDI-funded industrial parks that leverage tariff-free inputs under new FTAs. Multinational OEMs appoint local 3PLs for inbound raw-material consolidation, stitched apparel returns, and regional parts distribution, broadening contract durations. Service providers integrate quality inspection, JIT inventory feeds, and bonded consolidation into single invoices, expanding wallet share. E-commerce is also reshaping wholesale distribution, as omnichannel retailers outsource fulfillment and returns management, boosting nationwide LTL and last-mile volumes. Consequently, higher manufacturing activity multiplies cross-dock moves, pallet rentals and temperature-controlled transfers, underpinning resilient capex in warehouses and fleet renewals.



By Logistics Function: Freight Transport Dominates Traditional Corridors
The freight transport segment commands 64.12% of the revenue share in 2025 because transshipment volumes flow chiefly through trucking haulage, feeder shipping, and barge moves. Concurrently, courier, express, and parcel (CEP) is expected to grow at a 5.20% CAGR during 2026-2031, supported by digital retail momentum and SME exports. Freight forwarding sustains relevance by navigating complex rules-of-origin matrices and multi-port itineraries.
Stakeholders redouble focus on service bundling: transport providers add customs desks, while forwarders lease buffer warehouses, morphing into lead-logistics players. Warehouse capacity constraints spur mezzanine retrofits, automated vertical lifts, and satellite cross-docks to extend service footprints nearer consumption nodes. Integrated contracts that guarantee door-to-door lead times lure manufacturers seeking single-invoice solutions. As a result, the lines between traditional freight transport, forwarding, and value-added services blur, fostering scale advantages for omnichannel operators.
By Courier, Express, and Parcel (CEP): International Growth Accelerates
Domestic CEP accounted for 62.48% of revenue share in 2025, thanks to dense Colombo–Kandy–Galle urban triangles and same-day delivery pledges by marketplace platforms. International CEP, however, is expected to grow faster at a 5.35% CAGR (2026-2031) as Lankan consumers tap overseas sellers and cottage exporters fulfill micro-orders to diaspora markets. Firms deploy bonded bulk clearances where multiple low-value parcels ride a single airway bill, reducing per-unit brokerage fees.
Regulatory clarity around de minimis thresholds and digital customs fosters strides in cross-border flows. Service providers introduce pre-paid duty options and mobile tracking in Sinhala and Tamil, raising customer adoption. Yet the new 2025 VAT on selected e-commerce categories forces carriers to enhance classification accuracy. Those mastering automated HS-code allocation and API-based duty payments gain market share as parcel counts rise.
By Warehousing and Storage: Temperature Controlled Expansion Accelerates
Non-temperature space dominates at 91.54% of revenue share in 2025, but cold-chain demand jumps as vaccine imports, dairy processing, and seafood exports require sub-8°C integrity, with a projected CAGR of 4.12% between 2026-2031. Developers build multi-compartment chambers with 24-hour diesel back-up and humidity monitoring, yet capital intensity and energy tariffs challenge ROI. Joint ventures with multinationals supply operational know-how, while government duty waivers on reefer panels spur uptake.
Operators market pay-per-use pallet slots and GMP-compliant packing rooms, enticing SMEs locked out of build-to-suit leases. Value-added kitting, labeling, and blast-freezing supplement storage fees. Real-time temperature logs accessed via cloud platforms boost compliance with EU and FDA standards, enhancing export competitiveness for processed seafood.
By Freight Transport Mode of Transport: Maritime Infrastructure Drives Volumes
Road freight transport captured 66.96% revenue share in 2025 and remains essential for last-mile coverage despite higher cost per ton-km; efficiencies are sought via telematics and graduated toll rebates for Euro 6 trucks. Air freight transport, moving significant freight volume and expected to grow at a CAGR of 4.90% between 2026-2031, sustains premium yields, catalyzing freighter up-gauges at Bandaranaike International Airport and regional charters for live seafood. Axle-load limits and circuitous routes restrain rail freight’s contribution; modernization projects plan heavier sleepers and container wagons to shift clinker and grain inland. Pipelines ferry tons of petroleum, offering cost stability and bypassing road congestion. Collectively, modal integration remains a priority: synchronized port gate booking for trucks, scheduled rail shuttles to ICDs, and dredged barge channels along the Kelani River promise throughput gains.

By Freight Forwarding: Sea and Inland Waterways Routes Maintain Dominance
Sea and inland waterways freight forwarding retained a 50.22% revenue share in 2025 due to cost efficiency for garments, tea, and rubber exports. Air freight forwarding, though smaller, registers a 4.37% CAGR (2026-2031) fueled by pharma consignments, electronics spares, and high-value perishables requiring sub-48-hour transit. Hybrid “sea-air” offerings via Dubai and Kuala Lumpur optimize cost-to-speed ratios, and forwarders bundle LCL consolidations at Colombo ICDs to fill freighters ex-Dubai. Road and rail forwarding remains constrained by island geography but stands to gain once roll-on, roll-off links with South India materialize. Digitally enabled freight marketplaces match cargo with empty truck legs, lifting backhaul utilization. Forwarders that deploy real-time visibility dashboards and predictive ETA alerts, once reserved for integrators, differentiate services and add extended liability coverage.
Geography Analysis
Western Province dominates throughput, driven by Colombo Port, the expressway grid, and 67% of GDP-linked consumption. Surging TEUs there highlight the centrality of the Sri Lanka freight and logistics market to global East-West lanes. However, congestion and land scarcity elevate land prices, propelling investors to satellite ICDs in Pannala and Horana. Southern Province gains from Hambantota’s deep draft and automotive transshipments that bypass Colombo’s peaks, yet hinterland rail links lag. The Eastern Province sees uplift as the USD 61.5 million refurbishment of Kankesanthurai Port links with Indian coastal services, broadening connectivity to Chennai markets.
Southern Province benefits from Hambantota Port’s deep draft, which now attracts roll-on roll-off car carriers and bulk energy cargo that bypass Colombo during peak congestion. Despite the capacity, limited rail and highway links into the hinterland keep utilization below 50% of the designed throughput, constraining the Sri Lanka freight and logistics market size captured by the region. In the north, India’s USD 61.5 million refurbishment of Kankesanthurai Port and the planned Palaly air-sea corridor promise direct connectivity to Tamil Nadu that can shorten lead times for seafood exporters. Eastern Province remains export-oriented in tea and minerals but faces seasonal cyclone disruptions that inflate trucking insurance premiums each fourth quarter.
Northern Province, historically peripheral, will gain fresh impetus once the Palaly air-sea-road corridor matures, reducing Colombo dependency for perishable seafood exports. Central Province’s mountainous topography inflates diesel consumption and axle wear, narrowing payload economics; yet expressway extensions are slated to improve gradients and cut travel time. Monsoonal flooding in Eastern and Southern lowlands remains a seasonal risk, compelling forwarders to pre-position stock in elevated ICDs. Across the island, ASYCUDA’s uniform deployment reduces regional disparities by enabling electronic submission from any province, although telecom connectivity gaps persist in remote districts.
Regulatory Landscape
Sri Lanka's freight and logistics activity is shaped by national policies covering tariffs, land transport, and trade facilitation, alongside sector oversight by entities such as the Sri Lanka Ports Authority (SLPA) for ports and the Civil Aviation Authority of Sri Lanka (CAASL) for aviation. The National Tariff Policy (2024) provides a framework intended to reduce trade frictions, while the National Land Transport Policy (2025) sets a basis for managing fee-charging freight and passenger land transport services. Together, these frameworks influence operator compliance, service authorization, and the direction of transport-system modernization.
In 2026, the policy and institutional focus broadened from throughput expansion toward integrated logistics enablement. The Sri Lanka Export Development Board (EDB) launched the National Export Development Plan (NEDP) 2026-2030, which positions trade logistics and integrated hub operations as cross-sector enablers and reinforces initiatives around digital customs and risk-based controls. On infrastructure and facilitation, SLPA's ADB-funded Maritime Facilitation Centre in Colombo moved toward completion during 2026 to support streamlined port processes. Government-level reviews and budget discussions in 2026 also highlighted port and airport expansion programs, including logistics-park concepts linked to Colombo.
Value Chain Analysis
The Sri Lanka freight and logistics value chain starts with cargo generation from wholesale and retail trade, manufacturing, agriculture, and energy-related imports, followed by first-mile collection primarily via road freight. International gateways anchor the midstream, led by the Port of Colombo and complementary capacity at Hambantota, with airport cargo handling at Bandaranaike International Airport supporting time-sensitive flows. The core operating layer includes state and private port and terminal operators (SLPA and private terminals such as SAGT, CICT, and CWIT), shipping lines and agents, freight forwarders and customs brokers, and 3PL/4PL providers that combine transport management with warehousing, distribution, and value-added services.
Downstream, cargo moves through ICDs, container freight stations, and bonded and non-bonded warehouses to domestic distribution and export consolidation, with growing emphasis on integrated port-park models and digitized documentation. Recent capacity actions reinforce the chain: SLPA commissioned the third berth at the East Container Terminal in January 2026 to strengthen transshipment handling, CWIT added electric cantilever RMG cranes for Phase 2 in June 2026, and Hambantota International Port Group agreed in March 2026 to invest USD 108 million in container-handling equipment with the aim of scaling to 2 million TEU annual capacity. Landside coordination remains a key friction point, especially inter-terminal trucking within Colombo despite berth and crane additions. This raises the premium on control-tower planning, ITT/ITV services, and shared yard and gate-slot orchestration across terminals and ICD links.
Competitive Landscape
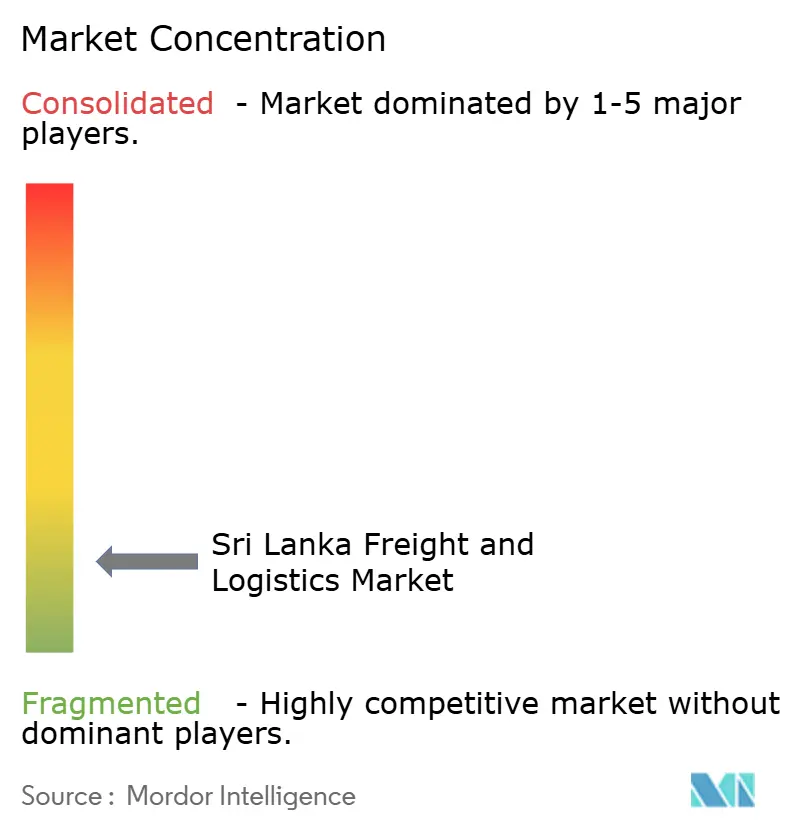
The market is fragmented; however, global consolidation reshapes competitive dynamics as DSV completes the EUR 14.3 billion (USD 15.8 billion) DB Schenker acquisition, forging the world’s largest 3PL with an enhanced Asia-Pacific footprint. Scale economies grant rate leverage on main-lane carriers and IT budget for predictive analytics out of reach for smaller incumbents. Domestic stalwarts, John Keells Logistics, Hayleys Advantis, and Expolanka Freight, retain customer loyalty through localized problem-solving and bonded trucking fleets that navigate provincial nuances.
Differentiation hinges on technology: South Asia Gateway Terminals’ integration with TradeLens blockchain slashes document processing, while Maersk’s new 100,000 ft² Wattala warehouse offers digital twin visibility. Temperature-controlled logistics and last-mile e-commerce delivery are coveted white spaces; players that secure land near expressway ramps and deploy electric vans position themselves for premium margins. Nevertheless, high port costs compress profitability, forcing alliances and slot-chartering agreements to share capacity risk.
Policy unpredictability on terminal privatization injects caution into long-horizon investments. Operators hedge by leasing rather than owning yard gear and advocating for fixed concession terms. Talent retention emerges as a differentiator; firms institute graduate trainee programs and data science labs to nurture supply-chain specialists, keeping attrition below regional averages.
Sri Lanka Freight And Logistics Industry Leaders
Hayleys Advantis, Ltd.
John Keells Logistics (Pvt), Ltd.
Aitken Spence Group (Including Ace Express International Pvt., Ltd.)
DHL Group
A.P. Moller - Maersk
- *Disclaimer: Major Players sorted in no particular order

Market Opportunities and Future Outlook
Opportunities cluster where policy-backed export ambitions and port modernization translate into demand for integrated services beyond basic forwarding and trucking. The National Export Development Plan (NEDP) 2026-2030 explicitly identifies trade logistics and integrated hub operations as a cross-sector enabler. This creates whitespace for providers to bundle export consolidation, bonded warehousing, compliance management, and digital documentation into single contracts for manufacturers and SME exporters. On the maritime side, incremental quay and yard capability supports value-added transshipment-adjacent services such as stuffing/unstuffing, LCL consolidation, postponement, and re-export processing, with particular relevance around Colombo as SLPA discusses an in-port logistics hub within its near-term investment pipeline.
A second opportunity area is capex-led productivity and sustainability upgrades financed through PPPs and international lenders, which shifts the competitive requirements for equipment, IT integration, and specialized operations. In 2026, IFC and HSBC finalized financing of up to USD 40 million for South Asia Gateway Terminals (SAGT) to modernize the Port of Colombo with advanced twin-lift ship-to-shore cranes. Hambantota's USD 108 million equipment program and CWIT Phase 2 crane additions also increase pressure for efficient landside evacuation, inter-terminal transfers, and higher-quality depot and warehouse networks. As terminals scale handling capability, operators able to provide synchronized port-to-ICD flows (including ITT/ITV moves), cold-chain compliant export consolidation, and project logistics for industrial and energy projects have clearer routes to differentiated margins than commodity spot transport alone.
Recent Industry Developments
- March 2026: John Keells Logistics expanded its engagement with Colombo West International Terminal (CWIT) by initiating inter-terminal transport services within the Port of Colombo after implementing inter-terminal vehicle operations. The engagement deepens integration with terminal-side workflows and supports faster container repositioning across port nodes, tightening service control for time-sensitive customers.
- February 2026: Hayleys Advantis formed a strategic joint venture with Sarens Heavy Lift India Pvt Ltd to provide heavy-lift cranes and engineered transport solutions in Sri Lanka, including support for wind-energy project cargo in Mannar. This strengthens domestic capability in high-value project logistics, which depends on specialized assets, permitting discipline, and end-to-end execution reliability.
- February 2025: Aitken Spence Logistics invested in electric forklifts and electric-powered pallet trucks for its 100,000 sq. ft. container freight station to upgrade material-handling operations. The change improves warehouse productivity while aligning customer requirements around lower-emission operations and modernized contract logistics service levels.


Research Methodology Framework and Report Scope
Market Definition and Coverage
For this methodology, the market covers revenue generated from moving goods within Sri Lanka and across borders, plus logistics services that support those flows such as storage, forwarding, and value-added handling.
Scope exclusions: Passenger mobility services and pure infrastructure construction revenues are excluded even when they relate to roads, ports, airports, or terminals.
Segmentation Overview
- End User Industry
- Agriculture, Fishing, and Forestry
- Construction
- Manufacturing
- Oil and Gas, Mining and Quarrying
- Wholesale and Retail Trade
- Others
- Logistics Function
- Courier, Express, and Parcel (CEP)
- By Destination Type
- Domestic
- International
- By Destination Type
- Freight Forwarding
- By Mode of Transport
- Air
- Sea and Inland Waterways
- Others
- By Mode of Transport
- Freight Transport
- By Mode of Transport
- Air
- Pipelines
- Rail
- Road
- Sea and Inland Waterways
- By Mode of Transport
- Warehousing and Storage
- By Temperature Control
- Non-Temperature Controlled
- Temperature Controlled
- By Temperature Control
- Other Services
- Courier, Express, and Parcel (CEP)
Data Sources, Market Sizing, and Validation
Desk Research
Desk research starts with public facts that explain how much freight is likely to move through Sri Lanka and what costs tend to do over time. We referenced sources such as Sri Lanka Customs trade statistics, Central Bank of Sri Lanka macro series, the Sri Lanka Ports Authority and port operator statistics, and the Civil Aviation Authority or airport operator cargo disclosures to sense air freight volumes.
To keep assumptions realistic, we also used company annual reports and investor presentations, reputable press coverage of port and logistics park projects, and selected shipping and freight rate databases for directional pricing and route pressure checks. Patent and standards databases were used lightly to spot where handling and tracking upgrades were being adopted. These examples are not exhaustive, and we also checked other public sources to compile inputs, validate numbers, and clarify definitions.
Primary Interviews and Surveys
We conduct interviews and surveys with Sri Lankan logistics providers, shippers, freight handlers, warehouse operators, and transport managers. Responses test secondary data, fill gaps on rates, utilization, lane activity, and outsourcing, and help triangulate assumptions and final results.
Distribution of primary research fieldwork respondents
| Company type | Respondent position |
|---|---|
| Top tier: 30% | CXOs: 15% |
| Mid tier: 45% | Functional/Unit leaders: 35% |
| Smaller Players: 25% | Managers: 50% |
Market-Sizing & Forecasting
Sizing starts from a top-down build where trade values, port and airport cargo throughput, and domestic distribution demand are reconstructed into a freight activity pool, which is then allocated into logistics services using service mix ratios from interviews. The totals are subsequently corroborated with selective bottom-up approximations, such as sampled pricing per shipment or per ton, warehouse capacity and occupancy checks, and channel checks with forwarders to adjust outliers.
A few inputs that mattered most in this market include import and export momentum by major commodity groups, container and general cargo throughput trends at the main ports, air cargo volumes tied to higher value shipments, road freight intensity linked to wholesale and retail trade, and service pricing indicators such as fuel cost movement and freight rate direction. Where bottom-up views were incomplete, gaps were handled by using conservative penetration ranges and then validating them through re-contacts until the implied revenue per ton or per shipment looked consistent.
For forecasting, scenario analysis was used so the outlook can reflect different trade recovery paths, infrastructure utilization, and cost conditions. The final forecast path was aligned to expert views on near-term demand, pricing pass-through ability, and service mix shifts toward managed logistics and value-added handling.
Data Validation & Update Cycle
Model outputs are checked against independent signals, including whether implied revenue per ton aligns with observed price levels and whether growth rates reconcile with trade and throughput direction. When a segment shows unusual jumps, inputs are reviewed step by step, and respondents are re-contacted to confirm whether the change is real or driven by a data definition issue.
Before sign-off, another analyst reviews the assumptions, calculations, and year-to-year bridges to catch inconsistencies. Reports are refreshed annually, and interim updates are made when material events occur, such as major policy shifts, port capacity changes, or sharp fuel and freight rate moves. Right before delivery, we do a final pass so clients receive the latest updated view.
Mordor Intelligence's Sri Lanka Freight and Logistics Market Size Compared With Other Published Estimates
Published market sizes for Sri Lanka freight and logistics can differ widely because each publisher draws the line differently on what qualifies as logistics revenue, and because currency timing and price assumptions can shift totals quickly. In practice, the biggest gaps usually come from whether a source counts full transport sector activity or only third-party logistics services sold to shippers.
Informal trucking and captive in-house logistics performed by manufacturers and retailers sit outside Mordor Intelligence's scope, which explains why some broader transport sector figures can look higher even when freight volumes are similar.
Benchmark comparison
| Source | Market Size | Gaps in Research Methodology |
|---|---|---|
| Mordor Intelligence | USD 7.78 B (2025) | |
| Logistics Cluster Portal A | USD 4.40 B (2023) | Uses an earlier year and appears closer to a narrower freight and logistics value view, with limited detail on service coverage and how pricing and inflation effects are treated across modes. |
| Investment Promotion Portal B | USD 7.78 B (2025) | Repeats a headline market value but provides limited transparency on service split, inclusion of value-added services, and the validation steps used to reconcile trade, throughput, and domestic distribution activity. |
Overall, the spread is mainly explained by year selection, what parts of the logistics value chain are counted, and how service pricing is carried into the model. When scope and drivers are stated clearly, the market total becomes easier to reproduce and easier to use for planning across transport, warehousing, and forwarding activity.


Key Questions Answered in the Report
What is the value of the Sri Lanka freight and logistics market in 2026?
The market is valued at USD 8.11 billion in 2026.
How fast is the market expected to grow through 2031?
It is forecast to expand at a 4.30% CAGR (2026-2031), reaching USD 10.01 billion by 2031.
Which logistics function is expanding the quickest?
Courier, express and parcel services show the fastest expected growth at a 5.20% CAGR between 2026 and 2031.
Why are integrated logistics parks important?
They decongest ports, bundle warehousing with customs and distribution, and cut total logistics costs.
What role does ASYCUDA World play in trade facilitation?
The platform processes 95% of customs declarations electronically, reducing clearance to under six hours.
How will the DSV–DB Schenker merger impact Sri Lanka operators?
The enlarged entity gains scale and IT capabilities, intensifying competition for complex multimodal contracts.
Page last updated on:




