Market Overview
| Study Period | 2021 - 2031 |
|---|---|
| Forecast Data Period | 2026 - 2031 |
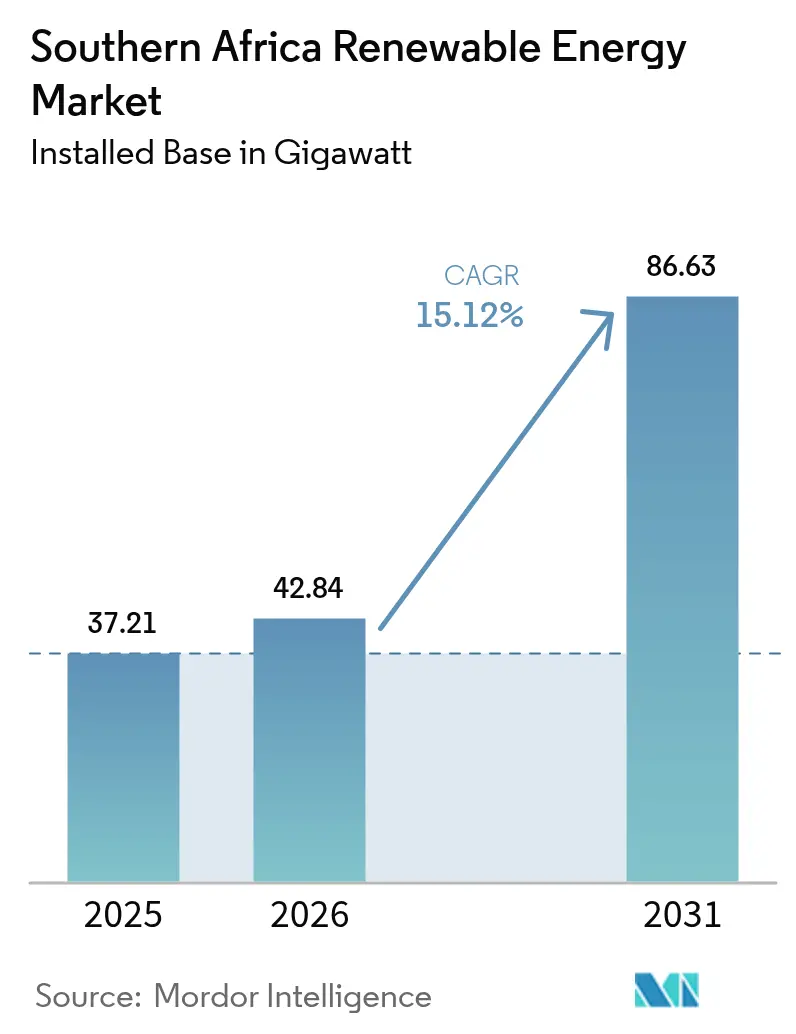
| Base Year Market Size (2025) | 37.21 gigawatt |
| Market Volume (2026) | 42.84 gigawatt |
| Market Volume (2031) | 86.63 gigawatt |
| Growth Rate (2026 - 2031) | 15.12% CAGR |
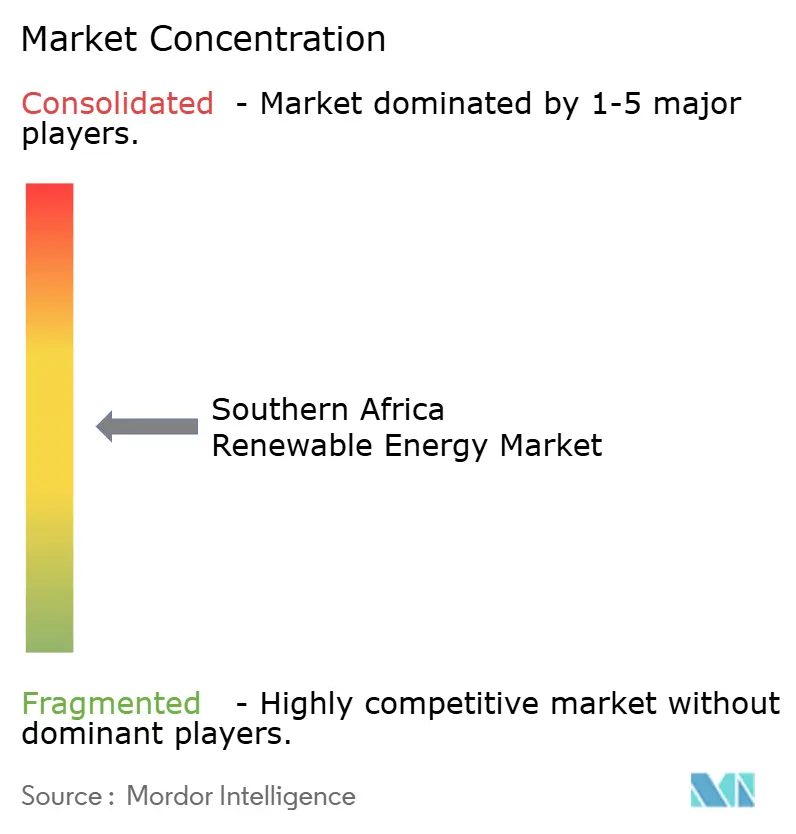
| Market Concentration | Medium |
Major Players *Disclaimer: Major Players sorted in no particular order Image © Mordor Intelligence. Reuse requires attribution under CC BY 4.0. | |
Southern Africa Renewable Energy Market Analysis by Mordor Intelligence
The Southern Africa Renewable Energy Market size was valued at 37.21 gigawatt in 2025 and estimated to grow from 42.84 gigawatt in 2026 to reach 86.63 gigawatt by 2031, at a CAGR of 15.12% during the forecast period (2026-2031).
Falling levelized costs for solar photovoltaic and onshore wind, combined with Eskom’s 36% tariff increase for 2025/26, are making self-generation projects economically viable for mines, manufacturers, and commercial property owners. The Electricity Regulation Amendment Act, signed in August 2024, unbundled Eskom’s transmission arm and authorized third-party wheeling, opening the grid to competitive procurement.[1]Republic of South Africa Government Gazette, “Electricity Regulation Amendment Act,” gov.za Bid Window 7 of the Renewable Energy Independent Power Producer Procurement Program (REIPPPP) awarded 1,760 MW of utility-scale solar at a record ZAR 0.47 per kWh, while Battery Energy Storage IPP Procurement Program (BESIPPPP) Bid Window 2 allocated 615 MW of four-hour systems to firm evening peaks. Angola, Zambia, and the Democratic Republic of Congo are scaling hydropower, and Namibia’s USD 10 billion Hyphen green-hydrogen project is catalyzing a second wave of gigawatt-scale renewables.
Key Report Takeaways
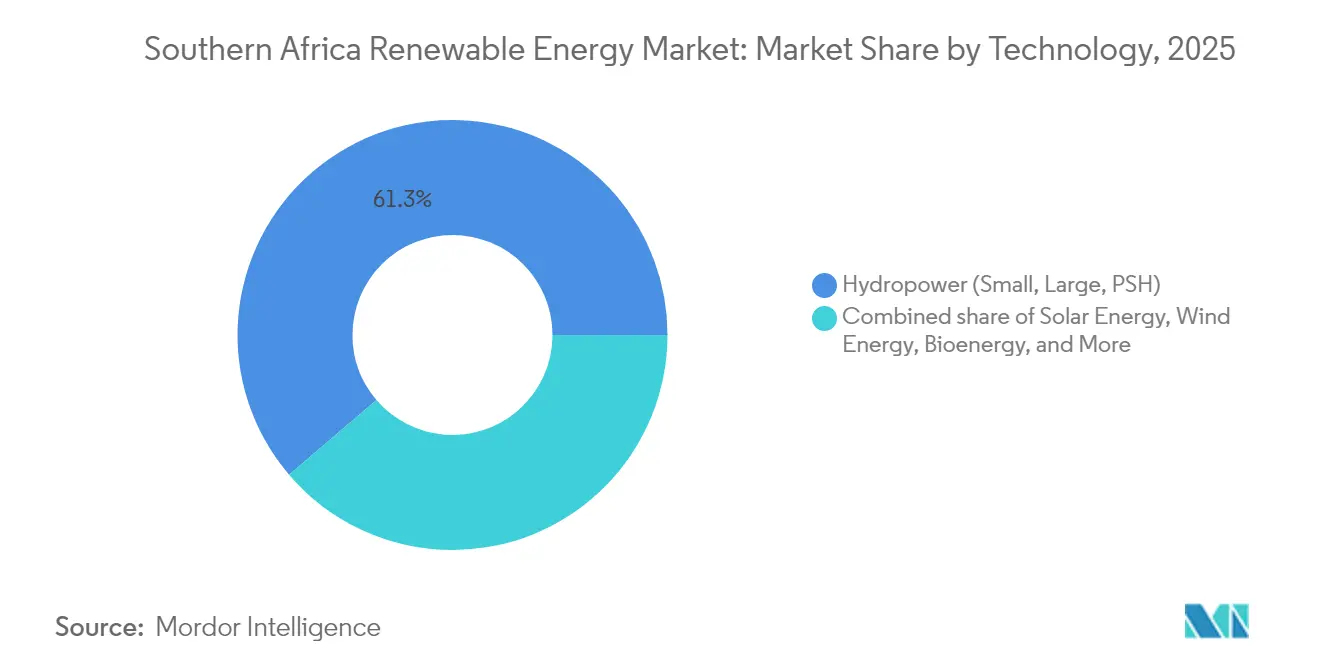
- By technology, hydropower held 61.25% of the Southern Africa renewable energy market share in 2025, whereas wind is forecast to record a 24.35% CAGR to 2031
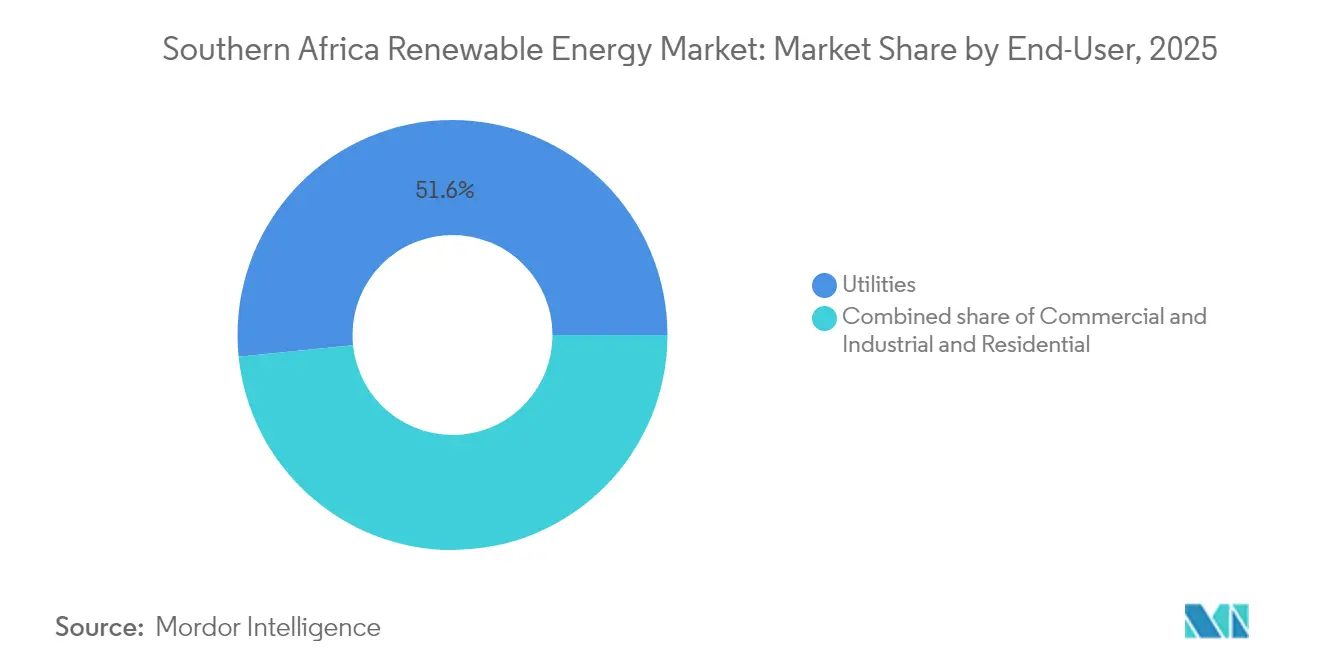
- By end-user, utilities commanded 51.62% of deployment in 2025; commercial and industrial installations are projected to expand at a 20.15% CAGR through 2031
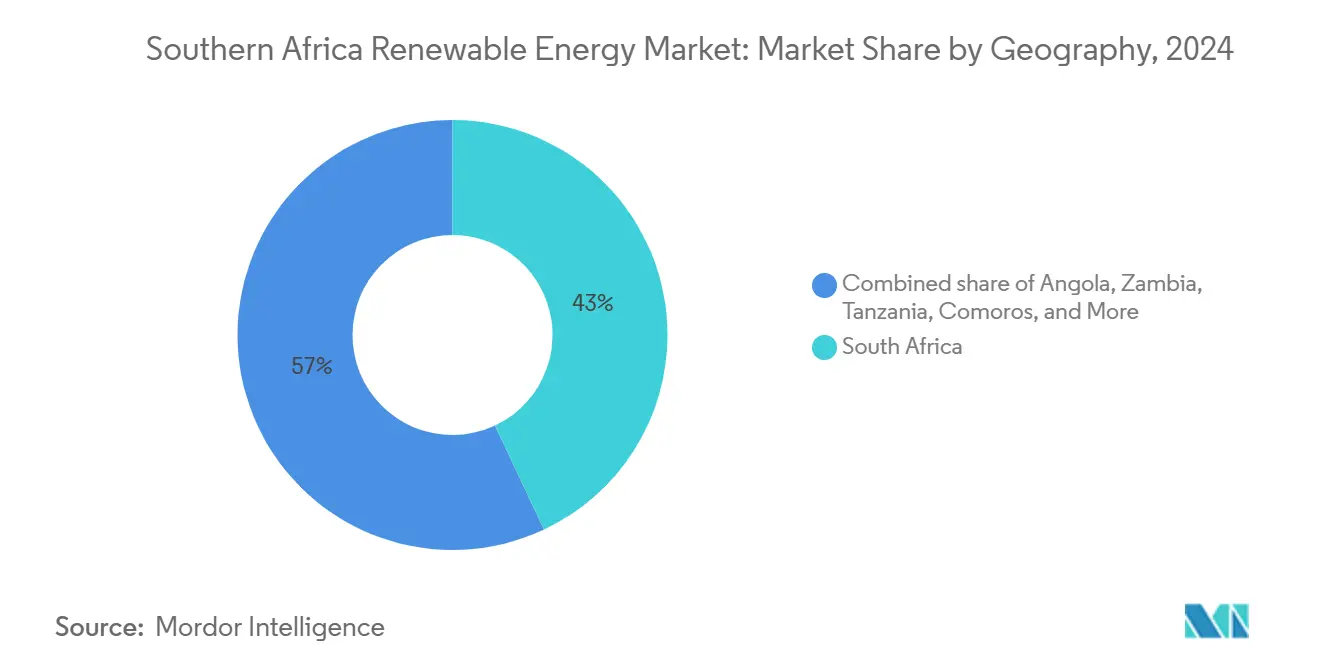
- By geography, South Africa captured 42.35% of capacity in 2025, while Comoros is expected to post a 51.02% CAGR during 2026-2031.
Note: Market size and forecast figures in this report are generated using Mordor Intelligence’s proprietary estimation framework, updated with the latest available data and insights as of 2026.
Southern Africa Renewable Energy Market Trends and Insights
Drivers Impact Analysis*
| Driver | (~) % Impact on CAGR Forecast | Geographic Relevance | Impact Timeline |
|---|---|---|---|
| Declining LCOE for solar & wind | +3.2% | South Africa, Namibia, Botswana | Medium term (2-4 years) |
| Escalating Eskom tariffs & load-shedding risk | +4.1% | South Africa, regional SAPP members | Short term (≤ 2 years) |
| REIPPPP & new Renewable Energy Masterplan (SAREM) | +2.8% | South Africa | Medium term (2-4 years) |
| Surge in corporate PPAs & wheeling frameworks | +2.6% | South Africa, Zimbabwe, Zambia | Short term (≤ 2 years) |
| Green-hydrogen export corridors (Namibia, SA Northern Cape) | +1.9% | Namibia, South Africa (Northern Cape) | Long term (≥ 4 years) |
| Monetisation of carbon markets & EU-CBAM avoidance | +1.7% | South Africa, Mozambique (aluminum exports) | Medium term (2-4 years) |
| Source: Mordor Intelligence | |||
Declining LCOE for Solar & Wind
Module oversupply from Asian manufacturers lowered utility-scale solar tariffs below USD 0.03 per kWh in the Northern Cape by late 2024, well under Eskom’s average generation cost of ZAR 1.48 per kWh.[2]The Department of Trade, Industry and Competition, “Local Content Policy,” thedtic.gov.za JinkoSolar and First Solar supplied Bid Window 7 projects at prices 22% below 2022 benchmarks, enabling sub-ZAR 0.50 per kWh twenty-year power purchase agreements. Onshore wind LCOE in the Eastern Cape approached USD 0.04 per kWh, yet logistics bottlenecks and grid delays left wind bids 18% costlier than solar, resulting in zero wind allocations in Bid Window 7. Namibia’s Hyphen project secured a blended renewables tariff of USD 0.025 per kWh for its 7 GW portfolio, establishing a regional floor and signaling future price compression. Coupling four-hour batteries with solar now provides dispatchable capacity at roughly USD 0.06 per kWh, eroding the economics of coal peakers and supporting Eskom’s just-transition schedule.
Escalating Eskom Tariffs & Load-Shedding Risk
NERSA’s 36% tariff hike raises the average industrial power cost above ZAR 2.20 per kWh in 2025/26, reducing the payback period for rooftop solar arrays larger than 500 kW to below four years.[3]National Energy Regulator of South Africa, “NERSA Approves Eskom Tariff Increase,” nersa.org.za Stage 6 load-shedding persisted for 78 days in 2024, prompting mining majors to contract more than 200 MW of captive solar-plus-storage systems. The Electricity Regulation Amendment Act allows private transmission investment and wheeling, enabling corporate buyers in Gauteng to source Northern Cape renewables without Eskom as an intermediary. This reform is expected to reduce Eskom’s generation share below 60% by 2030, transitioning the utility toward a pure transmission-system-operator role. Multilateral lenders are linking concessional finance to accelerated grid upgrades, tying future disbursements to measurable reductions in unserved energy.
REIPPPP & South African Renewable Energy Masterplan
Bid Window 7 attracted ZAR 31.4 billion in solar investment and achieved a 12% tariff reduction compared to the previous round. The 2024 master plan targets 20 GW of new renewables by 2030; however, transmission planning lags behind procurement by up to two years, resulting in 1.2 GW of capacity being stranded in the Northern Cape. BESIPPPP Bid Window 2 added 615 MW of storage with a mandatory four-hour duration to firm evening peaks at a combined capital cost of ZAR 12.8 billion. Local-content rules, which require 40% for solar modules and 45% for wind towers, favor vertically integrated developers such as BioTherm and Distributed Power Africa, although compliance increases capex by 8-12%. Achieving the master plan’s 2.5 GW annual procurement goal will stretch NERSA’s approval capacity and Eskom’s grid integration resources.
Surge in Corporate PPAs & Wheeling Frameworks
Finalized in May 2025, NERSA’s wheeling tariff of ZAR 0.12 per kWh enables third-party use of Eskom’s network and underpins over 800 MW of corporate PPAs signed in 2024. Mining, manufacturing, and data-center operators led adoption as bilateral PPA prices settled around ZAR 0.45 per kWh—below prevailing industrial tariffs. Virtual wheeling platforms aggregate surplus rooftop solar and transfer certificates to industrial off-takers, cutting renewable-energy certificate costs by 15%. Zambia and Zimbabwe are drafting similar frameworks; Zambia’s regulator expects implementation by Q3 2025 to unlock cross-border trade within the Southern African Power Pool. Lenders remain cautious and often require standby letters of credit, adding 50-75 basis points to financing spreads.
Restraints Impact Analysis*
| Restraint | (~) % Impact on CAGR Forecast | Geographic Relevance | Impact Timeline |
|---|---|---|---|
| Transmission bottlenecks in Cape & Namibia corridors | -2.4% | South Africa (Northern, Western, Eastern Cape), Namibia | Short term (≤ 2 years) |
| Wind-specific site scarcity & auction failures | -1.3% | South Africa (Eastern Cape, Western Cape) | Medium term (2-4 years) |
| Currency & sovereign-credit risk deterring project finance | -1.8% | South Africa, Angola, Zambia | Medium term (2-4 years) |
| Skills gap for utility-scale BESS & O&M | -0.9% | Regional, concentrated in South Africa | Short term (≤ 2 years) |
| Source: Mordor Intelligence | |||
Transmission Bottlenecks in Cape & Namibia Corridors
Northern Cape lines operate at 92% utilization, curtailing 180 gigawatt-hours (GWh) per year and delaying grid connections by up to 18 months. Eskom deferred the ZAR 4.5 billion Aries–Kronos upgrade due to liquidity constraints, leaving 1.2 GW of awarded projects stranded. NamPower’s Kokerboom–Gerus backbone can absorb only 800 MW of additional injections, yet Hyphen alone needs 2.5 GW of export capacity.[4]NamPower, “Network Development Plan,” nampower.com.na Private-sector interest exists, but cost-recovery and wheeling-tariff pass-through remain unclear, stalling financial close on the first independent transmission projects. Developers are co-locating batteries to shift output into off-peak transmission windows, adding USD 150-200 per kW to capital expenditures (capex) and trimming equity returns by up to 2 percentage points.
Wind-Specific Site Scarcity & Auction Failures
Bid Window 7 received no wind bids owing to port logistics, limited high-wind sites near grid access, and elevated turbine transport costs. Environmental assessments for wind projects now average 24 months, due to stricter avian-collision studies, which is double the timeline for solar projects. Offshore wind remains in early study phases; 17 GW of technical potential along the Western Cape lacks seabed lease rules or port infrastructure, pushing the first commercial units beyond 2030. Developers are pivoting toward hybrid solar-wind-storage schemes that improve bankability but dilute the wind’s share. Bid Window 8 may introduce wind-specific carve-outs at higher tariff caps; however, any perceived subsidy could trigger a political backlash.
*Our forecasts treat driver/restraint impacts as directional, not additive. The impact forecasts reflect baseline growth, mix effects, and variable interactions.
Segment Analysis
By Technology: Hydropower Anchors, Wind Surges
Hydropower dominated the Southern African renewable energy market, accounting for a 61.25% share in 2025, as legacy assets, such as Zambia’s Kariba and the Democratic Republic of Congo’s Inga complexes, continue to supply bulk power. Wind capacity is expected to post a 24.35% CAGR to 2031, the fastest among all technologies, supported by forthcoming REIPPPP carve-outs and expanding corporate PPAs. Solar, including photovoltaic and concentrated solar power, accounted for 28.60% of capacity in 2025; ACWA Power’s 420 MW Redstone plant with 12-hour molten-salt storage demonstrated solar’s dispatchable potential, a feature utilities favor for evening peaks. Bioenergy remains a niche market, accounting for less than 2% of capacity, primarily concentrated in South Africa’s sugarcane belt, where mills co-generate power from bagasse. Geothermal and ocean energy are still in the exploratory stage; Tanzania’s Rift Valley sites offer up to 5 GW of potential, but drilling costs of nearly USD 5 million per well dampen near-term prospects.
Developers anticipate that pumped-storage projects at Eskom’s Ingula and Drakensberg sites will contribute 1.4 GW to grid balancing by 2030, despite capital costs exceeding USD 2,000 per kW. Small hydropower projects under 10 MW are proliferating in Angola and Mozambique through donor finance, aiming to reach 300 MW by 2030. Wind’s upswing hinges on logistics solutions at Port Elizabeth and expedited environmental permits; hybrid solar-wind-storage plants are expected to win contracts as they diversify revenue streams. Ocean-energy pilot programs in Algoa Bay currently remain below commercial readiness levels, making material additions unlikely this decade. Overall, technology diversification is narrowing hydropower’s dominance and steering the Southern Africa renewable energy market toward a more balanced mix.


By End-User: Utilities Anchor Capacity While C&I Demand Surges
Utilities accounted for 51.62% of capacity in 2025, reflecting the long-standing dominance of REIPPPP and BESIPPPP contracts feeding Eskom’s grid. Commercial and industrial (C&I) buyers are projected to log a 20.15% CAGR through 2031 as wheeling rules slash transaction costs and renewables hedge tariff volatility. Mining houses such as Anglo American and Sibanye-Stillwater have each signed PPAs exceeding 100 MW to secure power at a rate of under ZAR 0.50 per kWh. Retail chains Shoprite and Woolworths are rolling out more than 50 MW of rooftop solar, advancing toward their goal of 100% renewable electricity by 2028. Residential rooftop solar surpassed 1.5 GW in 2024, with battery attachment rates close to 40% in metropolitan areas.
C&I growth is concentrated in manufacturing, data centers, and retail centers that seek Scope 2 decarbonization under the Science-Based Targets initiative commitments. Virtual wheeling creates geographic arbitrage between high-irradiance generation zones and load centers, trimming delivered costs by 10-15%. M-Pesa-enabled pay-as-you-go solar continues to expand in lower-income urban and peri-urban households, though individual systems remain under 1 kW. Utilities’ market share is projected to slip below 45% by 2031 as distributed resources erode centralized dispatch models. The Southern African renewable energy market size for distributed generation is forecast to grow sixfold between 2026 and 2031 as regulatory barriers are removed.
Geography Analysis
South Africa controlled 42.35% of capacity in 2025, underpinned by 7.2 GW procured through REIPPPP and a regulatory overhaul that enables third-party wheeling. The Northern Cape hosts 60% of South Africa’s utility-scale solar installations, thanks to irradiance levels above 2,200 kWh/m². However, grid connections now face an average wait of 18 months due to delayed transmission upgrades. Corporate PPAs totaling 800 MW were signed in 2024 at tariffs of nearly ZAR 0.45 per kWh, which is significantly lower than Eskom’s industrial rates. Green-hydrogen ambitions at Boegoebaai could absorb 3.5 GW of renewables and tighten module supplies for domestic markets. NERSA’s ZAR 0.12 per kWh wheeling tariff is expected to unlock 1.5 GW of rooftop solar by 2028.
Angola, Zambia, and the Democratic Republic of Congo jointly hold roughly 35% of capacity, driven by hydropower in the Congo River basin. Angola’s Laúca expansion and Caculo Cabaça plant added 558 MW in 2024, boosting firm supply to the Southern African Power Pool. Zambia secured USD 150 million from the IFC to finance 500 MW of solar and small hydro projects, aimed at reducing its dependence on the drought-prone Kariba reservoir. Inga 3, a 4.8 GW extension in the Democratic Republic of the Congo, remains in a feasibility study, with the final investment decision pushed beyond 2026. Tanzania’s 300 MW Mwenga hydro and Mozambique’s 120 MW Mocuba solar asset advanced to construction in 2024 with AfDB and EIB backing.
Comoros, although accounting for less than 1% of the volume, is poised for a 51.02% CAGR as donor-funded mini-grids replace diesel at current costs of USD 0.40 per kWh. Botswana and Namibia are expanding utility-scale solar. Namibia’s Hyphen project alone will install 7 GW by 2030, potentially redirecting equipment away from South African demand. Zimbabwe’s 600 MW pipeline is hindered by foreign-exchange shortages and debt arrears, limiting near-term projects to sub-10 MW plants that sidestep multilateral guarantees. Cross-border trade via the Southern African Power Pool is rising as Mozambique’s Cahora Bassa exports 1.5 GW to South Africa under long-term contracts.
Competitive Landscape
The Southern Africa renewable energy market is moderately fragmented; the top five developers, Scatec, EDF Renewables, Enel Green Power, ACWA Power, and BioTherm, control close to 40% of operating capacity. Vertical integration grants cost advantages; BioTherm and Distributed Power Africa qualify under 40% local-content mandates by sourcing towers and control panels from domestic suppliers, trimming import lead times by up to twelve weeks. Long-term supply agreements, such as Scatec’s module off-take with JinkoSolar and EDF’s turbine framework with Vestas, reduce exposure to component price swings.
White-space is growing in distributed generation and virtual wheeling, segments where Sola Group and Distributed Power Africa have aggregated portfolios exceeding 200 MW across 150 rooftops.[7]Sola Group, “Commercial Solar Rollout,” sola-group.com Battery integrators Pylontech South Africa and Freedom Won are capturing margin by bundling software that extends cell life beyond 6,000 cycles, a feature prized for long-duration contracts. Offshore wind remains a greenfield opportunity; more than 17 GW of Western Cape potential awaits seabed-lease and port-infrastructure frameworks, offering European turbine makers an opportunity to replicate the North Sea business model.
Regulatory compliance has become an entry barrier. Projects must meet the ISO 9001 quality management standard and the IEC 61215 photovoltaic standard to qualify for REIPPPP. Smaller independent developers lacking in-house certification often rely on third-party labs, which adds 3% to soft costs and extends the financial close by up to six weeks. As competition intensifies, long-tenor PPAs with investment-grade off-takers and blended-finance structures are key differentiators in securing capital at competitive rates.
Southern Africa Renewable Energy Industry Leaders
Scatec ASA
EDF Renewables
Enel Green Power SA
BTE Renewables
ACWA Power
- *Disclaimer: Major Players sorted in no particular order

Recent Industry Developments
- May 2025: NERSA published final wheeling rules that set a ZAR 0.12 per kWh tariff for third-party network use, unlocking an estimated 1.5 GW of virtual PPAs by 2028.
- December 2024: REIPPPP Bid Window 7 awarded eight solar projects totaling 1,760 MW at a weighted average tariff of ZAR 0.47 per kWh.
- August 2024: The Electricity Regulation Amendment Act separated Eskom’s transmission business into an independent entity and opened the grid to private investment.
- February 2024: IFC committed USD 150 million to Zambian renewables, aiming to achieve 500 MW of solar and small hydro power by 2027.


Southern Africa Renewable Energy Market Report Scope
Renewable energy is derived from natural sources that replenish faster than they are consumed, such as sunlight, wind, water, geothermal heat, and biomass. These resources are considered inexhaustible and are used to generate electricity, heat, and fuel, typically resulting in a lower carbon footprint and reduced environmental impact compared to fossil fuels.
The Southern Africa Renewable Energy Market is segmented by technology and end-user. By technology, the market is segmented into Solar Energy (PV and CSP), Wind Energy (Onshore and Offshore), Hydropower (Small, Large, and PSH), Bioenergy, Geothermal, and Ocean Energy (Tidal and Wave). By end user, the market is segmented into Utilities, Commercial and Industrial, and Residential. The report also covers the market size and forecasts for various countries in Southern Africa, including Angola, Botswana, Comoros, the Democratic Republic of the Congo (DRC), Eswatini, Lesotho, Madagascar, Malawi, Mauritius, Mozambique, Namibia, Seychelles, South Africa, Tanzania, Zambia, and Zimbabwe.
For each segment, market sizing and forecasts have been conducted based on installed capacity (GW).
By Technology
| Solar Energy (PV and CSP) |
| Wind Energy (Onshore and Offshore) |
| Hydropower (Small, Large, PSH) |
| Bioenergy |
| Geothermal |
| Ocean Energy (Tidal and Wave) |
By End-User
| Utilities |
| Commercial and Industrial |
| Residential |
By Geography
| South Africa |
| Namibia |
| Zambia |
| Mozambique |
| Botswana |
| Angola |
| Zimbabwe |
| Rest of Southern Africa |
| By Technology | Solar Energy (PV and CSP) |
| Wind Energy (Onshore and Offshore) | |
| Hydropower (Small, Large, PSH) | |
| Bioenergy | |
| Geothermal | |
| Ocean Energy (Tidal and Wave) | |
| By End-User | Utilities |
| Commercial and Industrial | |
| Residential | |
| By Geography | South Africa |
| Namibia | |
| Zambia | |
| Mozambique | |
| Botswana | |
| Angola | |
| Zimbabwe | |
| Rest of Southern Africa |


Key Questions Answered in the Report
How fast is capacity in Southern Africa expected to grow through 2031?
Installed renewables should climb from 37.21 GW in 2025 to 86.63 GW in 2031, implying a 15.12% annual growth rate during the forecast period (2026-2031).
Which technology will add the most new capacity?
Onshore wind is projected to record the fastest expansion, rising at a 24.35% CAGR as corporate PPAs and future REIPPPP carve-outs unlock projects in the Eastern Cape and Namibia.
What role will green hydrogen play in future demand?
Namibia’s 7 GW Hyphen project and South Africa’s Boegoebaai corridor could absorb 12 GW of renewables by 2030, tightening supply of modules and turbines for domestic utility and C&I developers.
How do new wheeling rules change corporate procurement?
NERSA’s ZAR 0.12 per kWh wheeling tariff allows third-party use of Eskom lines, enabling firms in Gauteng and elsewhere to contract remote solar and wind power at prices about 15% below grid tariffs.
What is the main bottleneck limiting near-term additions?
Transmission congestion in the Northern Cape and Namibia corridors is curtailing output and delaying grid connections; upgrades worth more than ZAR 4.5 billion are still awaiting financial close.
Are currency risks manageable for foreign investors?
Partial-risk guarantees from IFC and AfDB cover up to 40% of exposure, but residual FX risk and sub-investment-grade sovereign ratings still push loan margins to SOFR + 450-550 bps.
Page last updated on:


