Market Overview
| Study Period | 2021 - 2031 |
|---|---|
| Forecast Data Period | 2026 - 2031 |
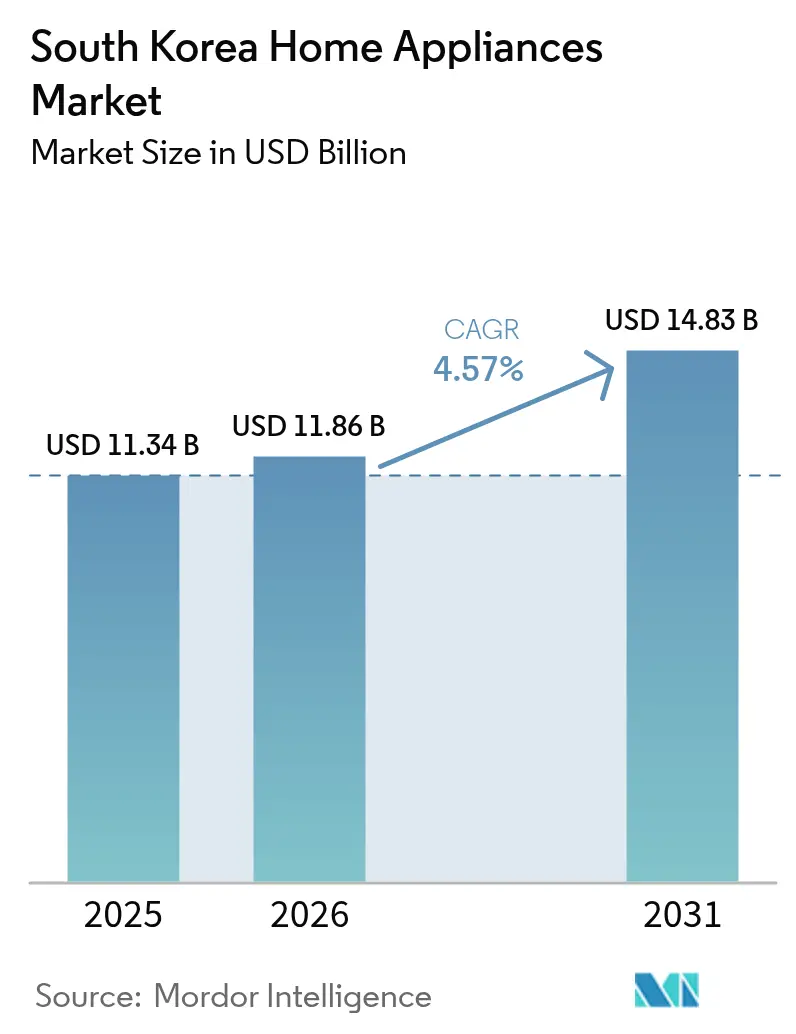
| Base Year Market Size (2025) | USD 11.34 Billion |
| Market Size (2026) | USD 11.86 Billion |
| Market Size (2031) | USD 14.83 Billion |
| Growth Rate (2026 - 2031) | 4.57% CAGR |
| Market Concentration | Medium |
Major Players *Disclaimer: Major Players sorted in no particular order Image © Mordor Intelligence. Reuse requires attribution under CC BY 4.0. | |
South Korea Home Appliances Market Analysis by Mordor Intelligence
The South Korea home appliances market size is expected to grow from USD 11.34 billion in 2025 to USD 11.86 billion in 2026 and is forecast to reach USD 14.83 billion by 2031 at a 4.57% CAGR over 2026-2031. The government’s Top Efficiency Household Appliance Rebate Program, revived in July 2025 with KRW 267.1 billion (USD 205.5 million) in funding and a 10% refund on Grade-1 purchases, catalyzed 662,000 applications within the first month and a 29% sales surge, signaling powerful short-term demand acceleration. Rental eligibility widened adoption further, with subscription providers recording a 92% jump in sales as the rebate eased monthly fee sensitivity[1]Hee-hun Yun, “Top-efficiency appliance rebate boosts Korean appliance sales by reviving demand,” CHOSUNBIZ, biz.chosun.com . The shift toward recurring services advanced as LG’s subscription revenue generated KRW 1 trillion (USD 1.5 billion) in 2025, validating customer preference for lower upfront costs and integrated care.
Key Report Takeaways
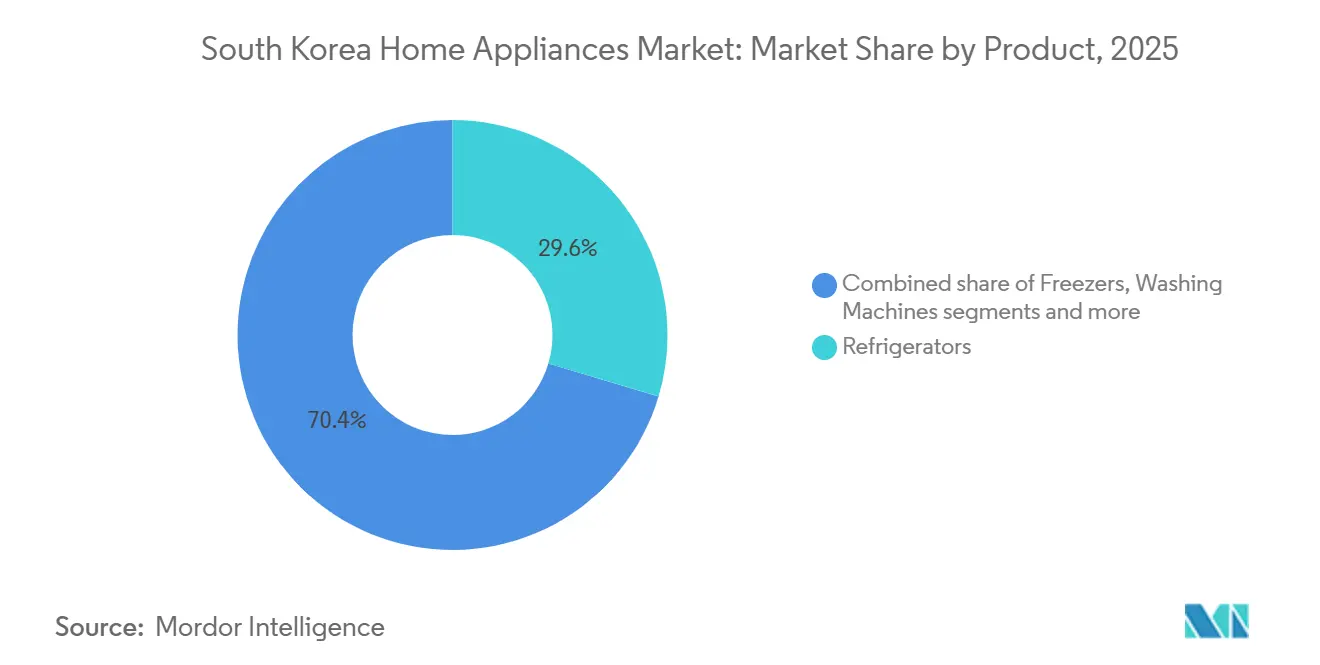
- By product type, refrigerators led with 29.62% of the South Korea home appliances market share in 2025, while electric rice cookers are projected to expand at a 5.32% CAGR through 2031.
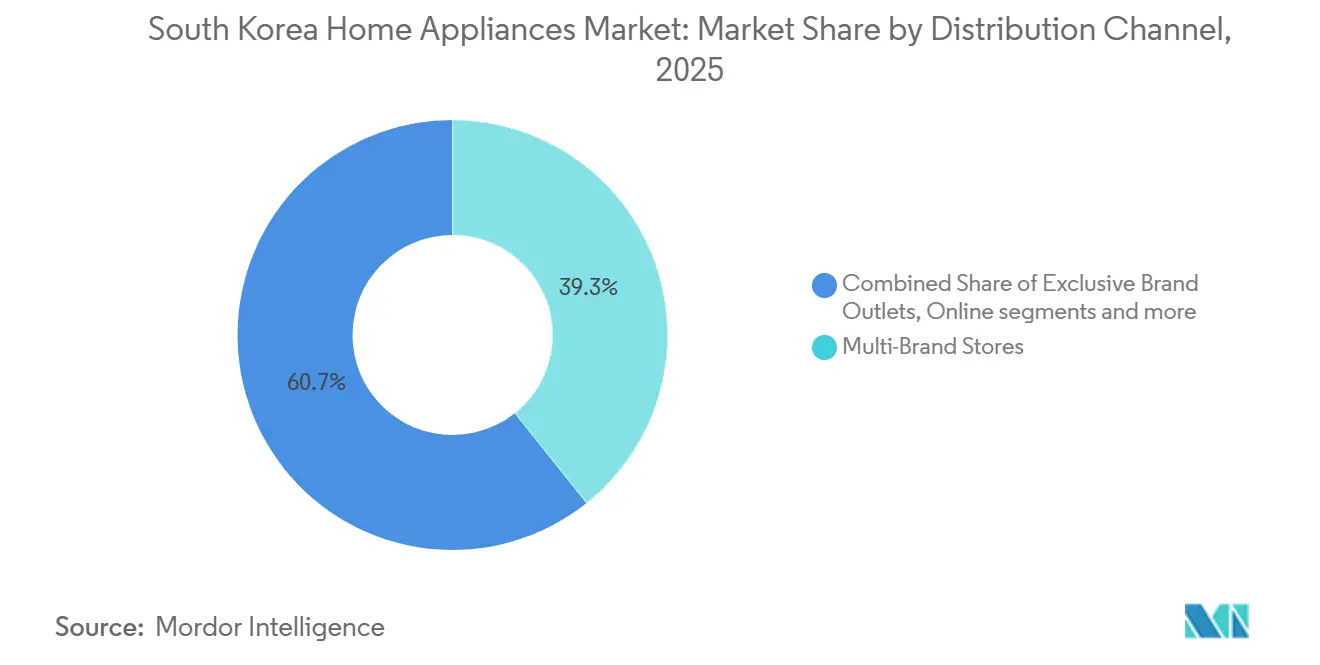
- By distribution channel, multi-brand stores held 39.25% of the South Korea home appliances market share in 2025, whereas online platforms are set to record the fastest 5.96% CAGR through 2031.
- By geography, Gyeonggi Province commanded 34.60% of the South Kore home appliances market share in 2025, but Gyeongsang Province is forecast to grow at a 5.63% CAGR through 2031.
Note: Market size and forecast figures in this report are generated using Mordor Intelligence’s proprietary estimation framework, updated with the latest available data and insights as of 2026.
South Korea Home Appliances Market Trends and Insights
Drivers Impact Analysis*
| Driver | (~) % Impact on CAGR Forecast | Geographic Relevance | Impact Timeline |
|---|---|---|---|
| Energy-efficiency rebates catalyzing upgrade cycles | +1.2% | National, with peak uptake in the Seoul Capital Area and the Chungcheong | Short term (≤ 2 years) |
| Government-backed smart home initiatives are accelerating connected appliance adoption | +0.9% | Seoul Capital Area, expanding to Yeongnam and Honam via 5G build-out | Medium term (2-4 years) |
| AI/IoT platforms lifting ASPs and device stickiness | +0.8% | Urban cores, including Seoul, Busan, and Incheon, have premium apartments | Medium term (2-4 years) |
| Rise of single-person households boosting compact and multi-function formats | +0.7% | Seoul, Gyeonggi, Jeju, with a concentration in the Seoul-Gyeonggi cluster | Medium term (2-4 years) |
| Subscription-rental penetration shortening replacement cycles | +0.6% | National, initially led by Seoul Capital Area adopters | Long term (≥ 4 years) |
| Expansion of efficiency labeling to new categories nudging upgrades | +0.4% | National, with pilot enforcement in metropolitan retail | Short term (≤ 2 years) |
| Source: Mordor Intelligence | |||
Energy-Efficiency Rebates Catalyzing Upgrade Cycles
Ministry of Trade, Industry and Energy (MOTIE) revived the Top Efficiency Household Appliance Rebate Program in July 2025, allocating KRW 267.1 billion (USD 205.5 million) to refund 10% of the purchase price for Grade-1 televisions, refrigerators, air conditioners, washing machines, and other labeled categories[2]Korea Bizwire Staff, “Energy Efficiency Rebate Program Boosts Appliance Sales in South Korea,” Korea Bizwire, koreabizwire.com. Within one month, 662,000 rebate applications totaling KRW 88.2 billion (USD 61.1 million) in refunds flowed through, indicating KRW 882 billion (USD 612 million) in qualifying sales and a 29% year-on-year jump for participating retailers. A new feature that offered rebates on rentals triggered a 92% sales surge among subscription providers, enabling them to present Grade-1 models with lower effective monthly fees. Draft rulemaking in 2025 and 2026 proposed broader minimum efficiency coverage for additional categories, such as electric fans in 2026 and clothes dryers in 2027, which increases the likelihood of accelerated inventory refresh as substandard stock becomes non-compliant. This regulatory pathway aligns with global trends summarized by the International Energy Agency, which documents new or strengthened MEPS in multiple economies that are pushing higher performance baselines for home devices. For appliance makers, Grade-1 certification now serves as a practical gate to volume, focusing R&D on inverter compressors, variable-speed motors, and heat-pump dryers that meet tightening targets.
Government-Backed Smart Home Initiatives Accelerating Connected Appliance Adoption
Policy support for smart, eco-ready housing, combined with fast broadband and 5G coverage, encourages builders to pre-install platforms like SmartThings and ThinQ that simplify the orchestration of lighting, HVAC, and major appliances from the first day of occupancy. Demonstrations at global fairs emphasize the role of integrated ecosystems, including Samsung’s multi-device experiences spotlighted at CES 2026 that bring appliance control, security, and AI across a unified interface. These integrations reduce the likelihood of switching after move-in because residents learn one hub, one app, and one permissions workflow that carries across device categories. LG's ThinQ Pro platform, launched in February 2026 for North American B2B clients, anticipates similar deployment in Korean multi-family housing: centralized QR-based onboarding, predictive maintenance alerts, and real-time energy dashboards transform property managers into ecosystem gatekeepers[3]LG Electronics, “LG Electronics Presents the Future of Luxury Home Living at KBIS 2026,” LG Global Newsroom, lg.com . Regulatory influence stems from the Ministry of Science and ICT's IoT device certification protocols, which ensure baseline cybersecurity and interoperability. Samsung's BSI IT Security Label for its Bespoke AI appliances under the Korea-Germany mutual recognition arrangement signals compliance as a competitive moat.
AI/IoT Platforms Lifting ASPs and Device Stickiness
Samsung’s January 2026 integration of Google Gemini into its Bespoke AI Family Hub refrigerator marked the first LLM-scale conversational experience embedded in kitchen hardware, enabling natural-language meal planning and camera-based food recognition. Premium features in AI laundry, cooling, and floor care were also showcased at CES 2026, including hybrid cooling architectures and AI vacuum navigation that rely on on-device processing, which adds differentiated value that sustains pricing power. LG’s 2026 luxury lineup placed conversational intelligence and predictive control into high-end refrigerators and laundry systems, and the firm’s ThinQ Pro platform extended enterprise-grade fleet management to residential contexts, enhancing life-cycle revenue per household. Security credentials have become part of the selling proposition as well, with Samsung’s appliances receiving the BSI IT Security Label in 2025 under a Korea-Germany recognition framework that verifies IoT security standards[4]Samsung Electronics, “A Home Companion Making Daily Life More Effortless,” Samsung Global Newsroom, news.samsung.com . As AI features migrate into mid-range SKUs, the South Korean home appliances market gains bro
Rise of Single-Person Households Boosting Compact and Multi-Function Formats
In 2025, single-person households became the largest household type at 36.1% of all residences, totaling more than 8.05 million units, which has raised demand for small-footprint, flexible appliances for solo living. Space constraints and budget discipline nudge buyers toward multifunction devices that combine two or three use cases into a single chassis, especially in dense urban areas around Seoul and Gyeonggi. Local brands have responded with compact and convertible formats, from heat-pump washer-dryer combos to narrower refrigerators that still meet Grade-1 efficiency thresholds under national standards. Entry points are increasingly tiered through rentals that package installation, filter replacements, and regular inspections to reduce ownership friction for residents who favor predictable monthly fees. Geographic concentration in the Seoul Capital Area intensifies category testing, since high digital penetration and fast logistics enable brands to pilot compact and subscription bundles before nationwide scaling. These dynamics give the South Korea home appliances market a steady pipeline of first-time renters and upgraders who value convenience over raw capacity.
Restraints Impact Analysis*
| Restraint | (~) % Impact on CAGR Forecast | Geographic Relevance | Impact Timeline |
|---|---|---|---|
| Saturated ownership and a flat population limit the new-buyer pool | -0.9% | National, acute in the Seoul Capital Area with 95%+ penetration | Long term (≥ 4 years) |
| Input-cost volatility and tariff exposure are compressing margins | -0.6% | National, affecting import-dependent manufacturers | Medium term (2-4 years) |
| Expanded EPR recycling compliance is increasing producer costs | -0.5% | National, disproportionately burdening SMEs vs. chaebols | Short term (≤ 2 years) |
| Data blind spots for subscription channels are impairing channel optimization | -0.2% | Emerging in the Seoul Capital Area and the Chungcheong pilot zones | Medium term (2-4 years) |
| Source: Mordor Intelligence | |||
Saturated Ownership and a Flat Population Limiting New-Buyer Pool
Refrigerator and washing-machine ownership already exceeds 95% among households, which means unit volumes depend on replacement rather than first-time purchases. Population growth remains flat through 2026, and the country is rapidly aging, with the share of residents 65 and older already above one-fifth by 2024, narrowing the primary age cohort that traditionally drives new household formation. In saturated categories, replacement cycles typically span a decade or more unless incentives or technological leaps prompt earlier trade-ins. Rebates can offset inertia temporarily, but consistent funding is required to sustain momentum after the initial rush of pent-up demand. The strategic response has been to monetize existing installs through premium features, value-added services, and software updates that lift lifetime revenue, even if units per household plateau, helping keep the South Korea home appliances market on a steady growth track.
Expanded EPR Recycling Compliance Increasing Producer Costs
From January 2026, Korea’s Extended Producer Responsibility regime applies to all electrical and electronic equipment, expanding producers' obligations for collection and recycling and introducing additional compliance layers that are harder for small- and mid-sized brands to absorb. Non-compliance can incur penalties calculated as a multiple of per-unit recycling costs, which raises the financial stakes for makers that lack integrated reverse logistics or refurbishment capacity. Contribution fees for a mid-sized firm shipping 100,000 units can exceed KRW 500 million (USD 0.38 million), and some companies face additional budget for ERP integration, reporting, and staff training to meet audit-ready reporting standards. Aligning with broader trends in product sustainability, guidance issued by recognized testing and certification bodies highlights expanding obligations across labeling, design for recycling, and hazardous-substance restrictions that will require accelerated redesign for legacy SKUs. Larger incumbents can amortize compliance across scale and often capture residual value in refurbishment loops, but smaller brands may need partnerships to meet rising targets without eroding margins in the South Korean home appliances market.
*Our forecasts treat driver/restraint impacts as directional, not additive. The impact forecasts reflect baseline growth, mix effects, and variable interactions.
Segment Analysis
By Product: Major Appliances Lead Share, Rice Cookers Command Fastest Growth
Refrigerators accounted for 29.62% of 2025 revenues, reflecting non-discretionary status and the persistence of multi-compartment formats that preserve fresh produce and kimchi, a foundation that anchors the South Korea home appliances market. Electric rice cookers are the fastest-growing product category, with a 5.32% CAGR through 2031, as consumers pay for precise pressure and induction control tailored to grain type and texture. Washing machines and air conditioners remain significant, with efficiency-led design upgrades and heat-pump technology enabling performance gains under the country’s energy labeling regime. Dishwashers, historically smaller due to space constraints and cleaning habits, have been advancing from a low base with compact formats and integrated installation packages that lower adoption barriers for apartment dwellers. Across major categories, policy rebates and rising expectations for AI features lift replacement intent, while platform compatibility steers buyers toward models that fit within SmartThings or ThinQ ecosystems, which are prominent in the South Korea home appliances market.
Small home appliances are driving faster unit growth as households seek compact, task-focused devices, from coffee makers to air fryers. Air fryers and electric kettles suit time-sensitive routines in compact kitchens, and the expansion of energy labeling to additional categories is expected to nudge redesigns that consolidate share among technically advanced brands. Counter-top ovens and toasters benefit from bundling with curated rental packages that include installation and service alongside larger appliances, improving attachment rates for mid-ticket items. These shifts help the South Korea home appliances industry maintain momentum by balancing premium innovation in core white goods with agile additions in space-saving categories.


By Distribution Channel: Multi-Brand Stores Anchor Share, Online Surges at Fastest Clip
Multi-brand stores accounted for 39.25% in 2025, underscoring shopper preference for in-person evaluation of size, noise, and fit, as well as for turnkey services like delivery, installation, and trade-in. These floors also showcase high-end AI devices that benefit from live demonstrations, which can raise conversion for premium refrigerators or laundry systems by making features tangible. Experience-led retail remains a differentiator, especially when brands coordinate with retailers on promotions that pair Grade-1 efficiency models with immediate rebate guidance at the point of sale. The alignment of live demos and delivery guarantees keeps a significant share of big-ticket transactions in physical channels in the South Korean home appliances market.
Online platforms post the fastest growth, with a 5.96% projected CAGR through 2031, supported by widespread mobile shopping and dense last-mile networks in the Seoul Capital Area. Direct brand stores complement third-party marketplaces by offering curated bundles, software-enabled features, and first-party support that simplify onboarding for connected devices. Quick-delivery services that handle small appliances alongside groceries encourage impulse purchases and reorder behavior, helping smooth seasonality in demand. Omnichannel orchestration that harmonizes pricing and service policies across stores, marketplaces, and rentals is now a baseline requirement for share defense in the South Korea home appliances market.
Geography Analysis
Gyeonggi Province accounted for 34.60% of 2025 revenues, supported by large suburban populations around Seoul, strong income levels, and early adoption of connected devices that align with new apartment builds. The Seoul Capital Area, which includes Seoul, Gyeonggi, and Incheon, serves as the center of gravity for omnichannel distribution, same-day fulfillment, and pilot programs for compact formats suited to high-density living. Builders and property managers who embed hub devices at handover institutionalize platform preferences, which later influence brand choice when residents replace or upgrade appliances in the South Korea home appliances market.
Gyeongsang Province is forecast to expand at a 5.63% CAGR through 2031, driven by momentum in industrial hubs and the rising adoption of advanced cooling and laundry solutions among skilled workforces in cities such as Busan and Ulsan. The regional outlook is further underpinned by investment into AI-enabled facilities that raise incomes and tech readiness, which support both premium and subscription offerings as households weigh ease of service alongside feature sets. Brand pilots in coastal metros also help calibrate product-market fit for Korea-specific needs, such as odor management and fine-dust mitigation, thereby improving design relevance in the South Korea home appliances market.
Chungcheong’s administrative centers and semiconductor clusters sustain above-average household incomes and early interest in smart features, though the smaller population base caps absolute revenue. Honam and Gangwon track steady but slower trajectories as lower density and terrain limit store networks, even as targeted categories like air purifiers and dehumidifiers see periodic spikes tied to seasonal conditions. Jeju’s premium residential projects and hospitality sector are driving attachment rates for compact air and water devices, creating a distinct pocket of growth within the South Korea home appliances market.
Competitive Landscape
Competitive intensity is moderately concentrated, with Samsung Electronics and LG Electronics together accounting significant share of 2025 revenues and integrating chips, motors, and software to guide product roadmaps and ecosystem evolution. Samsung’s January 2026 demonstration of Google Gemini embedded in the Family Hub refrigerator and aligned AI feature sets in laundry and floor care highlights a pivot to conversational interfaces and on-device perception that carries across the home. LG emphasized premium experiences through SKS and LG SIGNATURE lineups that deliver LLM-based personalization and predictive cooling and laundry control, as well as a ThinQ Pro platform aimed at multi-unit residential portfolios. Security credentials are now part of brand strategy, with Samsung receiving the BSI IT Security Label in 2025 under a mutual recognition framework that validates IoT controls for connected appliances in Korea.
Niche specialists maintain relevance by focusing on categories such as water, air care, and compact formats that align with renter demand and small-footprint living. These firms often compete on service density and subscription economics rather than raw hardware scale, offering a route to recurring revenue in segments that are not a priority for full-line giants. Meanwhile, international brands localize SKUs for Korean floor plans and habits, gaining traction in select niches where specialized features or premium finishes create distinct value propositions in the South Korean home appliances market.
Standards participation and platform compatibility continue to shape the path to scale. Brands that earn recognized security labels and align with builder-driven hub choices can translate platform familiarity into category expansion when households replace appliances under incentive programs. Over the near term, the South Korean home appliances market will likely reward firms that convert service and data capabilities into everyday conveniences that substantiate premiums, while protecting privacy through validated device security.
South Korea Home Appliances Industry Leaders
Samsung Electronics Co., Ltd.
LG Electronics Inc.
Coway Co., Ltd.
Cuckoo Electronics Co., Ltd.
Winia Co., Ltd. (Dimchae)
- *Disclaimer: Major Players sorted in no particular order

Recent Industry Developments
- August 2025: The South Korean government's MOTIE officially launched the Top Efficiency Household Appliance Rebate Program. Supported by a 267.1 billion KRW budget, the initiative provides consumers with a 10% refund on top-rated energy-efficient appliances, including televisions, refrigerators, and washing machines. Within weeks of its rollout, the rebate triggered a sales surge of over 30% for high-efficiency household products.
- February 2025: Samsung Electronics launched the Bespoke AI Hybrid Refrigerator in South Korea. This innovative appliance features a hybrid cooling system that combines a traditional AI inverter compressor with a Peltier device thermoelectric element. This dual-power system activates during peak usage to rapidly boost cooling, improving energy efficiency by 30% beyond the highest domestic rating and significantly reducing electricity bills.
- April 2024: Henkel and Samsung Electronics partnered to launch custom wash cycles in South Korea designed to reduce energy consumption by 60%. The collaboration seamlessly integrates Henkel's Persil Deep Clean enzyme formula with Samsung's proprietary AI Bubble technology, delivering powerful stain removal and deep cleaning even in cold-water environments.


Research Methodology Framework and Report Scope
Market Definitions and Key Coverage
Our study defines the South Korean home appliances market as all newly manufactured major appliances (refrigerators, freezers, washing machines, dishwashers, ovens, air conditioners) and small appliances (coffee makers, vacuum cleaners, air fryers, electric rice cookers, and similar countertop devices) sold for household use, valued at transactional prices inside the country. The definition follows the scope laid out in the Mordor Intelligence report for 2019-2030.
Scope exclusion: Refurbished or second-hand units and purely consumer-electronics items such as televisions are not counted.
Segmentation Overview
- By Product
- Major Home Appliances
- Refrigerators
- Freezers
- Washing Machines
- Dishwashers
- Ovens (Incl. Combi & Microwave)
- Air Conditioners
- Other Major Home Appliances
- Small Home Appliances
- Coffee Makers
- Food Processors
- Grills & Roasters
- Electric Kettles
- Juicers & Blenders
- Air Fryers
- Vacuum Cleaners
- Electric Rice Cookers
- Toasters
- Counter-top Ovens
- Other Small Home Appliances
- Major Home Appliances
- By Distribution Channel
- Multi-Brand Stores
- Exclusive Brand Outlets
- Online
- Other Distribution Channels
- By Geography
- Seoul Capital Area
- Chungcheong Region
- Yeongnam Region
- Honam Region
- Gangwon Province
- Jeju Province
Detailed Research Methodology and Data Validation
Desk Research
We began with publicly available macro and industry datasets from Statistics Korea, Korea Customs Service, the Ministry of Trade, Industry and Energy, and the Korea Electrical Manufacturers Association, which reveal production, import-export flows, and grade-1 energy-efficiency uptake. Company filings, investor decks, and provincial energy-rebate bulletins added insights on average selling prices and channel mix. To verify company-level revenues, Mordor analysts accessed D&B Hoovers and Dow Jones Factiva. Academic journals in Energy Policy and trade press releases filled technology and regulatory gaps. The sources named are illustrative; a broader set was consulted to cross-check every data point collected.
Primary Research
Telephone interviews and short surveys with appliance retailers, e-commerce platforms, provincial distributors, and former product managers from leading brands supplied live insights on replacement cycles, online discounting, and consumer shift toward smart appliances across Seoul, Gyeonggi, Busan, and Jeolla. These conversations helped us validate secondary patterns, stress-test price assumptions, and fine-tune the forecast base year.
Market-Sizing & Forecasting
A top-down model reconstructs domestic demand by combining factory output, verified import volumes, and export deductions, followed by an adjustment for warranty returns. Selective bottom-up checks, retailer sell-out data snapshots, and sampled ASP × volume keep the totals grounded. Core variables include household formation rate, disposable income per capita, energy-efficiency rebate penetration, average appliance life span, e-commerce share of durable goods, and seasonally adjusted consumer-confidence indices. Multivariate regression on these drivers, supported by expert consensus, projects values to 2030, while gap areas in bottom-up samples are interpolated using matched-pair channel proxies.
Data Validation & Update Cycle
Outputs pass three-layer checks: automatic variance flags, senior analyst peer review, and a reconciliation of model totals with independent shipment or customs markers. Reports refresh yearly and are mid-cycle updated if policy changes, major product recalls, or sharp currency swings move the market baseline. An analyst re-audits all figures before client delivery.
Why Mordor's South Korea Home Appliances Baseline Commands Reliability
Published estimates often vary because firms choose unlike product baskets, apply differing import adjustments, or refresh data on separate cadences.
Key gap drivers emerge when some studies track only factory gate sales, others layer in retailer margins, while still others overlook cross-border e-commerce flows or apply a uniform inflation uplift without currency normalization. By aligning scope with on-the-ground channel checks and by updating every twelve months, Mordor minimizes these skews.
Benchmark comparison
| Market Size | Anonymized source | Primary gap driver |
|---|---|---|
| USD 11.34 B (2025) | Mordor Intelligence | - |
| USD 8.93 B (2024) | Regional Consultancy A | Factory gate view only; online imports and small-appliance tail excluded |
| USD 12.20 B (2024) | Trade Journal B | Combines retailer margin and goods value, double-counting mark-ups; no won-to-USD averaging window |
Gap notes compare each source with Mordor's documented approach.
In sum, the disciplined variable selection, transparent scope, and annual refresh mean Mordor delivers a balanced, decision-ready baseline that executives can trace back to clear drivers and repeatable steps.


Key Questions Answered in the Report
What is the size of the South Korea home appliances market in 2026, and how fast is it growing to 2031
The South Korea home appliances market size is estimated USD 11.86 billion in 2026 and is projected to reach USD 14.83 billion by 2031 at a 4.57% CAGR over 2026-2031.
Which product categories lead, and which are growing fastest in South Korea
Refrigerators led with 29.62% of 2025 revenues, while electric rice cookers are projected to post the fastest growth at a 5.32% CAGR through 2031.
Which sales channels are most important in South Korea for home appliances
Multi-brand stores led with a 39.25% share in 2025, and online platforms are forecast to grow the fastest at a 5.96% CAGR through 2031.
Which regions dominate demand in South Korea
Gyeonggi Province accounted for 34.60% of 2025 revenues, while Gyeongsang Province is expected to grow fastest at 5.63% CAGR to 2031.
What policy or technology trends matter most for appliance demand in South Korea
Energy-efficiency rebates, expanded labeling and MEPS, and AI-enabled smart ecosystems are the strongest drivers of upgrades and replacements.
How concentrated is competition in South Korea appliances
Samsung and LG together held around half of 2025 revenues, with ecosystem integration and security certifications reinforcing their positions.
Page last updated on:


