Market Overview
| Study Period | 2018 - 2031 |
|---|---|
| Forecast Data Period | 2026 - 2031 |
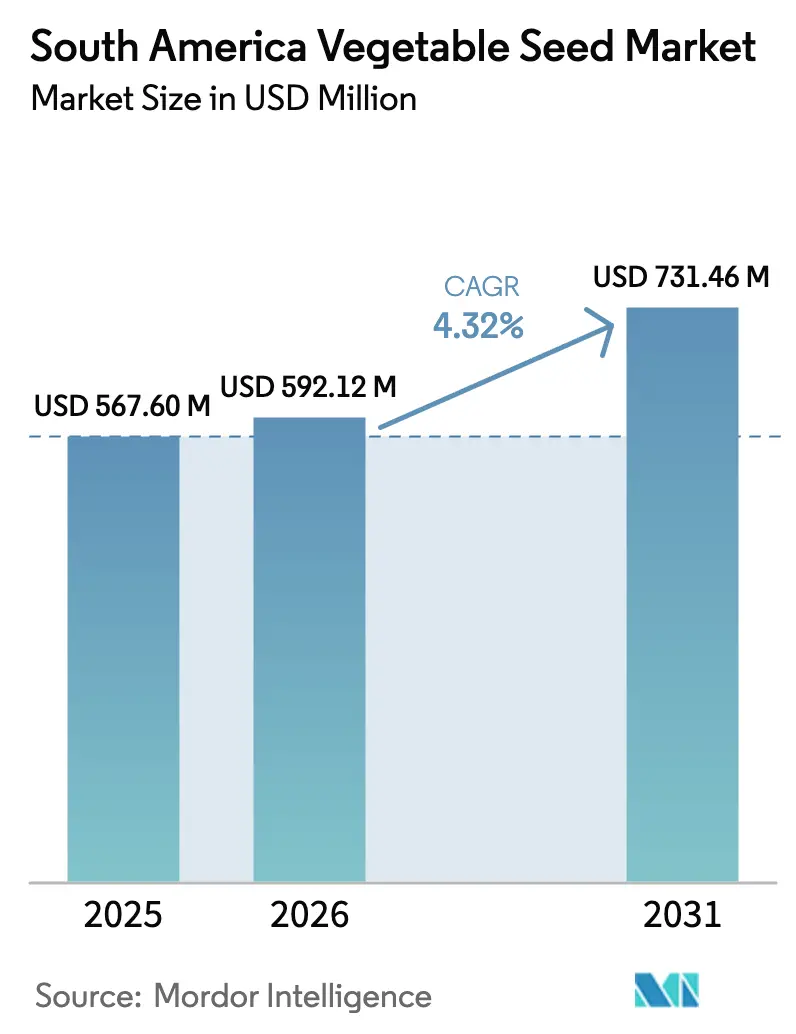
| Base Year Market Size (2025) | USD 567.6 Million |
| Market Size (2026) | USD 592.12 Million |
| Market Size (2031) | USD 731.46 Million |
| Growth Rate (2026 - 2031) | 4.32% CAGR |
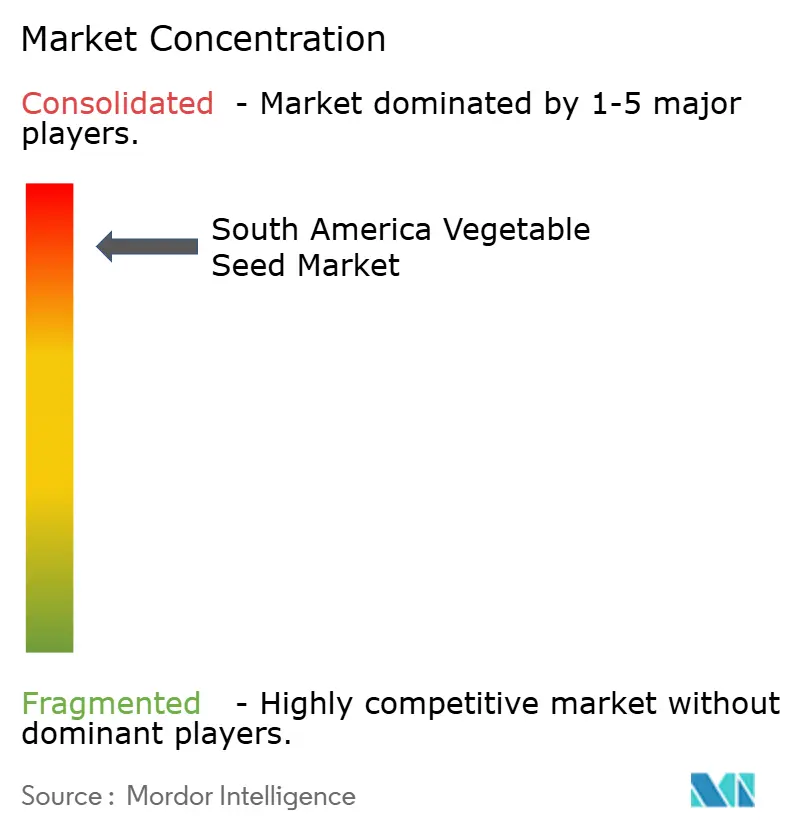
| Market Concentration | High |
Major Players *Disclaimer: Major Players sorted in no particular order Image © Mordor Intelligence. Reuse requires attribution under CC BY 4.0. | |
South America Vegetable Seed Market Analysis by Mordor Intelligence
The South America vegetable seed market size is expected to grow from USD 567.6 million in 2025 to USD 592.12 million in 2026 and is forecast to reach USD 731.46 million by 2031 at 4.32% CAGR over 2026-2031. This steady growth reflects the swift migration from subsistence plots to commercially oriented, precision-managed fields where hybrid vigor, protected cultivation, and drip irrigation converge to boost yields, improve resource efficiency, and unlock export premiums for high-value produce. Competitive priorities revolve around shortening breeding cycles, scaling climate-smart varieties, and answering mounting consumer calls for pesticide-free vegetables, all of which reinforce the premium positioning of the South America vegetable seed market.[1]Source: FAO, “Protected Agriculture for Food Security in Latin America,” fao.org Producers that master data-driven crop decisions, integrate carbon-credit incentives, and capitalize on government financing lines are anticipated to gain an edge as the South America vegetable seed market adjusts to climate variability and price-sensitive export channels. Multinational seed houses dominate with proprietary genetics, yet local breeders remain relevant by tailoring varieties to unique microclimates, signaling a diverse but tightly contested landscape in the South America vegetable seed market.
Key Report Takeaways
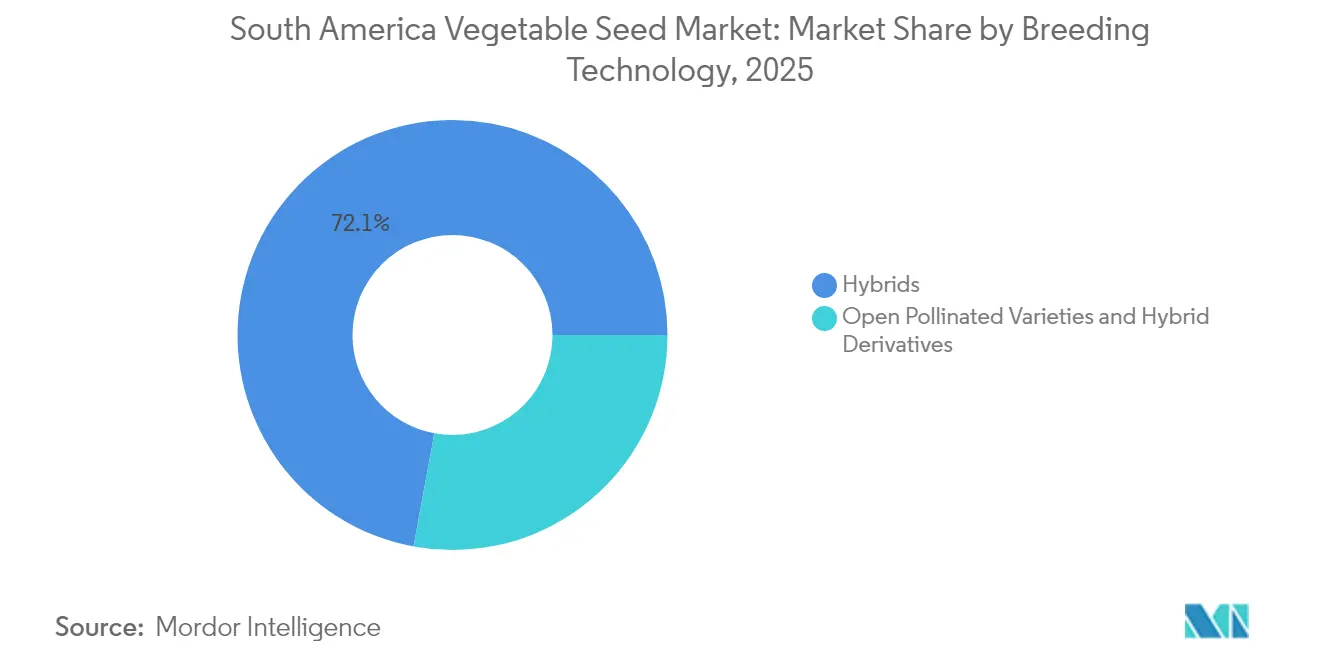
- By breeding technology, hybrids led with 72.10% of the South America vegetable seed market share in 2025, while Open Pollinated Varieties and Hybrid Derivatives are anticipated to grow at a 4.59% CAGR through 2031.
- By cultivation mechanism, open-field systems retained 99.77% share of the South America vegetable seed market size in 2025, while protected cultivation registered the highest projected CAGR at 8.26% through 2031.
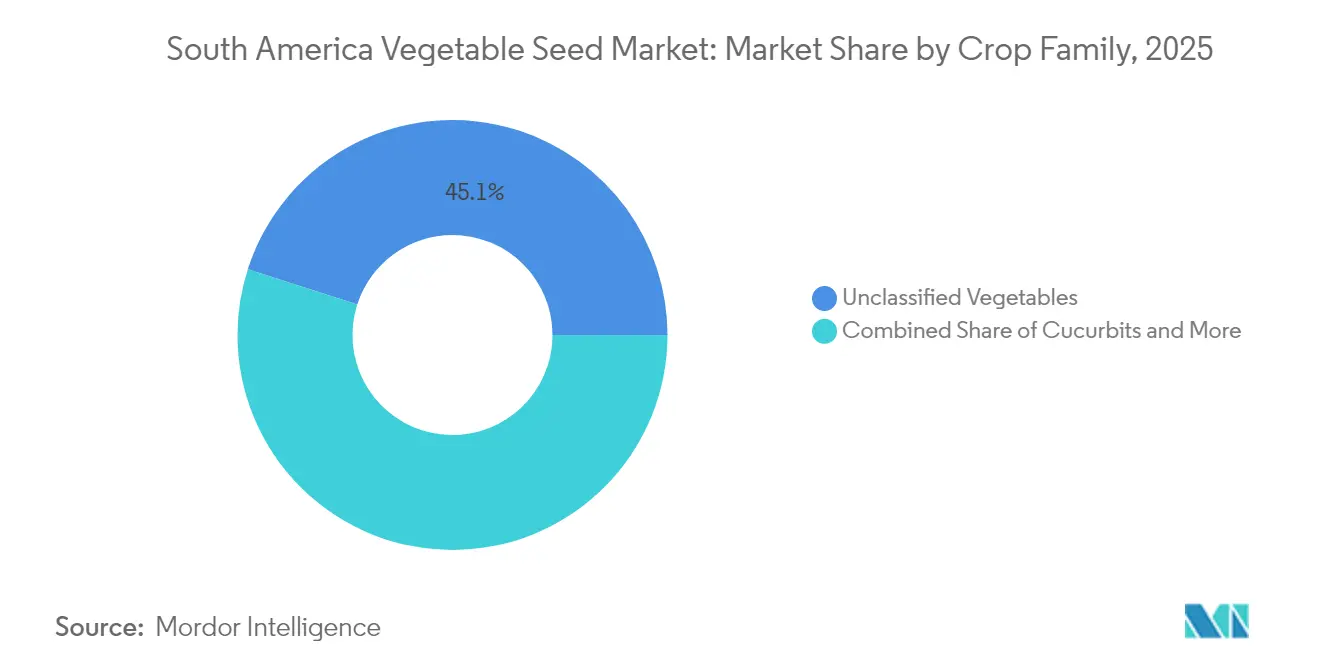
- By crop family, unclassified vegetables captured 45.05% of the South America vegetable seed market size in 2025 and are advancing at a 5.21% CAGR through 2031.
- By country, the Rest of South America region commanded 45.12% share of the South America vegetable seed market size in 2025, whereas Brazil is forecast to post the fastest 4.96% CAGR to 2031.
Note: Market size and forecast figures in this report are generated using Mordor Intelligence’s proprietary estimation framework, updated with the latest available data and insights as of 2026.
South America Vegetable Seed Market Trends and Insights
Drivers Impact Analysis*
| Driver | (~) % Impact on CAGR Forecast | Geographic Relevance | Impact Timeline |
|---|---|---|---|
| Favorable governmental R&D subsidies for protected cultivation | +0.8% | Brazil, Argentina, and Chile | Medium term (2-4 years) |
| Rapid adoption of hybrid seeds for high value export crops | +1.2% | Brazil, Argentina, Rest of South America | Short term (≤ 2 years) |
| Expansion of drip irrigation and fertigation infrastructure | +0.6% | Semi-arid production zones | Long term (≥ 4 years) |
| Rising consumer demand for pesticide-free produce | +0.9% | Urban centers and export destinations | Medium term (2-4 years) |
| AI-enabled trait-selection platforms lowering breeding cycles | +0.7% | Technology hubs in Brazil and Argentina | Long term (≥ 4 years) |
| Carbon-credit incentives for climate-smart vegetable farming | +0.3% | Argentina and Brazil pilot programs | Long term (≥ 4 years) |
| Source: Mordor Intelligence | |||
Favorable governmental R&D subsidies for protected cultivation
Protected cultivation financing is reshaping farm economics by channeling public funds into greenhouses and climate-controlled tunnels that deliver significant yield uplifts per hectare. Brazil's Plano Safra program carved out dedicated credit lines, and Chile's Siembra por Chile program disbursed substantial funding to small and mid-scale growers. National Agricultural Technology Institute (INTA) trials in Argentina confirm considerable water savings and elongated harvest windows in protected systems. Streamlined building permits and tax incentives further cut payback periods, while Colombia's PAAP scheme allocated funding for high-altitude greenhouse projects. Together, these measures expand the total addressable segment of the South America vegetable seed market.
Rapid adoption of hybrid seeds for high value export crops
Hybrid penetration is accelerating as exporters chase uniformity, color consistency, and pathogen resistance demanded by European and North American buyers. Hybrid tomatoes, peppers, and cucumbers represent a significant portion of Brazil's vegetable export stream.[2]Source: Ministry of Agriculture Brazil, “Plano Safra 2024/2025 Agricultural Financing Plan,” gov.br Argentine growers report substantial yield increases in hybrid onions that unlock off-season shipping windows at premium prices, readily offsetting higher seed outlays. Compliance gains are equally significant, disease-tolerant hybrids simplify phytosanitary certification and lower pesticide inputs, satisfying strict destination-market rules. Traceability platforms, when paired with proprietary seed lots, create a competitive moat that reinforces hybrid adoption in the South America vegetable seed market.
Expansion of drip irrigation and fertigation infrastructure
Drip technology adoption across semi-arid belts mitigates water stress while enabling precise nutrient delivery. The Inter-American Development Bank committed substantial funding to modernize irrigation, and Argentina installed drip lines across significant agricultural areas last year. With equipment costs down and credit terms more favorable, payback horizons have shortened considerably. Fertigation integration often raises yields substantially and reduces excess fertilizer loss, aligning with emerging environmental compliance norms. Policies that prioritize water-efficient systems strengthen long-run sustainability and broaden the South America vegetable seed market for drought-adaptive varieties.[3]Source: Inter-American Development Bank, “Irrigation Modernization Projects in South America,” iadb.org
Rising consumer demand for pesticide-free produce
Consumer preference shifts toward chemical-light vegetables continue to swell organic sales in Brazil, commanding significant premiums over conventional produce. Streamlined organic certification and biotechnology-enabled resistance traits encourage growers to adopt varieties requiring fewer sprays. Argentine organic vegetable exports show strong growth, propelled by European demand for residue-free onions and garlic. The expanding biological control sector complements resistant genetics, demonstrating symbiotic growth potential across the South America vegetable seed market.
Restraints Impact Analysis*
| Restraint | (~) % Impact on CAGR Forecast | Geographic Relevance | Impact Timeline |
|---|---|---|---|
| Fragmented distribution networks in Andean markets | -0.7% | Peru, Ecuador, Bolivia, and Colombia | Medium term (2-4 years) |
| Counterfeit seed trade eroding brand trust | -0.5% | Border regions and informal markets | Short term (≤ 2 years) |
| High import tariffs on next-gen biotechnology traits | -0.4% | Regional trade blocs | Long term (≥ 4 years) |
| Increasing water-stress episodes in semi-arid zones | -0.6% | Northern Argentina and Northeast Brazil | Long term (≥ 4 years) |
| Source: Mordor Intelligence | |||
Fragmented distribution networks in Andean markets
Mountainous topography drives significant logistics costs, undermining last-mile delivery of premium seeds. Smallholder farmers produce most of the region's vegetables, yet often cannot access cold-chain storage, compromising seed viability during transport. Varied phytosanitary rules across Peru, Ecuador, Bolivia, and Colombia add paperwork and delays. The challenge is acute for small seed packs, where handling costs exceed feasible price points, limiting category penetration in the South America vegetable seed market.
Counterfeit seed trade eroding brand trust
Unofficial channels account for a significant portion of sales in some border zones, diluting brand equity and discouraging growers from investing in certified hybrids. Sophisticated packaging fakes complicate enforcement, while regulatory budgets remain thin. Crop failures from counterfeit seeds often push farmers back to saved seed practices, chilling demand growth for proprietary genetics and constraining revenue streams in the South America vegetable seed market.
*Our forecasts treat driver/restraint impacts as directional, not additive. The impact forecasts reflect baseline growth, mix effects, and variable interactions.
Segment Analysis
By Breeding Technology: Hybrid Dominance Drives Premium Markets
By breeding technology, hybrids led with 72.10% of the South America vegetable seed market share in 2025, while Open Pollinated Varieties and Hybrid Derivatives are anticipated to grow at a 4.59% CAGR through 2031, underscoring the premium producers' place on uniformity, yield stability, and disease resistance. Plant Variety Protection frameworks under the International Union for the Protection of New Varieties of Plants (UPOV) incentivize continual innovation, allowing breeders to recoup investment through exclusive commercialization rights.
Looking ahead, open-pollinated varieties and hybrid derivatives will continue to serve organic and low-input niches, but rising export standards and biosecurity mandates will accelerate hybrid uptake. Intellectual property compliance and expanding digital agronomy support are anticipated to sustain the dominance of hybrids within the South America vegetable seed market well into the forecast horizon.


By Cultivation Mechanism: Protected Systems Transform Production Economics
Open-field farming still represents 99.77% of planted area, yet protected cultivation exhibits the fastest 8.26% CAGR, signaling the market’s pivot toward intensive, resource-efficient production. Greenhouse crops command counter-seasonal price premiums, and government loan guarantees under Brazil’s Plano Safra have lowered the capital hurdle.
As weather volatility intensifies, growers seeking predictable output will prioritize protected environments, fueling demand for seed genetics optimized for high humidity and high nutrient regimes. This shift widens the addressable base of the South America vegetable seed market, even as traditional open-field acreage remains vast.
By Crop Family: Diversification Beyond Traditional Staples
Unclassified vegetables such as lettuce, asparagus, and okra held 45.05% of South America vegetable seed market size in 2025, advancing at a 5.21% CAGR on the back of healthier eating trends and culinary diversification. Solanaceae crops like tomatoes and peppers remain pillars of domestic meals and processed exports, while Brassicas retain a steady foothold in value-conscious segments.
Rising disposable incomes, functional-food awareness, and specialty retail formats are nudging growers to rotate into niche crops with superior margins. Breeders are responding with biofortified varieties rich in micronutrients, expanding both consumer appeal and the overall footprint of the South America vegetable seed market.
Geography Analysis
Brazil tops the regional growth chart with a 4.96% CAGR to 2031. Ample credit, robust research through the Brazilian Agricultural Research Corporation (EMBRAPA), and a structured market for carbon-positive farming augment the case for continual seed upgrades. Streamlined variety registration further curbs time to market, reinforcing Brazil’s leadership in the South America vegetable seed market.
Argentina follows with biotechnology depth and clear-cut trait approvals under CONABIA, ensuring swift access to advanced genetics. Export-oriented onion and garlic chains provide a reliable demand for hybrid lines that enhance storage life and shipment quality. Investments in drip irrigation across Mendoza and San Juan bolster resilience, expanding the canvas for drought-tolerant seeds in the South America vegetable seed market.
The Rest of South America, including Peru, Ecuador, Colombia, Chile, and Uruguay, collectively retains a 45.12% share. Peru’s microclimates promote year-round production of specialty vegetables, Chile’s Mediterranean zone powers greenhouse exports, and Colombia’s high-altitude farms satisfy niche European demand. Varied regulatory climates compel seed firms to customize go-to-market playbooks, but harmonization talks hint at smoother cross-border flows over time, boding well for unified growth of the South America vegetable seed market.
Competitive Landscape
The top five firms, Bayer Crop Science, Syngenta, BASF, Rijk Zwaan, and Sakata, commanded a major share of revenue in 2024, enabling scale advantages in genomics, distribution, and technical support. Bayer’s new genomic hub in Brazil exemplifies the race to compress breeding cycles. Syngenta’s Fieldlab Seedshift partnership weds carbon farming with advanced genetics to heighten sustainability credentials.
BASF deepened its tropical genetics bench through a strategic tie-up with Agristar that opens northeastern Brazil’s market channels. Despite high concentration, white-space opportunities surface in organic, climate-resilient, and nutrition-dense segments where nimble regional breeders like East-West Seed and local subsidiaries of Groupe Limagrain can excel.
Digital agronomy platforms enable direct-to-farmer engagement, bypassing traditional retail bottlenecks and narrowing knowledge gaps. Rising patent filings, 200 in 2024 across Argentina, Brazil, and Chile, signal relentless innovation that will keep competition brisk in the South America vegetable seed market.
South America Vegetable Seed Industry Leaders
Bayer AG
Syngenta Group
Groupe Limagrain
BASF SE
Rijk Zwaan Zaadteelt en Zaadhandel BV
- *Disclaimer: Major Players sorted in no particular order

Recent Industry Developments
- July 2025: East-West Seed introduced 12 new hybrid vegetable varieties at Hortitec 2025 in Brazil. The hybrids are adapted to Brazilian agricultural and climate conditions, demonstrating the company's research and development capabilities in South America.
- February 2025: Sakata Seed Corporation established a subsidiary in Colombia to expand its operations in the South American vegetable seed market. This expansion improves local customer support, distribution networks, and provides Colombian farmers with access to region-specific vegetable varieties.
- January 2025: Syngenta Vegetable Seeds and Apricus Seeds signed a global licensing agreement in 2024 to commercialize Apricus’s tomato and pepper genetics. This includes strategic expansion into South America, enhancing access to high-performing vegetable hybrids for growers across the region.


South America Vegetable Seed Market Report Scope
Hybrids, Open Pollinated Varieties & Hybrid Derivatives are covered as segments by Breeding Technology. Open Field, Protected Cultivation are covered as segments by Cultivation Mechanism. Brassicas, Cucurbits, Roots & Bulbs, Solanaceae, Unclassified Vegetables are covered as segments by Crop Family. Argentina, Brazil are covered as segments by Country.Breeding Technology
| Hybrids |
| Open Pollinated Varieties and Hybrid Derivatives |
Cultivation Mechanism
| Open Field |
| Protected Cultivation |
Crop Family
| Brassicas | Cabbage |
| Cauliflower and Broccoli | |
| Other Brassicas | |
| Cucurbits | Cucumber and Gherkin |
| Pumpkin and Squash | |
| Other Cucurbits | |
| Roots and Bulbs | Garlic |
| Onion | |
| Potato | |
| Other Roots and Bulbs | |
| Solanaceae | Chilli |
| Eggplant | |
| Tomato | |
| Other Solanaceae | |
| Unclassified Vegetables | Asparagus |
| Lettuce | |
| Okra | |
| Peas | |
| Spinach | |
| Other Unclassified Vegetables |
Geography
| Argentina |
| Brazil |
| Rest of South America |
| Breeding Technology | Hybrids | |
| Open Pollinated Varieties and Hybrid Derivatives | ||
| Cultivation Mechanism | Open Field | |
| Protected Cultivation | ||
| Crop Family | Brassicas | Cabbage |
| Cauliflower and Broccoli | ||
| Other Brassicas | ||
| Cucurbits | Cucumber and Gherkin | |
| Pumpkin and Squash | ||
| Other Cucurbits | ||
| Roots and Bulbs | Garlic | |
| Onion | ||
| Potato | ||
| Other Roots and Bulbs | ||
| Solanaceae | Chilli | |
| Eggplant | ||
| Tomato | ||
| Other Solanaceae | ||
| Unclassified Vegetables | Asparagus | |
| Lettuce | ||
| Okra | ||
| Peas | ||
| Spinach | ||
| Other Unclassified Vegetables | ||
| Geography | Argentina | |
| Brazil | ||
| Rest of South America | ||


Market Definition
- Commercial Seed - For the purpose of this study, only commercial seeds have been included as part of the scope. Farm-saved Seeds, which are not commercially labeled are excluded from scope, even though a minor percentage of farm-saved seeds are exchanged commercially among farmers. The scope also excludes vegetatively reproduced crops and plant parts, which may be commercially sold in the market.
- Crop Acreage - While calculating the acreage under different crops, the Gross Cropped Area has been considered. Also known as Area Harvested, according to the Food & Agricultural Organization (FAO), this includes the total area cultivated under a particular crop across seasons.
- Seed Replacement Rate - Seed Replacement Rate is the percentage of area sown out of the total area of crop planted in the season by using certified/quality seeds other than the farm-saved seed.
- Protected Cultivation - The report defines protected cultivation as the process of growing crops in a controlled environment. This includes greenhouses, glasshouses, hydroponics, aeroponics, or any other cultivation system that protects the crop against any abiotic stress. However, cultivation in an open field using plastic mulch is excluded from this definition and is included under open field.
| Keyword | Definition |
|---|---|
| Row Crops | These are usually the field crops which include the different crop categories like grains & cereals, oilseeds, fiber crops like cotton, pulses, and forage crops. |
| Solanaceae | These are the family of flowering plants which includes tomato, chili, eggplants, and other crops. |
| Cucurbits | It represents a gourd family consisting of about 965 species in around 95 genera. The major crops considered for this study include Cucumber & Gherkin, Pumpkin and squash, and other crops. |
| Brassicas | It is a genus of plants in the cabbage and mustard family. It includes crops such as carrots, cabbage, cauliflower & broccoli. |
| Roots & Bulbs | The roots and bulbs segment includes onion, garlic, potato, and other crops. |
| Unclassified Vegetables | This segment in the report includes the crops which don’t belong to any of the above-mentioned categories. These include crops such as okra, asparagus, lettuce, peas, spinach, and others. |
| Hybrid Seed | It is the first generation of the seed produced by controlling cross-pollination and by combining two or more varieties, or species. |
| Transgenic Seed | It is a seed that is genetically modified to contain certain desirable input and/or output traits. |
| Non-Transgenic Seed | The seed produced through cross-pollination without any genetic modification. |
| Open-Pollinated Varieties & Hybrid Derivatives | Open-pollinated varieties produce seeds true to type as they cross-pollinate only with other plants of the same variety. |
| Other Solanaceae | The crops considered under other Solanaceae include bell peppers and other different peppers based on the locality of the respective countries. |
| Other Brassicaceae | The crops considered under other brassicas include radishes, turnips, Brussels sprouts, and kale. |
| Other Roots & Bulbs | The crops considered under other roots & bulbs include Sweet Potatoes and cassava. |
| Other Cucurbits | The crops considered under other cucurbits include gourds (bottle gourd, bitter gourd, ridge gourd, Snake gourd, and others). |
| Other Grains & Cereals | The crops considered under other grains & cereals include Barley, Buck Wheat, Canary Seed, Triticale, Oats, Millets, and Rye. |
| Other Fibre Crops | The crops considered under other fibers include Hemp, Jute, Agave fibers, Flax, Kenaf, Ramie, Abaca, Sisal, and Kapok. |
| Other Oilseeds | The crops considered under other oilseeds include Ground nut, Hempseed, Mustard seed, Castor seeds, safflower seeds, Sesame seeds, and Linseeds. |
| Other Forage Crops | The crops considered under other forages include Napier grass, Oat grass, White clover, Ryegrass, and Timothy. Other forage crops were considered based on the locality of the respective countries. |
| Pulses | Pigeon peas, Lentils, Broad and horse beans, Vetches, Chickpeas, Cowpeas, Lupins, and Bambara beans are the crops considered under pulses. |
| Other Unclassified Vegetables | The crops considered under other unclassified vegetables include Artichokes, Cassava Leaves, Leeks, Chicory, and String beans. |


Research Methodology
Mordor Intelligence follows a four-step methodology in all our reports.
- Step-1: IDENTIFY KEY VARIABLES: In order to build a robust forecasting methodology, the variables and factors identified in Step-1 are tested against available historical market numbers. Through an iterative process, the variables required for market forecast are set and the model is built on the basis of these variables.
- Step-2: Build a Market Model: Market-size estimations for the forecast years are in nominal terms. Inflation is not a part of the pricing, and the average selling price (ASP) is kept constant throughout the forecast period.
- Step-3: Validate and Finalize: In this important step, all market numbers, variables and analyst calls are validated through an extensive network of primary research experts from the market studied. The respondents are selected across levels and functions to generate a holistic picture of the market studied.
- Step-4: Research Outputs: Syndicated Reports, Custom Consulting Assignments, Databases, and Subscription Platforms


