Market Overview
| Study Period | 2018 - 2031 |
|---|---|
| Forecast Data Period | 2026 - 2031 |
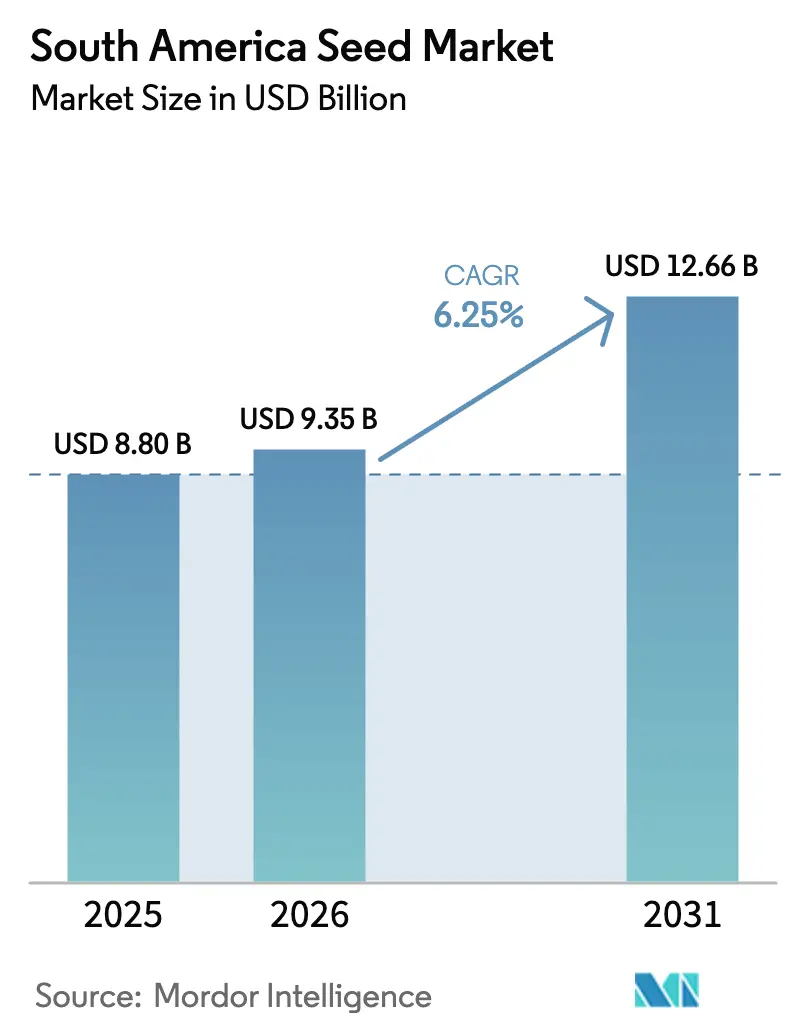
| Base Year Market Size (2025) | USD 8.8 Billion |
| Market Size (2026) | USD 9.35 Billion |
| Market Size (2031) | USD 12.66 Billion |
| Growth Rate (2026 - 2031) | 6.25% CAGR |
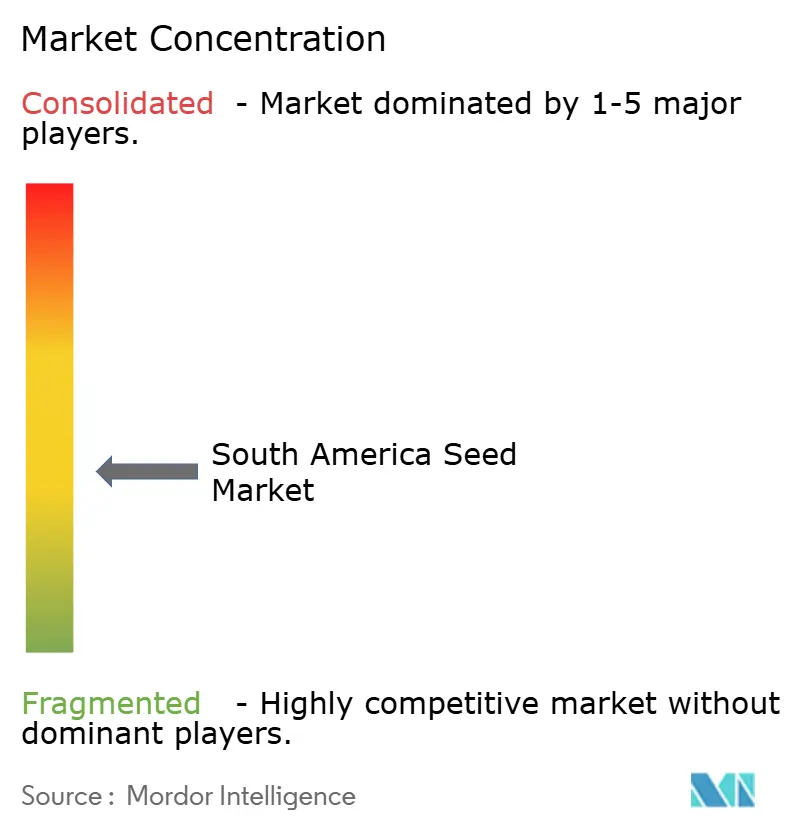
| Market Concentration | Medium |
Major Players *Disclaimer: Major Players sorted in no particular order Image © Mordor Intelligence. Reuse requires attribution under CC BY 4.0. | |
South America Seed Market Analysis by Mordor Intelligence
The South America seed market size was valued at USD 8.8 billion in 2025 and estimated to grow from USD 9.35 billion in 2026 to reach USD 12.66 billion by 2031, at a CAGR of 6.25% during the forecast period (2026-2031). Robust biotechnology pipelines, expanding arable land, and rising adoption of precision-agriculture platforms create a resilient growth runway. Brazilian regulations that fast-track trait approvals widen first-mover advantages for growers, while Argentine currency pressures and informal seed reuse temper overall momentum. Climate variability elevates demand for drought-tolerant cultivars, carbon-credit-linked seed technologies, and biological coatings that satisfy environmental, social, and governance (ESG) mandates. Digital ag-fintech models that bundle seed, credit, and agronomic services are lowering the working-capital barrier for smallholders. Competitive dynamics now reward players able to synchronize genetic innovation with regional regulatory nuances and data-driven service offerings.
Key Report Takeaways
- By breeding technology, hybrids held 81.35% of the South America seed market share in 2025 and are anticipated to grow at a 6.42% CAGR through 2031.
- By cultivation mechanism, open field accounted for 99.85% of the market share in 2025, while protected cultivation is forecast to post an 8.42% CAGR through 2031.
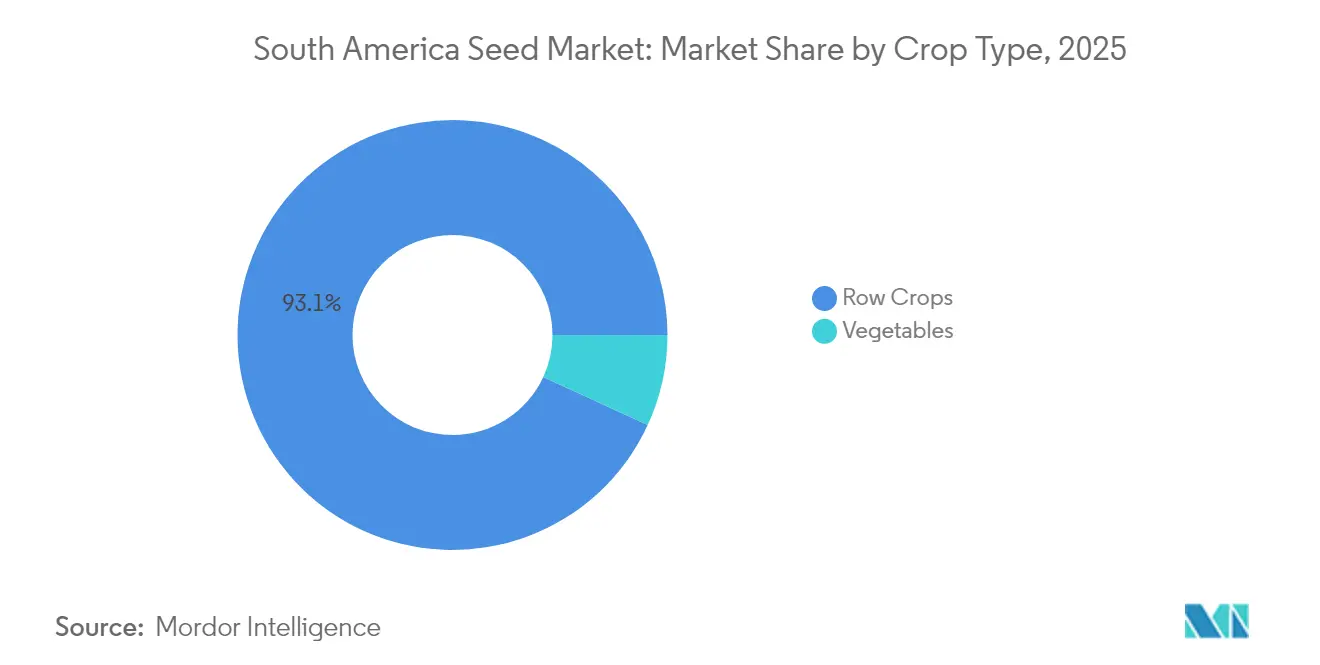
- By crop type, row crops accounted for 93.12% of the South America seed market size in 2025 and are projected to expand at a 6.33% CAGR to 2031.
- By country, Brazil led with 51.05% revenue share in 2025, and it is projected to grow at a 7.18% CAGR through 2031.
Note: Market size and forecast figures in this report are generated using Mordor Intelligence’s proprietary estimation framework, updated with the latest available data and insights as of 2026.
South America Seed Market Trends and Insights
Driver Impact Analysis*
| Driver | (~) % Impact on CAGR Forecast | Geographic Relevance | Impact Timeline |
|---|---|---|---|
| Widespread adoption of genetically modified herbicide-tolerant (GM-HT) soybean and corn traits | +1.2% | Brazil and Argentina with spillover to Paraguay | Medium term (2-4 years) |
| Expansion of drought-tolerant wheat and soybean pipelines | +0.8% | Argentina, southern Brazil, and Uruguay | Long term (≥ 4 years) |
| Government tax-credit programs for locally bred hybrids | +0.6% | Brazil nationwide, early uptake in Mato Grosso and Rio Grande do Sul | Short term (≤ 2 years) |
| Carbon-credit premiums for certified climate-smart seeds | +0.4% | Brazil and Argentina with global linkages | Medium term (2-4 years) |
| Growth of ag-fintech platforms bundling seed and credit | +0.5% | Brazil and Argentina expanding into Colombia and Chile | Short term (≤ 2 years) |
| Rising demand for biological seed coatings meeting ESG goals | +0.7% | Export-oriented regions | Medium term (2-4 years) |
| Source: Mordor Intelligence | |||
Widespread Adoption of GM-HT Soybean and Corn Traits
Intacta2 Xtend soybeans integrate glyphosate and dicamba tolerance with Bacillus thuringiensis (Bt) insect resistance, enabling Brazilian growers to cut pesticide sprays by 40% while sustaining yields above 3,500 kg per hectare.[1]Source: Bayer AG, “Intacta2 Xtend Soybeans Brazil,” Bayer.com Average technology fees of USD 25 per hectare remain profitable because stacked traits reduce weed-control labor and improve harvest predictability. Accelerated approvals by Brazil’s National Biosafety Technical Commission (CTNBio) sustain a steady pipeline of stacked traits, keeping premium seed pricing intact for the forecast horizon. Argentine growers mirror adoption despite currency headwinds because biotechnology offers a hedge against input inflation.
Expansion of Drought-Tolerant Wheat and Soybean Pipelines
Bioceres Crop Solutions’ HB4 wheat tolerates up to 45 days of water stress with less than 5% yield loss, opening previously marginal zones in Argentina and Brazil to commercial wheat cultivation. Soybean R&D focuses on maintaining pod fill during reproductive stages under moisture deficits, with trials showing 15% yield lifts over conventional checks. These traits also lower crop-insurance premiums and extend cropping frontiers, enlarging the addressable South America seed market base.
Government Tax-Credit Programs for Locally Bred Hybrids
Brazil’s Lei do Bem allows up to 200% R&D tax deductions, enabling domestic seed firms to grow corn hybrid market share from 15% to 28% since 2020.[2]Source: Brazilian Ministry of Agriculture, “Agricultural Research and Development Programs,” gov.br Locally bred lines outperform imports in acidic Cerrado soils owing to tailored aluminum-tolerance traits. Similar, though less generous, Argentine incentives support drought-tolerant wheat development, reducing reliance on imported genetics.
Carbon-Credit Premiums for Certified Climate-Smart Seeds
Climate-smart varieties that enhance soil carbon sequestration can earn Brazilian farmers USD 15–25 per hectare in additional revenue under emerging voluntary carbon markets. Certification protocols drive adoption of precision-ag hardware, elevating data granularity for both growers and seed suppliers. Seed developers now design varieties explicitly for higher carbon-credit scores, unlocking a second revenue stream alongside grain sales.
Restraints Impact Analysis*
| Restraint | (~) % Impact on CAGR Forecast | Geographic Relevance | Impact Timeline |
|---|---|---|---|
| Regulatory uncertainty around gene-edited crops | -0.9% | Argentina with spillover to Uruguay and Paraguay | Medium term (2-4 years) |
| Seed piracy and informal seed reuse in smallholder channels | -0.7% | Regional and concentrated in remote areas | Long term (≥ 4 years) |
| FX volatility raising imported parent-seed costs | -0.6% | Argentina with secondary impact in Brazil | Short term (≤ 2 years) |
| Climate-driven yield risk shifting cultivar preference | -0.5% | Southern Brazil, northern Argentina, and Uruguay | Medium term (2-4 years) |
| Source: Mordor Intelligence | |||
Regulatory Uncertainty Around Gene-Edited Crops
Argentina’s case-by-case approvals require expanded field trials and ecosystem impact studies, extending commercialization timelines by 24–36 months compared with Brazil. Seed firms delay R&D spending when regulatory clarity is lacking, slowing the introduction of traits such as Fusarium head blight resistance in wheat and enhanced protein content in soybeans, thereby constraining the South America seed market growth trajectory.
Seed Piracy and Informal Seed Reuse in Smallholder Channels
Informal systems account for as much as 35% of soybean seed use, translating to USD 800 million in lost annual revenues across the region. Yield penalties of 20% in second-generation hybrid seeds are often overlooked when cash-flow stress overrides long-term profitability. Limited enforcement and outreach exacerbate genetic drift, undermining cultivar performance and intellectual-property protection.
*Our forecasts treat driver/restraint impacts as directional, not additive. The impact forecasts reflect baseline growth, mix effects, and variable interactions.
Segment Analysis
By Breeding Technology: Hybrid Dominance Fueled by Trait Integration
Hybrid cultivars represented 81.35% of the South America seed market share in 2025. The segment is forecast to expand at a 6.42% CAGR through 2031 as stacked biotechnology traits raise return on seed investment. Transgenic hybrids that layer herbicide tolerance and insect resistance dominate corn and soybean pipelines. These hybrids cut insecticide applications by up to 60% and simplify weed control, reinforcing farmers willingness to pay technology fees. Non-transgenic hybrids preserve relevance for organic channels and markets with non-genetically modified organism (non-GMO) requirements. Hybrid vigor remains a compelling proposition, delivering consistent 20% yield outperformance versus open-pollinated varieties.
Hybrid momentum is strongest in Brazil, where faster trait approvals accelerate time-to-market for advanced genetics. In Argentina, hybrids face headwinds from weak foreign-exchange conditions but still benefit from proven agronomic benefits. Open-pollinated varieties retain niche demand among smallholders seeking low-cost seed and cultivars with culinary or cultural importance. Nonetheless, biotechnology-enabled hybrid pipelines will continue to pull farmer demand toward premium seed categories, lifting the South America seed market size for hybrids through the forecast window.


By Cultivation Mechanism: Protected Cultivation Gains Share
Open-field systems accounted for 99.85% of sales in 2025, yet protected cultivation is the fastest-growing niche at 8.42% CAGR to 2031. Greenhouse investments in southeastern Brazil and peri-urban Argentina enable year-round vegetable production. Specialty seed lines bred for determinate growth, disease resistance, and controlled-environment performance command prices that are three to four times higher than open-field equivalents.
Protected cultivation supports export-oriented supply chains that demand uniform quality and traceable production methods, further accelerating seed turnover cycles and boosting average selling prices. The capital-intensive nature of greenhouses attracts institutional investors and technology suppliers, creating a virtuous cycle of innovation and premium-seed demand that expands the South America seed market size for protected systems beyond traditional row-crop dynamics.
By Crop Type: Row Crops Anchor Regional Volume
By crop type, row crops accounted for 93.12% of the South America seed market size in 2025 and are projected to expand at a 6.33% CAGR to 2031. Soybeans remain the flagship crop in Brazil and Argentina, creating the scale economics that support continuous trait stacking. Corn follows, with hybrid adoption exceeding 95% across commercial acreage. Biotechnology traits in both crops are integral to no-till systems that dominate tropical and subtropical farming. Cotton benefits from bollworm-resistant and herbicide-tolerant traits that lower pesticide expenses while lifting lint quality. Forage crops and pulses expand more modestly but offer rotation benefits that enhance soil health, indirectly supporting demand for diversified seed portfolios. Vegetable seeds, though a smaller percentage of overall volume, command the highest value per kilogram, contributing disproportionately to revenue growth and margin expansion in the South America seed market.
Geography Analysis
Brazil held 51.05% of regional revenue in 2025 and is projected to register a 7.18% CAGR to 2031. Brazil’s influence stems from hectares of soybeans and corn that consume premium seed annually. Faster approvals by CTNBio shorten time-to-market for new traits, allowing Brazilian growers to adopt stacked technologies 18 months ahead of neighbors. Continued expansion into the MATOPIBA frontier could add to commercial agriculture by 2030, uplifting the South America seed market size even without major price increases. Investment in biological seed coatings aligns with Brazil’s ESG-oriented export buyers, reinforcing premium-seed demand.
Argentina contributes roughly one-third of regional wheat seed sales and remains vital for temperate soybean genetics. Peso depreciation, while raising input costs, simultaneously boosts export competitiveness, enabling seed companies to recapture margin through volume expansion. Regulatory caution on (Clustered Regularly Interspaced Short Palindromic Repeats) CRISPR traits slows innovation speed but maintains access to European Union markets that favor stringent biosafety protocols. Argentina’s strong public–private research network keeps it competitive despite funding constraints.
The Rest of South America delivers an impressive growth percentage from a smaller base. Paraguay’s double-cropping systems drive rapid soybean area gains, while Uruguay’s carbon-neutral beef ambitions spur demand for forage cultivars and cover-crop seed. Chile’s protected-cultivation sector needs high-value vegetable genetics suited to Mediterranean climates, and Colombia’s altitude variation demands tailored maize and potato seed. These diverse needs dilute single-country risk and collectively add incremental growth to the South America seed market.
Competitive Landscape
The top five companies, Bayer, Corteva, and others, control a modest share of sales, reflecting moderate concentration. Bayer integrates its Crop Science genetics and crop-protection chemistries to offer comprehensive packages that simplify farmer decisions. Corteva capitalizes on its Pioneer germplasm to maintain leadership in corn, recently acquiring Brevant Seeds’ remaining Brazilian assets to deepen distribution. Syngenta Group’s partnership with Bioceres injects drought-tolerant HB4 technology into its soybean portfolio, demonstrating the value of targeted collaborations.
Regional specialists such as Bioceres and large cooperatives continue to carve niches through localized breeding and tailored service.[3]Source: Bioceres Crop Solutions, “Annual Report Form 20-F,” sec.gov Biological seed-treatment companies like Novozymes partner with multinationals to embed microbes directly in seed supply chains, capturing ESG-driven premiums. Digital-platform entrants, including Traive, integrate financing and agronomy, building new moats around data ownership and service bundling.
White-space opportunities exist in gene-edited specialty crops, climate-smart cereal cultivars, and carbon-linked trait platforms. Firms that harmonize trait innovation with financial and digital services will outpace competitors relying solely on genetic differentiation. Mergers or strategic alliances focused on data, biologicals, and ESG verification appear likely as market participants vie for differentiated positioning in the South America seed market.
South America Seed Industry Leaders
Bayer AG
Corteva Agriscience
Syngenta Group
Advanta Seeds (UPL Limited)
Groupe Limagrain
- *Disclaimer: Major Players sorted in no particular order

Recent Industry Developments
- August 2025: BASF, Corteva, and M.S. Technologies have partnered to launch Brazil’s first nematode-resistant soybean, targeting root-knot nematodes that severely impact yields. The new trait combines Corteva’s Enlist E3 technology with BASF’s nematode resistance, offering farmers a powerful tool for sustainable soybean production.
- June 2024: Sakata Seed Corporation has established Sakata Colombia S.A.S. to strengthen its presence in South America’s vegetable seed market. The new entity will focus on expanding sales of key crops like tomato, onion, and pepper in Colombia, the region’s third-largest seed market.
- March 2024: KWS has sold its South American corn business to GDM as part of a strategic portfolio realignment. The move allows KWS to focus on core markets while GDM expands its presence in the region’s corn seed sector.


South America Seed Market Report Scope
Hybrids, Open Pollinated Varieties & Hybrid Derivatives are covered as segments by Breeding Technology. Open Field, Protected Cultivation are covered as segments by Cultivation Mechanism. Row Crops, Vegetables are covered as segments by Crop Type. Argentina, Brazil are covered as segments by Country.Breeding Technology
| Hybrids | Non-Transgenic Hybrids | |
| Transgenic Hybrids | Herbicide Tolerant Hybrids | |
| Insect Resistant Hybrids | ||
| Other Traits | ||
| Open Pollinated Varieties and Hybrid Derivatives | ||
Cultivation Mechanism
| Open Field |
| Protected Cultivation |
Crop Type
| Row Crops | Fiber Crops | Cotton |
| Other Fiber Crops | ||
| Forage Crops | Alfalfa | |
| Forage Corn | ||
| Forage Sorghum | ||
| Other Forage Crops | ||
| Grains and Cereals | Corn | |
| Rice | ||
| Sorghum | ||
| Wheat | ||
| Other Grains and Cereals | ||
| Oilseeds | Canola, Rapeseed and Mustard | |
| Soybean | ||
| Sunflower | ||
| Other Oilseeds | ||
| Pulses | Pulses | |
| Vegetables | Brassicas | Cabbage |
| Cauliflower and Broccoli | ||
| Other Brassicas | ||
| Cucurbits | Cucumber and Gherkin | |
| Pumpkin and Squash | ||
| Other Cucurbits | ||
| Roots and Bulbs | Garlic | |
| Onion | ||
| Potato | ||
| Other Roots and Bulbs | ||
| Solanaceae | Chilli | |
| Eggplant | ||
| Tomato | ||
| Other Solanaceae | ||
| Unclassified Vegetables | Asparagus | |
| Lettuce | ||
| Okra | ||
| Peas | ||
| Spinach | ||
| Other Unclassified Vegetables | ||
Country
| Argentina |
| Brazil |
| Rest of South America |
| Breeding Technology | Hybrids | Non-Transgenic Hybrids | |
| Transgenic Hybrids | Herbicide Tolerant Hybrids | ||
| Insect Resistant Hybrids | |||
| Other Traits | |||
| Open Pollinated Varieties and Hybrid Derivatives | |||
| Cultivation Mechanism | Open Field | ||
| Protected Cultivation | |||
| Crop Type | Row Crops | Fiber Crops | Cotton |
| Other Fiber Crops | |||
| Forage Crops | Alfalfa | ||
| Forage Corn | |||
| Forage Sorghum | |||
| Other Forage Crops | |||
| Grains and Cereals | Corn | ||
| Rice | |||
| Sorghum | |||
| Wheat | |||
| Other Grains and Cereals | |||
| Oilseeds | Canola, Rapeseed and Mustard | ||
| Soybean | |||
| Sunflower | |||
| Other Oilseeds | |||
| Pulses | Pulses | ||
| Vegetables | Brassicas | Cabbage | |
| Cauliflower and Broccoli | |||
| Other Brassicas | |||
| Cucurbits | Cucumber and Gherkin | ||
| Pumpkin and Squash | |||
| Other Cucurbits | |||
| Roots and Bulbs | Garlic | ||
| Onion | |||
| Potato | |||
| Other Roots and Bulbs | |||
| Solanaceae | Chilli | ||
| Eggplant | |||
| Tomato | |||
| Other Solanaceae | |||
| Unclassified Vegetables | Asparagus | ||
| Lettuce | |||
| Okra | |||
| Peas | |||
| Spinach | |||
| Other Unclassified Vegetables | |||
| Country | Argentina | ||
| Brazil | |||
| Rest of South America | |||


Market Definition
- Commercial Seed - For the purpose of this study, only commercial seeds have been included as part of the scope. Farm-saved Seeds, which are not commercially labeled are excluded from scope, even though a minor percentage of farm-saved seeds are exchanged commercially among farmers. The scope also excludes vegetatively reproduced crops and plant parts, which may be commercially sold in the market.
- Crop Acreage - While calculating the acreage under different crops, the Gross Cropped Area has been considered. Also known as Area Harvested, according to the Food & Agricultural Organization (FAO), this includes the total area cultivated under a particular crop across seasons.
- Seed Replacement Rate - Seed Replacement Rate is the percentage of area sown out of the total area of crop planted in the season by using certified/quality seeds other than the farm-saved seed.
- Protected Cultivation - The report defines protected cultivation as the process of growing crops in a controlled environment. This includes greenhouses, glasshouses, hydroponics, aeroponics, or any other cultivation system that protects the crop against any abiotic stress. However, cultivation in an open field using plastic mulch is excluded from this definition and is included under open field.
| Keyword | Definition |
|---|---|
| Row Crops | These are usually the field crops which include the different crop categories like grains & cereals, oilseeds, fiber crops like cotton, pulses, and forage crops. |
| Solanaceae | These are the family of flowering plants which includes tomato, chili, eggplants, and other crops. |
| Cucurbits | It represents a gourd family consisting of about 965 species in around 95 genera. The major crops considered for this study include Cucumber & Gherkin, Pumpkin and squash, and other crops. |
| Brassicas | It is a genus of plants in the cabbage and mustard family. It includes crops such as carrots, cabbage, cauliflower & broccoli. |
| Roots & Bulbs | The roots and bulbs segment includes onion, garlic, potato, and other crops. |
| Unclassified Vegetables | This segment in the report includes the crops which don’t belong to any of the above-mentioned categories. These include crops such as okra, asparagus, lettuce, peas, spinach, and others. |
| Hybrid Seed | It is the first generation of the seed produced by controlling cross-pollination and by combining two or more varieties, or species. |
| Transgenic Seed | It is a seed that is genetically modified to contain certain desirable input and/or output traits. |
| Non-Transgenic Seed | The seed produced through cross-pollination without any genetic modification. |
| Open-Pollinated Varieties & Hybrid Derivatives | Open-pollinated varieties produce seeds true to type as they cross-pollinate only with other plants of the same variety. |
| Other Solanaceae | The crops considered under other Solanaceae include bell peppers and other different peppers based on the locality of the respective countries. |
| Other Brassicaceae | The crops considered under other brassicas include radishes, turnips, Brussels sprouts, and kale. |
| Other Roots & Bulbs | The crops considered under other roots & bulbs include Sweet Potatoes and cassava. |
| Other Cucurbits | The crops considered under other cucurbits include gourds (bottle gourd, bitter gourd, ridge gourd, Snake gourd, and others). |
| Other Grains & Cereals | The crops considered under other grains & cereals include Barley, Buck Wheat, Canary Seed, Triticale, Oats, Millets, and Rye. |
| Other Fibre Crops | The crops considered under other fibers include Hemp, Jute, Agave fibers, Flax, Kenaf, Ramie, Abaca, Sisal, and Kapok. |
| Other Oilseeds | The crops considered under other oilseeds include Ground nut, Hempseed, Mustard seed, Castor seeds, safflower seeds, Sesame seeds, and Linseeds. |
| Other Forage Crops | The crops considered under other forages include Napier grass, Oat grass, White clover, Ryegrass, and Timothy. Other forage crops were considered based on the locality of the respective countries. |
| Pulses | Pigeon peas, Lentils, Broad and horse beans, Vetches, Chickpeas, Cowpeas, Lupins, and Bambara beans are the crops considered under pulses. |
| Other Unclassified Vegetables | The crops considered under other unclassified vegetables include Artichokes, Cassava Leaves, Leeks, Chicory, and String beans. |


Research Methodology
Mordor Intelligence follows a four-step methodology in all our reports.
- Step-1: IDENTIFY KEY VARIABLES: In order to build a robust forecasting methodology, the variables and factors identified in Step-1 are tested against available historical market numbers. Through an iterative process, the variables required for market forecast are set and the model is built on the basis of these variables.
- Step-2: Build a Market Model: Market-size estimations for the forecast years are in nominal terms. Inflation is not a part of the pricing, and the average selling price (ASP) is kept constant throughout the forecast period.
- Step-3: Validate and Finalize: In this important step, all market numbers, variables and analyst calls are validated through an extensive network of primary research experts from the market studied. The respondents are selected across levels and functions to generate a holistic picture of the market studied.
- Step-4: Research Outputs: Syndicated Reports, Custom Consulting Assignments, Databases, and Subscription Platforms


