
Market Overview
| Study Period | 2021 - 2031 |
|---|---|
| Forecast Data Period | 2026 - 2031 |
| Base Year Market Size (2025) | USD 2.81 Billion |
| Market Size (2026) | USD 3.09 Billion |
| Market Size (2031) | USD 4.92 Billion |
| Growth Rate (2026 - 2031) | 9.82 % |
| Market Concentration | Medium |
Major Players *Disclaimer: Major Players sorted in no particular order Image © Mordor Intelligence. Reuse requires attribution under CC BY 4.0. | |
South America Sports Drinks Market Analysis by Mordor Intelligence
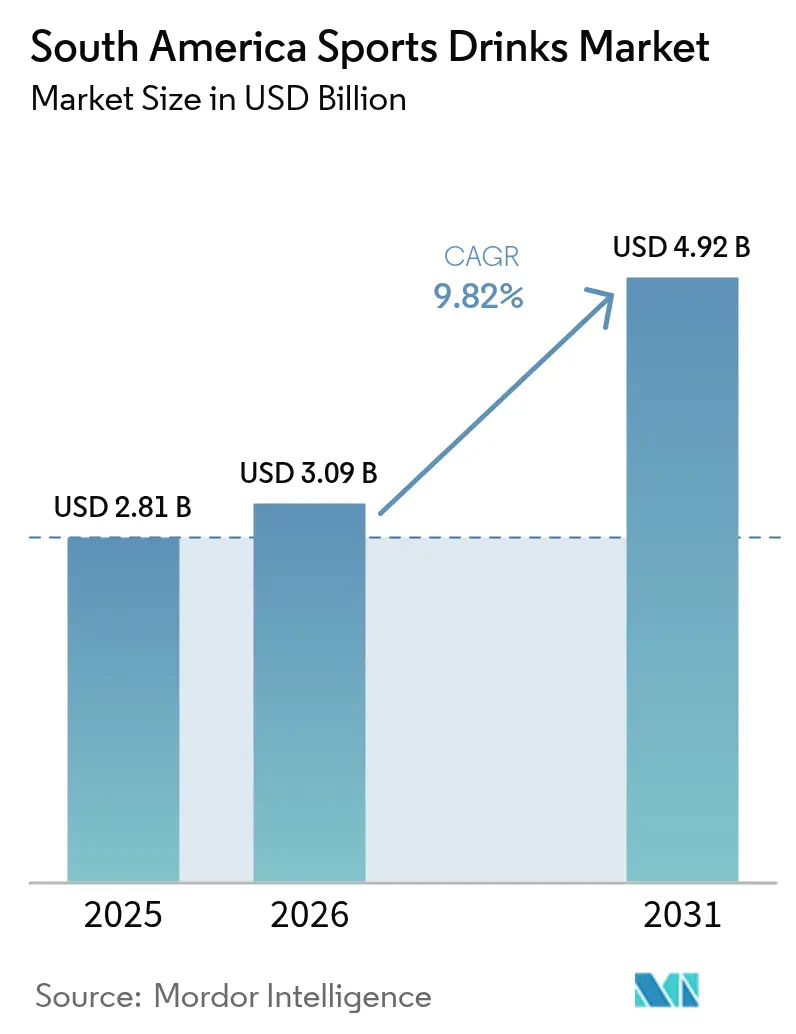
The South America sports drink market size is expected to grow from USD 2.81 billion in 2025 to USD 3.09 billion in 2026 and is forecast to reach USD 4.92 billion by 2031 at 9.82% CAGR over 2026-2031. This growth is driven by increasing awareness about fitness, evolving food regulations, and consistent sponsorship of regional sports events, which together create a favorable environment for revenue expansion. Leading global beverage companies are focusing on introducing localized flavors, reformulating products with clearer labeling, and leveraging digital marketing strategies to build brand loyalty, particularly among younger, tech-savvy consumers in South America. The market is also benefiting from the rising popularity of e-sports, greater participation in endurance races, and experimentation with premium ingredients, which are helping to diversify product offerings. However, stricter policies aimed at reducing sugar consumption are slowing down volume growth. At the same time, these policies are pushing brands to develop zero-sugar product variants, which typically have higher profit margins and are contributing to an increase in average selling prices.
Key Report Takeaways
- By product type, isotonic drinks held 83.65% of the South America sports drink market share in 2025; hypertonic/hypotonic drinks are projected to register the fastest CAGR at 10.12% to 2031.
- By packaging, PET bottles accounted for 75.82% of the South America sports drink market size in 2025; pouches and sachets are set to grow at a 10.03% CAGR through 2031.
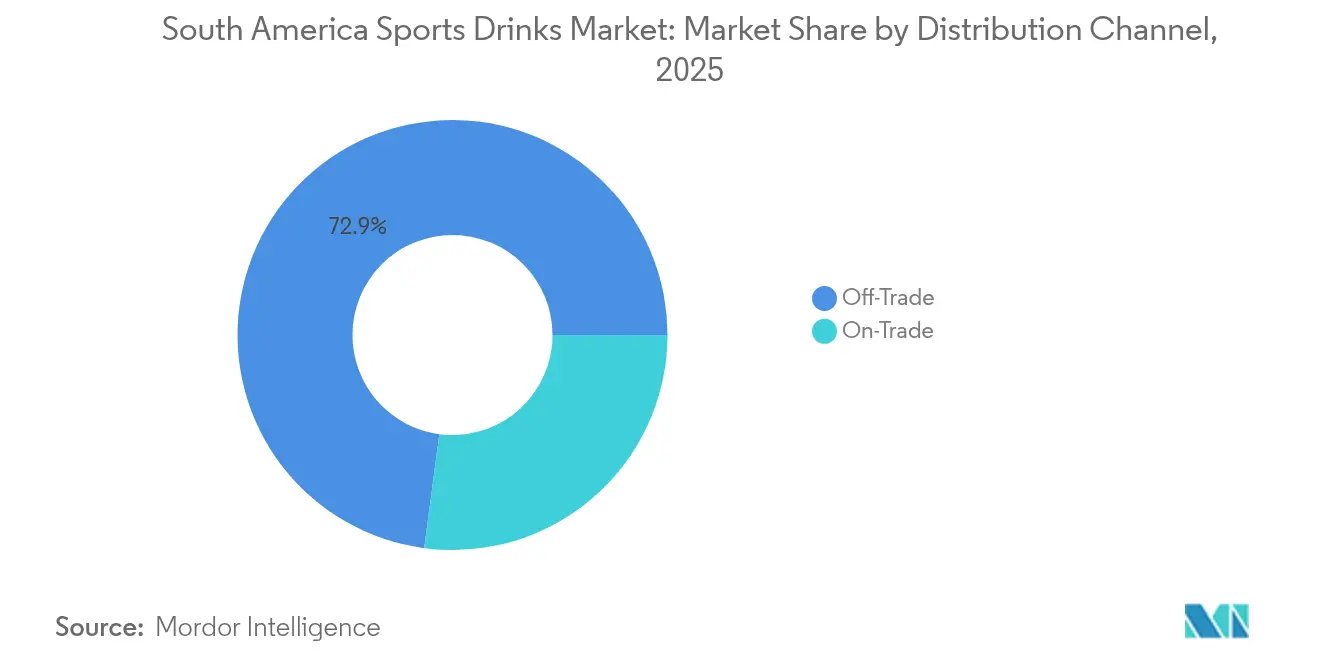
- By distribution channel, off-trade outlets captured 72.90% revenue in 2025, while on-trade is forecast to rise at a 10.09% CAGR.
- By geography, Brazil led with 29.05% revenue share in 2025; Argentina is expected to post a 10.59% CAGR through 2031.
Note: Market size and forecast figures in this report are generated using Mordor Intelligence’s proprietary estimation framework, updated with the latest available data and insights as of 2026.
Market Trends and Insights
Drivers Impact Table of South America Sports Drinks Market*
| DRIVER | (~) % IMPACT ON CAGR FORECAST | GEOGRAPHIC RELEVANCE | IMPACT TIMELINE |
|---|---|---|---|
| Adoption of sports drinks among gym-goers and fitness enthusiasts | +2.1% | Brazil, Argentina, Chile core markets | Medium term (2-4 years) |
| Rise in endurance event across the country | +1.8% | Regional, with concentration in urban centers | Long term (≥ 4 years) |
| Product innovation with functional additives | +1.5% | Early adoption in Brazil and Argentina | Short term (≤ 2 years) |
| Brand endorsements by sports celebrities fuel demand | +1.3% | Regional, strongest impact in Argentina and Brazil | Short term (≤ 2 years) |
| Demand for functional beverages | +0.9% | Urban markets across South America | Medium term (2-4 years) |
| Convenience and on-the-go consumption | +1.2% | Metropolitan areas, expanding to secondary cities | Medium term (2-4 years) |
| Source: Mordor Intelligence | |||
Adoption of sports drinks among gym-goers and fitness enthusiasts
The sports drinks market in South America is expanding due to the growing popularity of gym memberships and a stronger focus on fitness and health. For instance, in Brazil, over 54% of consumers are open to consuming more beverages if they are healthier and made with natural ingredients, as per the Kerry Group's Survey performed in 2024 [1]. This trend is driving the demand for sports drinks, especially those rich in electrolytes, like isotonic drinks. Additionally, fitness chains are expanding into smaller cities in countries such as Brazil and Argentina, introducing these products to new groups of consumers. Similar patterns are emerging in Chile and Colombia, where gym memberships are also on the rise. According to Health Club Management, in 2025, 78% of people living in major cities across Latin America are expected to exercise several times a month[2]. To take advantage of this growing trend, sports drink brands are collaborating with gym operators to secure exclusive product placements inside gyms, ensuring their drinks are easily accessible and visible to consumers during workouts.
Rise in endurance event across the country
The rising popularity of endurance events such as marathons, triathlons, and cycling festivals across South America is significantly contributing to the growth of the sports drinks market. According to Ahotu, as of 2025 to 2026, 16 cycling events are programmed in South America. These events, now staples on capital-city calendars, generate predictable surges in demand for carbohydrate- and electrolyte-rich hydration solutions. In Chile, government-led initiatives like “Crecer en Movimiento” aim to increase physical activity nationwide, indirectly fueling sports drink consumption. As athletes engage in months-long training regimens, they tend to purchase multi-pack formats, fostering consistent, repeat purchases rather than occasional trials. Brands capitalize on this by sponsoring race expos and bib collection events, where they distribute samples in performance-driven settings to enhance credibility. The seasonal concentration of events allows companies to streamline inventory and launch targeted advertising around high-visibility race routes, effectively creating a recurring marketing cycle that refreshes consumer interest every quarter.
Brand endorsements by sports celebrities fuel demand
Endorsements by top athletes play a significant role in driving the growth of the sports drinks market in South America, especially in regions where football is a dominant sport. For instance, in 2024, Lionel Messi introduced Más+, a clean-label sports drink free from caffeine and artificial sweeteners. This product gained popularity among health-conscious consumers who value transparency and functional benefits in their beverages. Similarly, Coca-Cola strengthened its presence in the market by partnering with CONMEBOL for the 2024 Copa América, announced in May 2024. This partnership prominently featured POWERADE during the tournament, reinforcing its image as a trusted hydration brand for athletes. These endorsements help connect everyday fitness enthusiasts with professional sports, creating aspirational connections with the brands. Among younger consumers, such as Gen Z and millennials, athlete-led promotions go beyond traditional advertisements. Social media campaigns and visible use of these products during matches make the endorsements feel more authentic and trustworthy.
Demand for functional beverages
Rising demand for functional beverages is driving the growth of the sports drink market in South America, as more health-conscious consumers look for drinks that provide additional benefits beyond hydration. Sports drinks that include electrolytes, vitamins, amino acids, or natural ingredients are becoming increasingly popular because they help with energy, endurance, and recovery. This trend is further supported by the region’s improving economic conditions. For instance, the International Monetary Fund (IMF) projects that by 2025, South America’s GDP at current prices (purchasing power parity) will reach 9.93 thousand billion international dollars, enabling more consumers to afford premium hydration products [3]. In countries like Chile and Colombia, the growing middle class is showing a preference for low-sugar, clean-label, and plant-based options, especially among gym enthusiasts and working professionals. Brands are introducing innovative products such as coconut water-based isotonic drinks and beverages infused with branched-chain amino acids (BCAAs), blending wellness with performance to cater to evolving consumer needs.
Restraints Impact Analysis of South America Sports Drinks Market*
| RESTRAINT | (~) % IMPACT ON CAGR FORECAST | GEOGRAPHIC RELEVANCE | IMPACT TIMELINE |
|---|---|---|---|
| Rising concerns over adulteration and mislabeling in the market | -1.4% | Regional, strongest impact in Argentina and Brazil | Short term (≤ 2 years) |
| Stringent regulations shape industry standards | -1.1% | MERCOSUR countries, expanding regionally | Medium term (2-4 years) |
| Health concerns over sugar and artificial ingredients | -1.7% | Urban markets across South America | Long term (≥ 4 years) |
| Rising competition from alternatives | -0.8% | Metropolitan areas, expanding to secondary cities | Medium term (2-4 years) |
| Source: Mordor Intelligence | |||
Rising concerns over adulteration and mislabeling in the market
Concerns about product adulteration and mislabeling are becoming major challenges for the sports drinks market in South America. Regulatory authorities, such as INAL (Instituto Nacional de Alimentos) in Argentina, have increased their monitoring efforts after cases of incorrect nutrient labeling and undisclosed additives came to light. For instance, Argentina’s Law 27.642, which came into effect in 2023, mandates that products exceeding specific limits of sugar, sodium, or saturated fats must display clear black octagonal warning labels on the front of their packaging. This law aims to make nutritional information more transparent to consumers. As a result, manufacturers now face higher costs due to stricter requirements for laboratory testing, ingredient tracking, and digital transparency measures. These added expenses are particularly challenging for smaller or local producers. On the other hand, larger multinational companies benefit from their established quality control systems and certifications, which help them comply more easily.
Health concerns over sugar and artificial ingredients
Concerns about sugar content and artificial ingredients are becoming a major challenge for the sports drinks market in South America. Many consumers are now more cautious about their health and are reducing their intake of sugary beverages. For instance, in Brazil, a survey by Kerry Group revealed that nearly half of the respondents (49%) plan to cut back on sugary drinks but are willing to try healthier alternatives if they taste good [4]. This growing awareness, along with discussions about implementing sugar taxes in countries like Mexico, Chile, and Brazil, is pushing companies to reformulate their products. To address these concerns, manufacturers are turning to natural sweeteners like stevia and monk fruit, as well as creating low-calorie sports drinks. However, these changes come with challenges, such as maintaining the desired taste and ensuring product stability, which increases production and research costs. Brands that can successfully balance great taste with lower sugar content are likely to perform better as governments introduce stricter regulations and consumers pay closer attention to ingredient labels.
*Our forecasts treat driver/restraint impacts as directional, not additive. The impact forecasts reflect baseline growth, mix effects, and variable interactions.
South America Sports Drinks Market Segment Analysis
By Product Type:
Isotonic Dominance Faces Functional DisruptionIn 2025, isotonic drinks claimed an 83.65% share of the South American sports drink market, reinforcing their status as the leading and most trusted choice for hydration. Their efficacy in replacing electrolytes appeals to a diverse audience, spanning from casual fitness buffs to elite athletes. The established benefits of isotonic formulations foster robust brand loyalty and a prominent retail presence, positioning them as the primary choice for many consumers in the category.
Yet, the segment witnessing the swiftest growth is the hypertonic and hypotonic drinks, anticipated to surge at a 10.12% CAGR by 2031. Athletes are gravitating towards these specialized options, seeking more customized hydration solutions. Seizing this momentum, premium brands are rolling out high-value products enriched with functional benefits like botanical extracts and amino acids. This strategy not only caters to specific performance demands but also bolsters revenue through smaller, high-margin offerings. With a rising emphasis on clean and effective sports nutrition, brands are broadening their horizons, moving beyond traditional isotonic offerings to diversify and elevate their product portfolios.


By Packaging Type:
PET Bottles Lead Amid Sustainability PressuresIn 2025, PET bottles clinched a commanding 75.82% share of the South American sports drink market. Their dominance stems from affordability, efficient production, and seamless integration with cold-chain logistics. The 500 ml PET format, widely embraced for its convenience, continues to be a staple in retail. Yet, manufacturers face hurdles with new MERCOSUR regulations pushing for greater recycled material usage. This shift demands innovation to ensure durability and safety, especially for carbonated drinks, all while meeting sustainability targets.
Aluminum cans, holding a 5.15% market share in 2025, are rapidly ascending as the packaging segment with the swiftest growth. Their allure lies in full recyclability, freshness preservation, and a premium shelf presence, resonating with urban and eco-aware consumers. As the appetite for sustainable, high-quality packaging swells, cans are now favored for both single-serve and multi-pack offerings. Adapting to shifting consumption trends, brands are broadening their packaging horizons to incorporate cans alongside PET, striking a balance between diverse consumer preferences and a commitment to premium, eco-friendly branding.
By Distribution Channel:
Off-Trade Dominance Challenged by Convenience EvolutionIn 2025, off-trade channels dominated South America's sports drink market, capturing 72.90% of the revenue. Supermarkets, hypermarkets, and convenience stores play a pivotal role, offering wide availability, attractive pricing, and high-volume promotions, especially during major events like football tournaments. By cross-merchandising with complementary products like snacks, these retailers enhance visibility and spur impulse purchases. Larger PET bottles, favored for their cost efficiency and convenience, dominate this channel, making it the go-to for families and bulk buyers.
On the other hand, the on-trade segment, which includes hotels, restaurants, cafés, and the broader foodservice sector, is set to expand at a 10.09% CAGR through 2031. This growth is fueled by urbanization, an uptick in dining out, and the premium placement of sports drinks on menus or as grab-and-go items in cafés and quick-service restaurants. On-trade venues cater to consumers seeking immediate refreshment during social outings, after meals, or during leisure activities. Here, the preference leans towards chilled cans and sleek pouches, prized for their freshness, portability, and premium feel. Moreover, foodservice outlets offer brands marketing perks like exclusive placements, flavor sampling, and co-branding, making this channel vital for brand equity and launching new products.
Geography Analysis
Brazil Sports Drinks Market
Brazil retained 29.05% revenue share in 2025, powered by a 215 million-strong population, entrenched football culture, and a modern retail footprint extending into mid-tier cities. The Ministry of Sports estimates that sporting activities contribute USD 35.2 billion annually to national GDP, underlining a broad consumer base willing to pay for performance beverages. Fitness chain expansion into the northeast and centre-west ensures new points of sale beyond traditional Rio and São Paulo cores, widening the funnel for brand activation. The South America sports drink market finds its highest SKU proliferation in Brazilian outlets, from mainstream isotonic bottles to boutique plant-based electrolyte shots.
Argentina Sports Drinks Market
Argentina represents the fastest development arc with a forecast 10.59% CAGR through 2031. Revised front-of-pack rules enacted in 2024 mandate black octagonal seals on high-sugar products, nudging reformulation toward monk fruit and stevia alternatives. Economic volatility favours local bottling to mitigate import costs, prompting multinationals to co-pack with domestic fillers. Football’s cultural dominance offers recurring promotional peaks, amplified recently by Lionel Messi’s proprietary brand roll-out.
South America Sports Drinks Market
Chile, Colombia, and Peru collectively underline a second tier of opportunity where urbanisation, rising disposable income, and wellness programmes converge. Chile’s “Crecer en Movimiento” initiative channels public funds into youth athletics, cultivating early-stage brand affinity. Colombia’s cycle-centric cities of Bogotá and Medellín stage mass sport events that drive training-related beverage demand. Peru’s tourism-fuelled trail-running scene offers seasonal volume lifts in the Andes region.
Regulatory Landscape
Sports drinks across South America operate under a tightening food safety and nutrition-labeling framework that affects both formulation and how brands communicate pack claims. In Brazil, ANVISA regulates foods and athlete-oriented products, and the September 2024 introduction of RDC 843/2024 alongside Normative Instruction IN 281/2024 clarified regulatory pathways and classification steps that determine whether a product requires marketing authorization, notification, or local health authority communication.
Front-of-pack warning regimes are a key compliance driver. Chile applies Law No. 20.606 (the "ALTO EN" octagonal seals) for products exceeding thresholds for sugars, sodium, saturated fats, and calories, pushing brands to adjust sweetness systems and serving sizes to manage on-pack warnings. In Argentina, oversight bodies such as SENASA and food authorities have increased monitoring for labeling accuracy and ingredient disclosure, strengthening the need for higher QA documentation and traceability to reduce mislabeling risks.
Value Chain Analysis
The sports drinks value chain in South America begins with inputs such as water, sweeteners, acids, flavors, electrolytes, functional additives, and packaging (especially PET preforms and aluminum cans), followed by blending, bottling/canning, secondary packaging, warehousing, and distribution into off-trade and on-trade channels. A notable structural feature is reliance on imported aluminum cans and some chemical and functional concentrates, which increases exposure to freight volatility and customs lead times, while PET-heavy portfolios benefit from more localized conversion capacity.
Bottling partners and regional production footprints are central to scaling and route-to-market execution. Coca-Cola Femsa expanded capacity with additional bottling lines across Brazil and other Latin American operations during 2023-2025, and that also points to the need to broaden distribution capacity for chilled, high-turn beverage categories. Distribution performance faces constraints linked to Brazil logistics bottlenecks, with ports such as Santos and Rio de Janeiro cited as pressure points, and 2024 port delays adding material costs for shippers. Companies are responding by adding inland logistics capacity, including PepsiCo's Colonia, Uruguay hub (supplying multiple markets and brands) and Baly's announced logistics support center acquisition in Tubarao, Santa Catarina (September 2025), which can shorten replenishment cycles and help buffer inventory risk.
Competitive Landscape
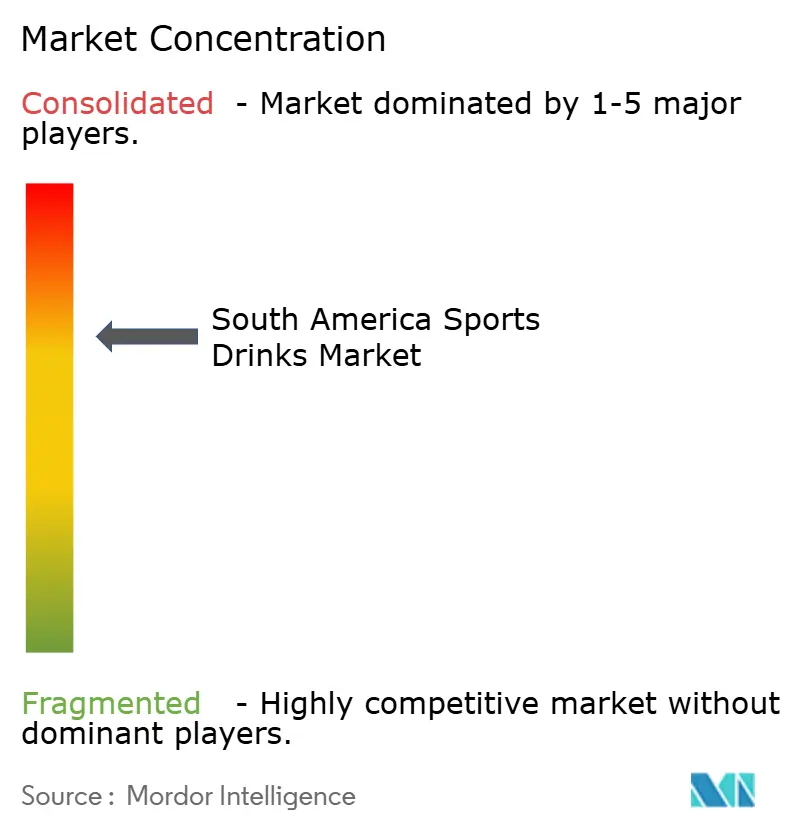
The South American sports drink market maintains a moderate concentration level, with major multinational companies and their regional subsidiaries holding significant market positions. PepsiCo's Gatorade leverages its established brand history, extensive production network across multiple countries, and sports club sponsorships to secure prominent retail placement. Coca-Cola's POWERADE utilizes joint bottling agreements to ensure broad distribution through convenience stores and vending machines.
Technology integration has emerged as a competitive advantage in the market. Major brands now offer mobile applications that deliver personalized hydration guidance based on workout data, integrating beverages into digital wellness platforms. The market is showing an increasing focus on packaging development, including augmented-reality labels that provide workout instructions through mobile scanning.
Local manufacturers are gaining market share by developing products tailored to regional preferences and utilizing established distribution networks. These companies compete through competitive pricing strategies and by offering unique flavor profiles that appeal to local tastes. Additionally, they maintain strong relationships with regional retailers and distributors, enabling them to effectively challenge the market position of multinational brands in specific geographic areas.
South America Sports Drinks Industry Leaders
-
PepsiCo Inc.
-
The Coca-Cola Company
-
AJE Group
-
Grupo Petrópolis
-
Electrolit USA
- *Disclaimer: Major Players sorted in no particular order
South America Sports Drinks Market Companies Covered in this Report
- PepsiCo Inc.
- The Coca-Cola Company
- AJE Group
- Grupo Petropolis
- Electrolit USA
- Genomma Lab Internacional
- Nitrix Brasil Ltda
- Positive Company Group
- A-Game Hydration Beverage, Inc.
- Prime Hydration LLC
- Mas+ Next Generation Beverage Co.
- The Kraft Heinz Company
- Agua Nuestra
- Four Sport
- Refrescos del Centro SA
- Fabrica de Licores y Alcoholes de Antioquia
- D1 S.A.S
- ProScience (Sports & Science Lab SAS)
- Kent Precision Foods Group, Inc.
- Global Quality Foods (GuaraMEGA)
Market Opportunities and Future Outlook
Product opportunity is being shaped by regulatory and consumer pressure to reduce sugar while maintaining performance cues such as electrolytes, recovery positioning, and clean-label claims. Argentina's front-of-pack warning framework (Law 27.642) and Chile's "ALTO EN" seals (Law 20.606) make reformulation and clearer labeling a practical lever for differentiation, supporting growth of zero-sugar and lower-sugar lines and expanding whitespace for functional additives that do not trigger warning thresholds.
Operational and route-to-market investment is also widening the base for brand expansion in Brazil and select neighboring markets. In May 2026, Solar Coca-Cola inaugurated a new PET bottle production line in Varzea Grande as part of a broader regional investment plan, improving packaging availability and throughput for high-volume formats that dominate sports drinks in retail. Separately, Coca-Cola Brasil disclosed a Brazil investment plan through 2030 that includes industrial footprint expansion and distribution centers, and RFK (Refriko) announced a large automated factory investment in Parana. These moves increase localized manufacturing and logistics capability, which can support faster SKU rollout (including localized flavors and smaller on-the-go formats) and reduce dependence on congested port flows for both packaging and finished goods movement.
Recent Industry Developments in South America Sports Drinks Market
- June 2026: Grupo Petropolis expanded distribution for TNT Sport Drink and committed to sponsoring more than 60 running race stages across over 10 Brazilian states during 2026. The program ties sell-in to a dense calendar of endurance events, improving brand visibility in performance settings while expanding cold availability beyond core metros.
- March 2025: Plezi Nutrition introduced Plezi Hydration, positioning it as a lower-sugar and lower-sodium alternative to conventional sports beverages in three flavors. The launch reinforces competitive pressure on incumbents to reformulate and sharpen nutrition-led messaging as warning-label and sugar-reduction scrutiny rises across the region.
- June 2024: Coca-Cola's POWERADE became an Official Worldwide Partner of the 2024 Copa America, securing tournament visibility and in-venue activation. The sponsorship strengthened the brand's elite-sport association in South America and supported high-velocity placement in modern retail and convenience tied to event-led demand spikes.
South America Sports Drinks Market Report Scope and Research Methodology
Market Definition and Coverage
For this study, the market is defined as the value of sports drinks sold for hydration and electrolyte replenishment across South America, covering products sold through both off-trade retail and on-trade outlets, and measured in USD.
Scope exclusions: We exclude energy drinks, caffeinated stimulant beverages, and other functional beverages that are not positioned or sold as sports drinks.
Segments Covered in This Report
- By Product Type
- Isotonic
- Hypertonic/Hypotonic
- By Packaging Type
- PET Bottles
- Cans
- Others
- By Distribution Channel
- On-trade
- Off-Trade
- Supermarkets/Hypermarkets
- Pharmacy/Health Stores
- Online Retail Stores
- Other Distribution Channels
- By Geography
- Brazil
- Argentina
- Chile
- Colombia
- Peru
- Rest of South America
Data Sources, Market Sizing, and Validation
Desk Research
Desk work started with building a country-level demand map for sports drinks across South America, where we relied on public statistics and category definitions to keep terms consistent across countries. We used national statistics offices for sales and consumption context, UN Comtrade trade flows for relevant beverage codes, and FAO food balance style data where applicable. For regulatory guardrails, we also referenced public health and nutrition agencies that publish sugar and labeling policy updates.
Next, we filled in the commercial context using company annual reports and investor presentations, plus product and pricing checks from major retailers. We also used reputable press coverage to understand distribution and promotion activity. Where public numbers were missing or not current enough, we used paid databases for company financials and news, and we cross-checked border movements using an import/export shipment-level database for packaged beverages. These desk sources are illustrative and not exhaustive, and many additional public references were reviewed for data collection, validation, and clarification.
Primary Interviews and Surveys
Our South America interviews and surveys cover CXOs, functional leaders, and managers at manufacturers, distributors, retailers, and sports-focused channels. Their input helps test secondary sales signals, fill gaps in pack prices and channel mix, and challenge country assumptions before the model is finalized. We re-contact respondents when answers conflict materially.
Distribution of primary research fieldwork respondents
| Company type | Respondent position |
|---|---|
| Top tier: 28% | CXOs: 18% |
| Mid tier: 47% | Functional/Unit leaders: 30% |
| Smaller Players: 25% | Managers: 52% |
Market-Sizing & Forecasting
Sizing was built using top-down and bottom-up logic. The main total was reconstructed from country-level consumption pools and the channel mix, then checked against supply-side signals. We started from the non-alcoholic beverage universe in each country and applied category penetration and spend patterns for sports drinks, then adjusted using on-trade versus off-trade splits.
Key inputs used in the model included sports participation and fitness engagement signals, urbanization and income trends, price per liter by pack format, sugar reformulation and labeling policy timelines, and retail channel expansion, especially convenience and online. Where a variable was noisy in a smaller country, we used proxy indicators and normalized the results using regional per-capita consumption ranges agreed during expert calls.
Forecasts were produced using scenario analysis supported by short time-series smoothing on price and volume drivers. Assumptions were aligned to expected inflation and trading-down behavior in packaged beverages. Bottom-up checks were applied through sampled SKU price points multiplied by estimated volumes by channel, plus selective roll-ups of reported beverage revenues. Totals were adjusted when the two views did not reconcile within a reasonable range.
Data Validation & Update Cycle
Outputs were validated through multiple passes that look for logical breaks by country, channel, and price tier, then re-checked against independent signals such as trade movements, shelf pricing, and category growth reported in public filings. When a country shows an unusual jump, we re-open assumptions behind pack mix, exchange-rate timing, and on-trade recovery. If variance cannot be explained, we re-contact experts.
Before sign-off, another analyst reviews the model to confirm formulas, unit conversions, and that the same inclusion rules were applied across countries. The report is refreshed annually, and interim updates are made when major regulatory or macro events shift pricing or demand materially. A final pre-delivery review is done so clients receive the latest updated view.
Mordor Intelligence's South America Sports Drink Market Size Measured Against Other Published Estimates
Published market sizes for sports drinks in South America can differ because groups do not always count the same products, years, or channel coverage, and currency timing can change the final USD value. Differences also show up when one estimate relies more on broad beverage growth assumptions instead of tracking category-specific pricing and pack mix.
The main gap comes from whether adjacent functional beverages are blended into the sports drink total and how on-trade value is treated. Mordor Intelligence counts only sports drinks sold through defined on-trade and off-trade channels and avoids mixing in energy drinks or wider functional beverage revenue. Base-year choice also matters, since some studies anchor to 2023 while others use 2025, and those years saw different inflation and exchange rate effects in key countries.
Benchmark comparison
| Source | Market Size | Gaps in Research Methodology |
|---|---|---|
| Mordor Intelligence | USD 2.81 B (2025) | |
| Regional Consultancy A | USD 1.22 B (2023) | Uses an earlier base year and a narrower value build that can understate recent price-per-liter inflation and channel expansion, and the coverage approach may differ on whether on-trade and newer online channels are fully counted. |
| Industry Publisher B | USD 2.60 B (2025) | Uses a broader Latin America scope and a wider product definition that can blend electrolyte drinks and adjacent categories, which can shift the total when compared against a South America-only, sports drink-only view. |
Across the three figures, the spread is mostly explained by scope alignment and year selection, rather than a single arithmetic issue. By keeping the demand pool tied to country consumption, pack-level pricing, and channel mix, the estimate stays repeatable and easier to audit when assumptions are challenged.
Key Questions Answered in the Report
What is the current value of the South America sports drink market?
The South America sports drink market stands at USD 3.09 billion in 2026 and is projected to reach USD 4.92 billion by 2031.
Which country leads the region in sales?
Brazil commands the largest share at 29.05% of 2025 revenue.
What segment of products dominates the category?
Isotonic formulations held an 83.65% share in 2025, far outweighing hypertonic and hypotonic drinks.
Which distribution channel is expanding the fastest?
On-trade venues such as gyms, stadium kiosks and vending machines are forecast to grow at a 10.09% CAGR through 2031.