Market Overview
| Study Period | 2021 - 2031 |
|---|---|
| Forecast Data Period | 2026 - 2031 |
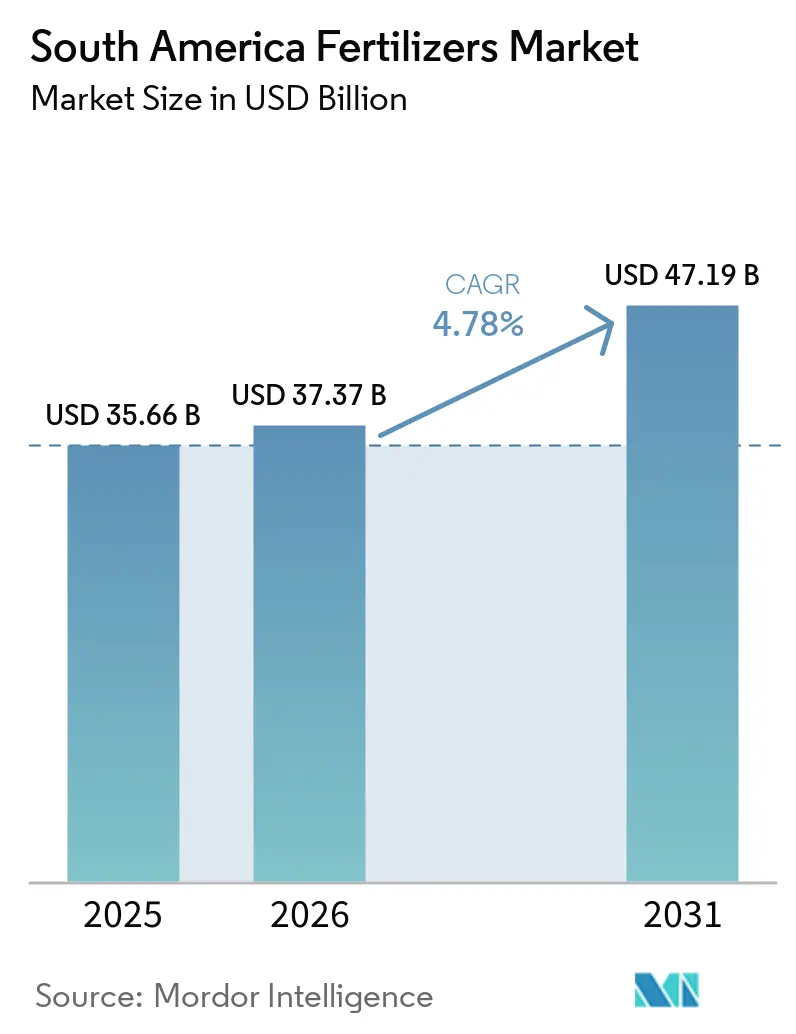
| Base Year Market Size (2025) | USD 35.66 Billion |
| Market Size (2026) | USD 37.37 Billion |
| Market Size (2031) | USD 47.19 Billion |
| Growth Rate (2026 - 2031) | 4.78% CAGR |
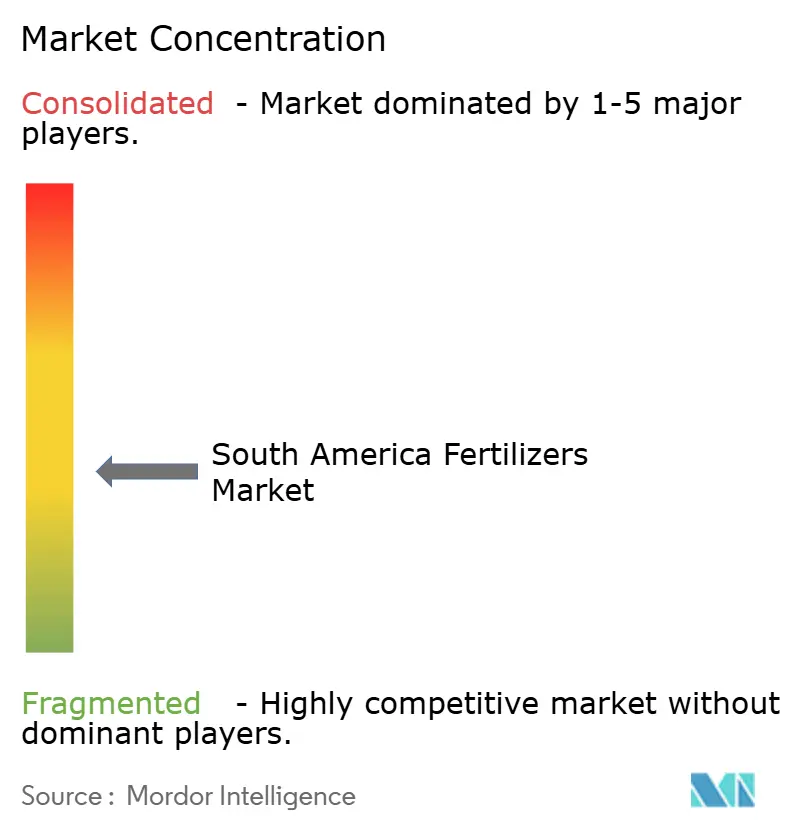
| Market Concentration | Medium |
Major Players*Disclaimer: Major Players sorted in no particular order Image © Mordor Intelligence. Reuse requires attribution under CC BY 4.0. | |
South America Fertilizers Market Analysis by Mordor Intelligence
The South America fertilizers market size was valued at USD 35.66 billion in 2025 and estimated to grow from USD 37.37 billion in 2026 to reach USD 47.19 billion by 2031, at a CAGR of 4.78% during the forecast period (2026-2031). A pivot toward domestic nutrient production in Brazil, rapid irrigation buildouts, and growing adoption of precision farming are reshaping cost structures and application patterns. Complex NPK blends that supply multiple nutrients in a single pass are gaining favor as labor and diesel costs rise in remote production belts. Specialty formulations such as controlled-release urea and fully water-soluble crystals are expanding fastest, aided by drip- and pivot-fed fertigation systems that cut nutrient losses. At the same time, logistics bottlenecks at Santos, Paranaguá, and through the Panama Canal continue to raise working-capital needs for import-dependent distributors, pushing policy makers to accelerate green-ammonia and domestic potash projects.
Key Report Takeaways
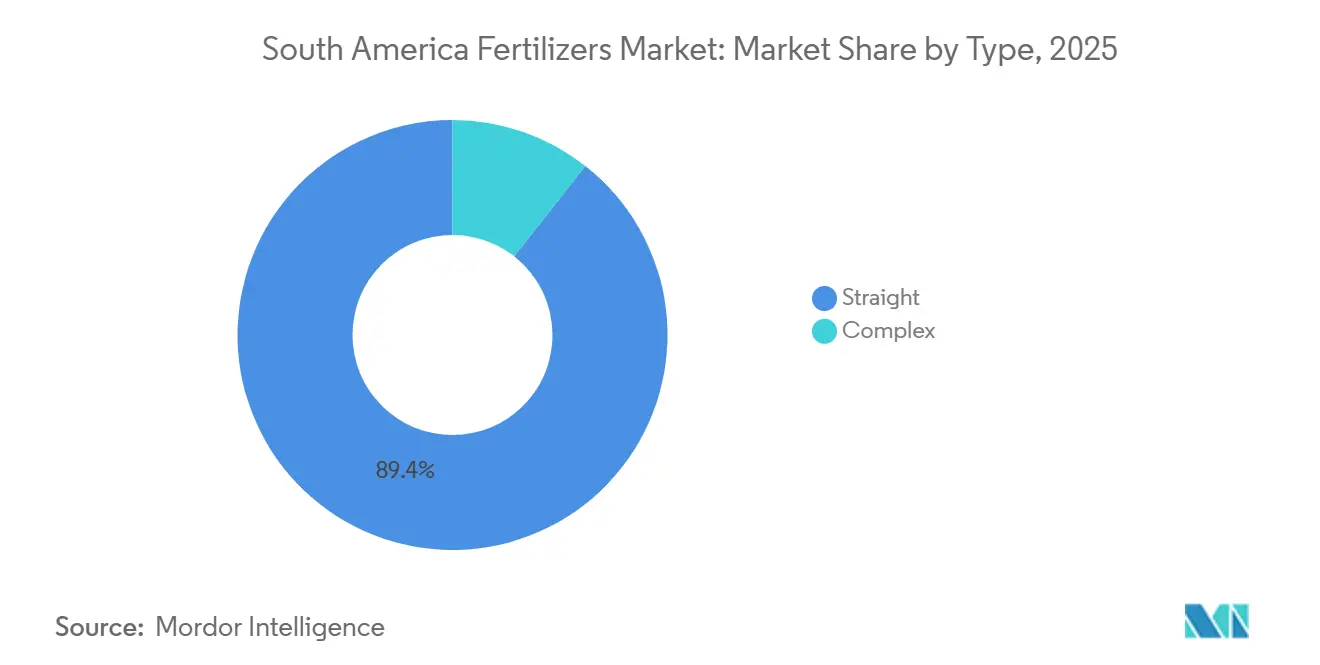
- By Type, Straight was the largest segment, accounting for 89.4% of the South America fertilizers market share in 2025, while complex is the fastest-growing segment, advancing at an 7.8% CAGR through 2031.
- By form, conventional fertilizers were the largest segment, accounting for 92.8% of the South America fertilizers market size in 2025, while specialty is the fastest-growing segment, advancing at a 6.0% CAGR through 2031.
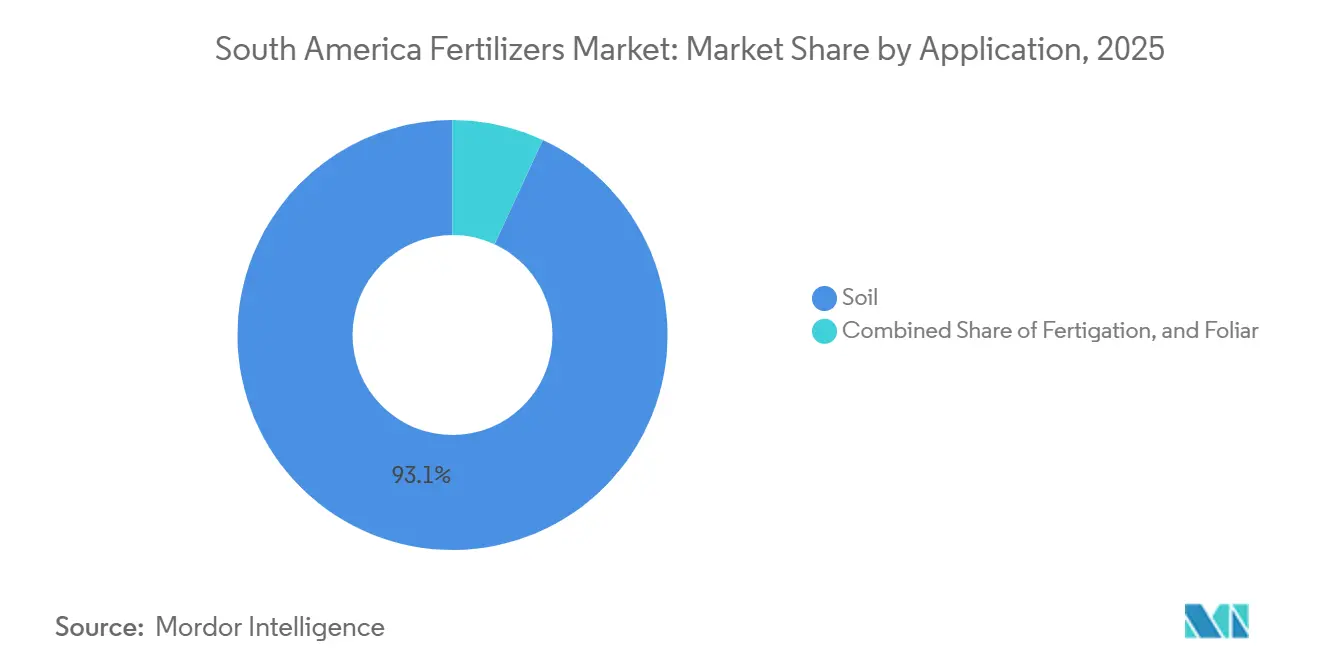
- By application mode, soil was the largest segment, capturing 93.1% share of the South America fertilizers market in 2025, whereas fertigation is the fastest-growing segment, forecast to post a 6.1% CAGR through 2031.
- By crop type, field crops accounted for the largest share of the South America fertilizers market in 2025, at 94.2%, while the horticultural crops segment is projected to be the fastest-growing, with a 5.6% CAGR through 2031.
- By geography, Brazil was the largest region, 71.9% share of the South America fertilizers market in 2025, Argentina is the fastest-growing region, expanding at a 6.1% CAGR through 2031.
Note: Market size and forecast figures in this report are generated using Mordor Intelligence’s proprietary estimation framework, updated with the latest available data and insights as of January 2026.
South America Fertilizers Market Trends and Insights
Drivers Impact Analysis*
| Driver | (~) % Impact on CAGR Forecast | Geographic Relevance | Impact Timeline |
|---|---|---|---|
| Rising soybean and corn acreage expansion | +1.2% | Brazil (Mato Grosso), Argentina (Chaco), and Paraguay | Medium term (2-4 years) |
| Government credit programs boosting affordability | +1.5% | Brazil (Plano Safra), and Argentina (Banco Nación lines) | Short term (≤2 years) |
| Adoption of precision farming and specialty inputs | +0.9% | Brazil (Cerrado core), Argentina (Pampas), and Chile (Central Valley) | Medium term (2-4 years) |
| Brazil National Fertilizer Plan 2050 implementation | +0.8% | Brazil (domestic capacity hubs in Bahia, Minas Gerais, and Goiás) | Long term (≥4 years) |
| Emergence of green ammonia production capacity | +0.6% | Brazil (Bahia, Ceará coastal zones), and Chile (Atacama solar belt) | Long term (≥4 years) |
| AI-enabled variable-rate advisory services | +0.4% | Brazil (large estates in Mato Grosso, São Paulo), and Argentina (Buenos Aires province) | Medium term (2-4 years) |
| Source: Mordor Intelligence | |||


Rising Soybean and Corn Acreage Expansion
Brazil planted 49.1 million ha of soybeans in the 2025-2026 crop year, a 2.8% rise, concentrated in Mato Grosso and the MATOPIBA frontier, where acidic cerrado soils require high phosphate starters[1]Source: Ministry of Agriculture, “Plano Safra 2025/2026,” gov.br. Safrinha corn production increases the country’s corn output and compresses the nitrogen top-dress window to fewer than 20 days, stimulating demand for liquid urea-ammonium-nitrate blends that sprayers can deliver quickly. Double-cropping strategies tighten logistics calendars and increase the premium on readily available fertilizers that support rapid crop transitions. Second-crop corn, known as safrinha, accounts for a significant share of Brazil's total corn production. Its planting window, from February to March, limits the top-dress nitrogen application period to 18 days. This has increased demand for liquid urea-ammonium-nitrate solutions, which can be applied more quickly with spray rigs than with granular broadcast methods.
Adoption of Precision Farming and Specialty Inputs
Variable-rate technology guided by Sentinel-2 and Planet imagery cut urea use by 14% of Brazilian soybean and corn in 2025 while keeping yields flat. The gain in nutrient-use efficiency shifts product preference toward water-soluble, inhibitor-enhanced, and coated formulations that sprayers and drip systems meter precisely. Polymer-coated urea extended nitrogen availability to 90 days in sugarcane trials, eliminating the need for two application passes and saving USD 28 per ha in fuel and labor[2]Source: União da Indústria de Cana-de-Açúcar, “Input Efficiency in Sugarcane,” Unica.Com.br. Across the South America fertilizer market, precision tools are moving specialty inputs from niche to mainstream as growers chase input savings and sustainability metrics.
Brazil National Fertilizer Plan 2050 Implementation
The plan targets achieving domestic production by mid-century, reallocating capital from import terminals to upstream mining and green ammonia synthesis. Phosphate production has progressed the most rapidly, with Vale’s Salobo mine expansion increasing rock output and reducing demand for imported Mono Ammonium Phosphate (MAP). In contrast, potash production has been delayed, as permitting for the Amazonas deposits was extended by 14 months due to consultations with indigenous communities. Achieving the self-sufficiency milestone set for 2030 now hinges on green ammonia projects, such as Atlas Agro’s Pecém complex and Unigel’s Bahia pilot, transitioning from demonstration to full-scale operations. If these projects are operational as scheduled, Brazil could reduce nitrogen imports before 2031, mitigating exchange-rate risks for local farmers.
Emergence of Green-Ammonia Production Capacity
The development of green ammonia production in South America, supported by abundant renewable energy sources such as solar and wind in countries like Chile and Brazil, is significantly impacting the regional fertilizer market. Key projects, including Atlas Agro's 530,000 metric tons per-year plant in Brazil and Yara’s renewable-based operations, are reducing reliance on imported, fossil-fuel-based ammonia. This transition promotes the production of sustainable, low-carbon, and locally sourced nitrogen fertilizers. Green ammonia production is advancing as large-scale projects progress from planning to execution. Several industrial developers are establishing integrated facilities powered entirely by renewable energy, eliminating the need for fossil-based feedstocks and substantially reducing carbon intensity compared to traditional ammonia production.
Restraints Impact Analysis*
| Restraint | (~) % Impact on CAGR Forecast | Geographic Relevance | Impact Timeline |
|---|---|---|---|
| Volatility in natural-gas and potash prices | -0.9% | Global (imported urea, ammonia), Brazil (import-dependent), and Argentina | Short term (≤2 years) |
| Stricter nutrient-runoff and Greenhouse Gas (GHG) regulations | -0.5% | Brazil (coastal states under Conselho Nacional do Meio Ambiente (CONAMA) jurisdiction), and Chile (salmon-farming watersheds) | Medium term (2-4 years) |
| Freight bottlenecks via the Panama Canal and the Red Sea | -0.6% | Brazil (Santos and Paranaguá import terminals) and Argentina (Rosario port complex) | Short term (≤2 years) |
| Agronomy talent shortage is slowing tech adoption | -0.3% | Brazil (northeastern states and the MATOPIBA frontier), Paraguay and Bolivia | Long term (≥4 years) |
| Source: Mordor Intelligence | |||
Stricter Nutrient-Runoff and Greenhouse Gas (GHG) Regulations
Resolution 430/2011 of CONAMA, which regulates the discharge of effluents into receiving water bodies in Brazil, established stricter standards for nitrogen and other pollutants[3]Source: National Council for the Environment, “Resolution 430 – Water Quality Standards,” gov.br. This regulation, which modifies and supplements Resolution 357/2005, mandates that industries and agricultural operations, including sugarcane and rice producers, adhere to tighter nutrient discharge limits to reduce pollution in surface and groundwater resources. The regulation aims to address the growing concerns over water quality and its impact on ecosystems and public health. Increased regulatory costs could hinder the adoption of specialty inputs by smallholders unless credit incentives help offset the initial price premium. These measures are projected to encourage the adoption of sustainable practices and technologies to meet compliance requirements while minimizing environmental impact.
Agronomy Talent Shortage Slowing Tech Adoption
Brazil faces a shortage of 15,000 agronomists, particularly in the MATOPIBA region, as the rapid agricultural expansion outpaces the supply of qualified professionals. This shortage is critical as agronomists play a key role in guiding farmers on best practices, optimizing input use, and improving yields. Currently, only a few Brazilian farmers receive extension visits, which limits the adoption of variable-rate technologies and specialty fertilizer blends that require technical expertise. While remote advisory applications provide some support, many farmers continue to prefer on-site assistance due to the hands-on nature of agricultural practices. This talent gap hinders the adoption of precision agriculture, tempering but not negating growth in the South America fertilizers market.
*Our forecasts treat driver/restraint impacts as directional, not additive. The impact forecasts reflect baseline growth, mix effects, and variable interactions.
Segment Analysis
By Type: Complex Blends Gain as Custom Nutrition Rises
Straight was the largest segment, accounting for 89.4% of South America fertilizers market share in 2025, as growers seek single-pass solutions that save labor. Farmers have reported labor savings of 30-40% and reduced application errors when using complex NPK products, particularly in large-scale soybean fields in Mato Grosso. Additionally, micronutrient additives are experiencing steady growth driven by precision farming practices that have identified widespread deficiencies in zinc, boron, and manganese in regional soils. The commencement of domestic phosphate production at the Serra do Salitre facility is bolstering the local supply of monoammonium phosphate (MAP) and diammonium phosphate (DAP). Potash continues to rely heavily on imports. Increasing deficiencies in sulfur and calcium are also elevating the importance of secondary macronutrients on procurement lists, thereby expanding the nutrient base of the South America fertilizers market.
Complex is the fastest-growing segment, advancing at an 7.8% CAGR through 2031, as multi-deficiency soils expand beyond the Cerrado into new MATOPIBA frontiers, fertilizer blenders are utilizing rail-linked hubs to customize NPK formulations based on localized soil analyses. This approach helps reduce regional freight and storage costs. Farmers are transitioning from focusing solely on price comparisons to evaluating total-program economics, acknowledging the benefits of balanced blends in improving yield stability and nutrient-use efficiency under climate stress. Meanwhile, straight grades are evolving, with urea producers introducing coated variants and phosphate suppliers adding micronutrient enrichments. These developments ensure that both segments remain significant in South America fertilizer market.


By Form: Specialty Inputs Climb on Efficiency Mandates
Conventional fertilizers were the largest segment, accounting for 92.8% share of the South America fertilizers market size in 2025. This dominance can be attributed to their widespread use in agricultural practices, cost-effectiveness, and the ability to meet the nutrient requirements of various crops. The high adoption rate of conventional fertilizers highlights their critical role in supporting agricultural productivity across the region.
The specialty segment is the fastest-growing, advancing at a 6.0% CAGR through 2031. Controlled-release fertilizers (CRF) are gaining prominence as a single-application system that provides nutrients to crops throughout the growing season, thereby reducing the need for multiple labor-intensive applications. Liquid and water-soluble fertilizers are experiencing growth in irrigated fruit-growing regions and greenhouse operations, supported by the adoption of variable-rate fertigation systems. Polymer-coated urea holds a notable share of the regional nitrogen market, particularly in sugarcane cultivation, where its 90-day nutrient release cycle aligns with the crop's nutrient uptake, eliminating the need for additional mid-season applications.
By Application Mode: Fertigation Scales Beyond Horticulture
Soil was the largest segment, capturing 93.1% of South America fertilizers market share in 2025, a method entrenched by the dominance of broadcast spreaders and drill-mounted applicators that service Brazil's soybean and corn crop. Inline injectors enable drip and center-pivot systems to meter nutrients precisely, reducing nitrogen losses for broadcast urea. Foliar sprays deliver fast-acting micronutrients on 1.4 million ha of Argentine wheat and barley, improving grain protein by nearly one percentage point.
Fertigation is the fastest-growing segment, forecast to post a 6.1% CAGR through 2031. Fertigation’s wider adoption hinges on capital expenditure, center-pivot installations cost USD 2,800-4,500 per ha, limiting uptake to high-value or drought-prone regions. Even so, the South America fertilizer market share for fertigation is climbing as cooperatives bundle long-tenor irrigation loans with input contracts. Manufacturers of water-soluble crystals are expanding packaging lines in Paraná and Antofagasta to meet just-in-time demand from fruit exporters who fine-tune nutrient doses based on Normalized Difference Vegetation Index (NDVI) alerts.
By Crop Type: Field Dominance Continues
Field crops accounted for 94.2% share of the South America fertilizers market in 2025. The demand for fertilizers in this segment is primarily driven by the cultivation of soybean, corn, sugarcane, and wheat. Soybean cultivation requires average applications of 110 kg of P₂O₅ (phosphorus pentoxide) and K₂O (potassium oxide) per hectare to support nodulation and pod fill. Corn, particularly the safrinha crop, generates significant demand for urea during the concentrated February–March application period, creating logistical and distribution challenges. Although field crops dominate fertilizer consumption in the region, growth in this segment is anticipated to remain moderate due to the maturity of the region's primary grain-producing areas.
Horticulture crops represent the fastest-growing segment, with a projected CAGR of 5.6% through 2031. Growth in this segment is driven by crops such as coffee, citrus, avocados, berries, fruits, and vegetables, as increasing export requirements and quality standards necessitate higher nutrient intensity and the adoption of specialized fertilizer programs. Additionally, greenhouse clusters near major urban centers drive demand for soluble and foliar fertilizer formulations. Changes in dietary preferences, rising consumption of fresh produce, and stricter phytosanitary standards are anticipated to gradually increase horticulture's share of the South American fertilizer market. This shift creates opportunities for high-value specialty fertilizers and data-driven agronomic services, expanding growth prospects beyond traditional grain production.
Geography Analysis
Brazil was the largest region, 71.9% of the South America fertilizers market share in 2025, reflecting increasing cultivated land and intensive nutrient use on soybean, corn, and sugarcane. Port congestion at Santos and Paranaguá added up to 12 days of vessel delay during peak import months, inflating freight costs and reinforcing the government’s push for upstream self-sufficiency. This logistical challenge has further reinforced the government’s efforts to achieve upstream self-sufficiency by promoting domestic fertilizer production, incentivizing investments in local manufacturing facilities, and reducing reliance on imports to stabilize supply chains and mitigate future disruptions.
Argentina is the fastest-growing region, with a CAGR of 6.1% projected through 2031. However, fertilizer intensity varies due to export levies and currency fluctuations. Higher soybean export taxes and continued peso depreciation have reduced MAP (monoammonium phosphate) and MOP (muriate of potash) purchases across over 1 million hectares, potentially leading to lower yields in 2026–2027. Still, adoption of variable-rate prescriptions for Pampas farmland lifted soybean returns, proving that targeted nutrition can offset macro headwinds. Rosario’s river-draft limits doubled barge freight for imported fertilizer, raising interest in domestic blending hubs closer to the western Pampas.
The Rest of South America block including Colombia, Peru, Chile, Paraguay, and Bolivia held a significant share of demand in 2025. Colombia’s coffee renovation lifted potassium and micronutrient imports of new coastal avocados adopted fertigation on nearly four-fifths of area, cutting water use boosting calcium nitrate volumes. Chile’s table-grape exporters trimmed potassium nitrate rates through sensor-guided fertigation, yet still secured earlier harvests that captured price premiums.

Competitive Landscape
The market concentration is moderate, with key players including ICL Group Ltd, K+S Aktiengesellschaft, Nutrien Ltd., The Mosaic Company, and Yara International ASA. Specialty niches are attracting companies such as K+S, Haifa, and SQM, which focus on water-soluble and chloride-free product lines tailored for fruit exporters facing strict European Union residue limits. Patent filings for enhanced-efficiency formulas increased by 35% in 2024, underscoring the competitive drive for innovation, particularly in urease and nitrification inhibitors. Additionally, distribution networks are undergoing strategic changes, with Nutrien divesting its retail outlets in Argentina and Chile to fund growth in Brazilian specialty markets.
Mid-tier blenders like Heringer and Nortox leverage Plano Safra financing to procure spot urea and pre-sell seasonal packages, effectively tying growers to bundled credit and agronomy services. This regional flexibility enables them to gain market share during periods of port congestion or currency fluctuations that disrupt import flows. In response, larger incumbents are integrating digital platforms to enhance their competitive edge. Regulatory trends emphasizing runoff reduction and carbon labeling are favoring suppliers offering controlled-release or inhibitor-enhanced products.
Supply security has emerged as a critical focus area. Companies are co-investing in infrastructure such as rail sidings, port storage, and inland warehouses to shield clients from freight disruptions. Producers are also introducing carbon footprint labeling to align with anticipated European Union carbon border adjustment mechanisms. These developments suggest gradual market consolidation, though there remains significant opportunity for local specialists adept at providing tailored services and region-specific blends within the South America fertilizers market.
South America Fertilizers Industry Leaders
ICL Group Ltd
K+S Aktiengesellschaft
Nutrien Ltd.
The Mosaic Company
Yara International ASA
- *Disclaimer: Major Players sorted in no particular order

Recent Industry Developments
- December 2024: Yara International began the production of renewable-based ammonia at its Cubatão, Brazil complex. The new process uses biomethane derived from sugar-cane residues rather than fossil natural gas, cutting greenhouse-gas emissions by up to ~75%.
- May 2023: K+S acquired a 75% stake in the fertilizer business of Industrial Commodities Holdings (Pty) Ltd (ICH), a South African trading company. This acquisition expanded K+S's presence in the fertilizer market and strengthened its operations in southern and eastern Africa. Additionally, it aligns with K+S's strategic global expansion, which could influence its broader supply chains, including those in South America.
- May 2023: Yara has invested USD 90 million in high-tech fertilizers in Brazil. This investment aims to expand research and development (R&D) activities, enhance the product portfolio with new, advanced products and patented solutions, and recruit specialized teams for research and demand generation. The initiative will create 50 new jobs, complementing the company's existing network of technical representatives nationwide.


South America Fertilizers Market Report Scope
Fertilizers are synthetic substances added to soil or plants to supply essential nutrients that promote healthy growth, increase crop productivity, and improve yield quality.
The South America fertilizers market is categorized across multiple dimensions, including type, form, application mode, crop type, and country. By type, the market covers complex and straight fertilizers. Based on form, it includes conventional and specialty products. In terms of application mode, the segmentation comprises fertigation, foliar, and soil application methods. By crop type, the market addresses field crops, horticultural crops, and turf and ornamental segments. Geographically, the analysis spans Argentina, Brazil, and the rest of South America. Market size and forecasts are presented in both value (USD) and volume (metric tons).
By Type
| Complex | ||
| Straight | Micronutrients | Boron |
| Copper | ||
| Iron | ||
| Manganese | ||
| Molybdenum | ||
| Zinc | ||
| Others | ||
| Nitrogenous | Urea | |
| Others | ||
| Phosphatic | Di-ammonium Phosphate (DAP) | |
| Monoammonium phosphate (MAP) | ||
| Single Super Phosphate (SSP) | ||
| Triple Superphosphate (TSP) | ||
| Potassic | Muriate of Potassium (MoP) | |
| Sulphate of Potash (SoP) | ||
| Others | ||
| Secondary Macronutrients | Calcium | |
| Magnesium | ||
| Sulfur | ||
By Form
| Conventional | |
| Speciality | Controlled Release Fertilizers (CRF) |
| Liquid Fertilizer | |
| Slow-release fertilizers (SRF) | |
| Water Soluble |
By Application Mode
| Fertigation |
| Foliar |
| Soil |
By Crop Type
| Field Crops |
| Horticultural Crops |
| Turf and Ornamental |
By Geography
| Argentina |
| Brazil |
| Rest of South America |
| By Type | Complex | ||
| Straight | Micronutrients | Boron | |
| Copper | |||
| Iron | |||
| Manganese | |||
| Molybdenum | |||
| Zinc | |||
| Others | |||
| Nitrogenous | Urea | ||
| Others | |||
| Phosphatic | Di-ammonium Phosphate (DAP) | ||
| Monoammonium phosphate (MAP) | |||
| Single Super Phosphate (SSP) | |||
| Triple Superphosphate (TSP) | |||
| Potassic | Muriate of Potassium (MoP) | ||
| Sulphate of Potash (SoP) | |||
| Others | |||
| Secondary Macronutrients | Calcium | ||
| Magnesium | |||
| Sulfur | |||
| By Form | Conventional | ||
| Speciality | Controlled Release Fertilizers (CRF) | ||
| Liquid Fertilizer | |||
| Slow-release fertilizers (SRF) | |||
| Water Soluble | |||
| By Application Mode | Fertigation | ||
| Foliar | |||
| Soil | |||
| By Crop Type | Field Crops | ||
| Horticultural Crops | |||
| Turf and Ornamental | |||
| By Geography | Argentina | ||
| Brazil | |||
| Rest of South America | |||


Market Definition
- MARKET ESTIMATION LEVEL - Market Estimations for various types of fertilizers has been done at the product-level and not at the nutrient-level.
- NUTRIENT TYPES COVERED - Primary Nutrients: N, P and K, Secondary Macronutrients: Ca, Mg and S, Micronutients: Zn, Mn, Cu, Fe, Mo, B, and Others
- AVERAGE NUTRIENT APPLICATION RATE - This refers to the average volume of nutrient consumed per hectare of farmland in each country.
- CROP TYPES COVERED - Field Crops: Cereals, Pulses, Oilseeds, and Fiber Crops Horticulture: Fruits, Vegetables, Plantation Crops and Spices, Turf Grass and Ornamentals
| Keyword | Definition |
|---|---|
| Fertilizer | Chemical substance applied to crops to ensure nutritional requirements, available in various forms such as granules, powders, liquid, water soluble, etc. |
| Specialty Fertilizer | Used for enhanced efficiency and nutrient availability applied through soil, foliar, and fertigation. Includes CRF, SRF, liquid fertilizer, and water soluble fertilizers. |
| Controlled-Release Fertilizers (CRF) | Coated with materials such as polymer, polymer-sulfur, and other materials such as resins to ensure nutrient availability to the crop for its entire life cycle. |
| Slow-Release Fertilizers (SRF) | Coated with materials such as sulfur, neem, etc., to ensure nutrient availability to the crop for a longer period. |
| Foliar Fertilizers | Consist of both liquid and water soluble fertilizers applied through foliar application. |
| Water-Soluble Fertilizers | Available in various forms including liquid, powder, etc., used in foliar and fertigation mode of fertilizer application. |
| Fertigation | Fertilizers applied through different irrigation systems such as drip irrigation, micro irrigation, sprinkler irrigation, etc. |
| Anhydrous Ammonia | Used as fertilizer, directly injected into the soil, available in gaseous liquid form. |
| Single Super Phosphate (SSP) | Phosphorus fertilizer containing only phosphorus which has lesser than or equal to 35%. |
| Triple Super Phosphate (TSP) | Phosphorus fertilizer containing only phosphorus greater than 35%. |
| Enhanced Efficiency Fertilizers | Fertilizers coated or treated with additional layers of various ingredients to make it more efficient compared to other fertilizers. |
| Conventional Fertilizer | Fertilizers applied to crops through traditional methods including broadcasting, row placement, ploughing soil placement, etc. |
| Chelated Micronutrients | Micronutrient fertilizers coated with chelating agents such as EDTA, EDDHA, DTPA, HEDTA, etc. |
| Liquid Fertilizers | Available in liquid form, majorly used for application of fertilizers to crops through foliar and fertigation. |


Research Methodology
Mordor Intelligence follows a four-step methodology in all our reports.
- Step-1: IDENTIFY KEY VARIABLES: In order to build a robust forecasting methodology, the variables and factors identified in Step-1 are tested against available historical market numbers. Through an iterative process, the variables required for market forecast are set and the model is built on the basis of these variables.
- Step-2: Build a Market Model: Market-size estimations for the forecast years are in nominal terms. Inflation is not a part of the pricing, and the average selling price (ASP) is kept constant throughout the forecast period for each country.
- Step-3: Validate and Finalize: In this important step, all market numbers, variables and analyst calls are validated through an extensive network of primary research experts from the market studied. The respondents are selected across levels and functions to generate a holistic picture of the market studied.
- Step-4: Research Outputs: Syndicated Reports, Custom Consulting Assignments, Databases & Subscription Platforms


