Market Overview
| Study Period | 2021 - 2031 |
|---|---|
| Forecast Data Period | 2026 - 2031 |
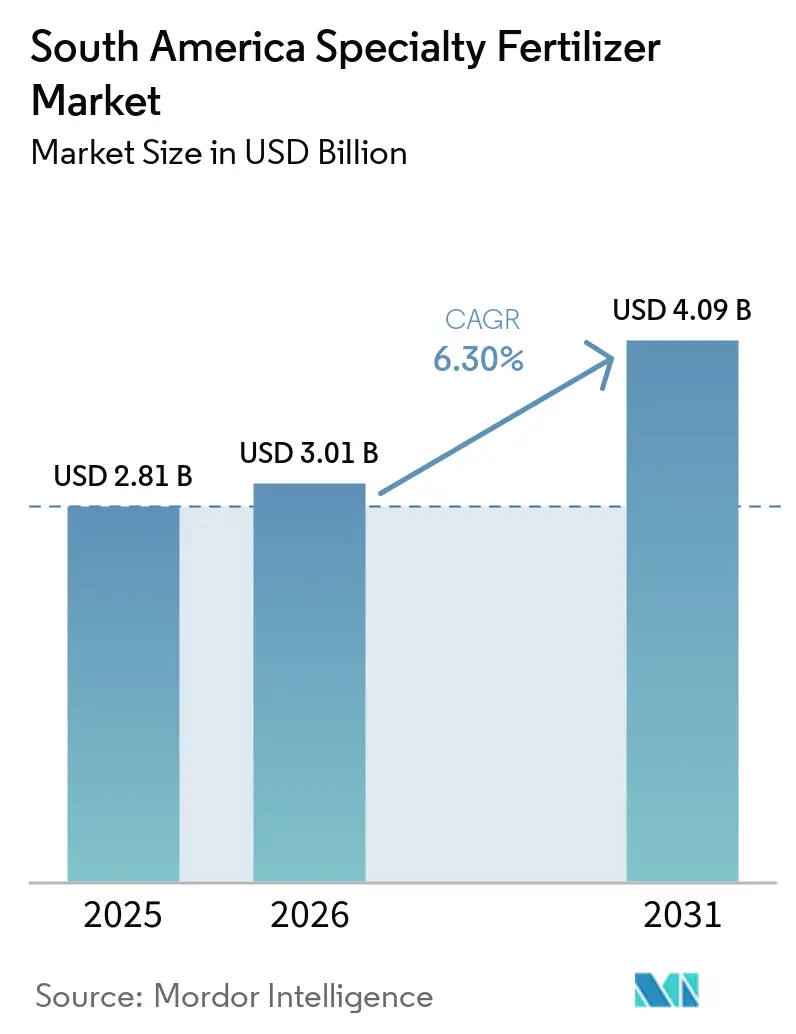
| Base Year Market Size (2025) | USD 2.81 Billion |
| Market Size (2026) | USD 3.01 Billion |
| Market Size (2031) | USD 4.09 Billion |
| Growth Rate (2026 - 2031) | 6.30% CAGR |
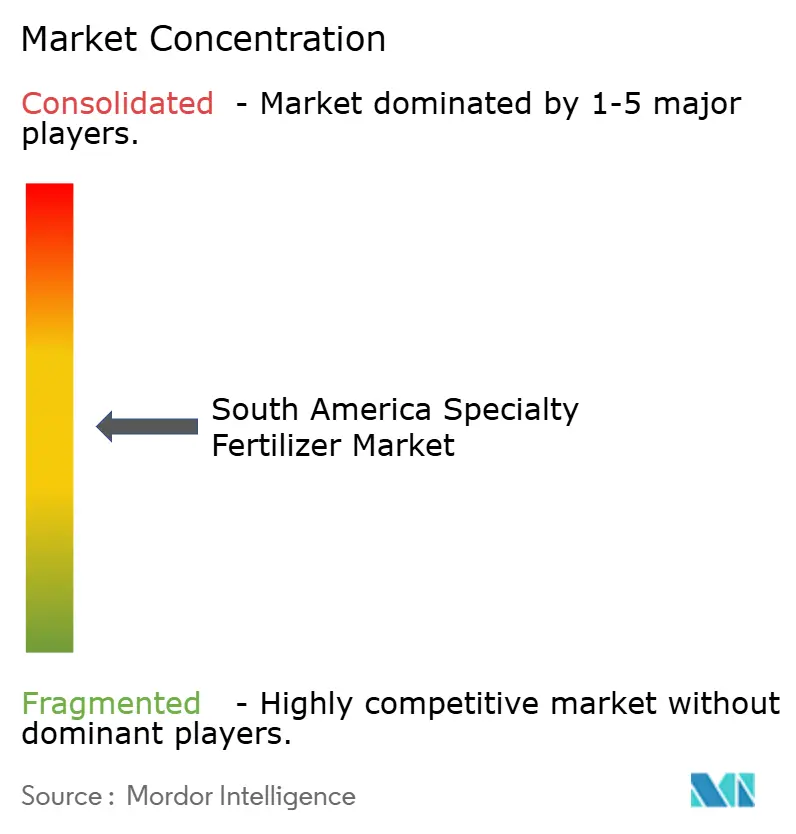
| Market Concentration | Medium |
Major Players *Disclaimer: Major Players sorted in no particular order Image © Mordor Intelligence. Reuse requires attribution under CC BY 4.0. | |
South America Specialty Fertilizer Market Analysis by Mordor Intelligence
The South America specialty fertilizer market size was valued at USD 2.81 billion in 2025 and estimated to grow from USD 3.01 billion in 2026 to reach USD 4.09 billion by 2031, at a CAGR of 6.30% during the forecast period (2026-2031). Long-run momentum stems from precision farming adoption, expanding irrigated acreage, and policy incentives that lower the cost of enhanced-efficiency formulations while tightening rules on nutrient runoff. Brazil anchors growth with 67.4% regional share in 2025, leveraging double-cropping intensity, robust local manufacturing, and tax reductions on controlled-release products. Argentina adds scale through export-oriented grains that depend on liquid and water-soluble blends compatible with existing irrigation infrastructure. Currency volatility in the Brazilian real and Argentine peso underscores the importance of domestic production and hedged supply chains, while blockchain-verified traceability platforms reward growers who document sustainable nutrient management practices. Competition remains moderately concentrated, with the top five suppliers accounting for a significant share of the market. However, new entrants are gaining traction in biostimulant premixes and digital decision-support tools.
Key Report Takeaways
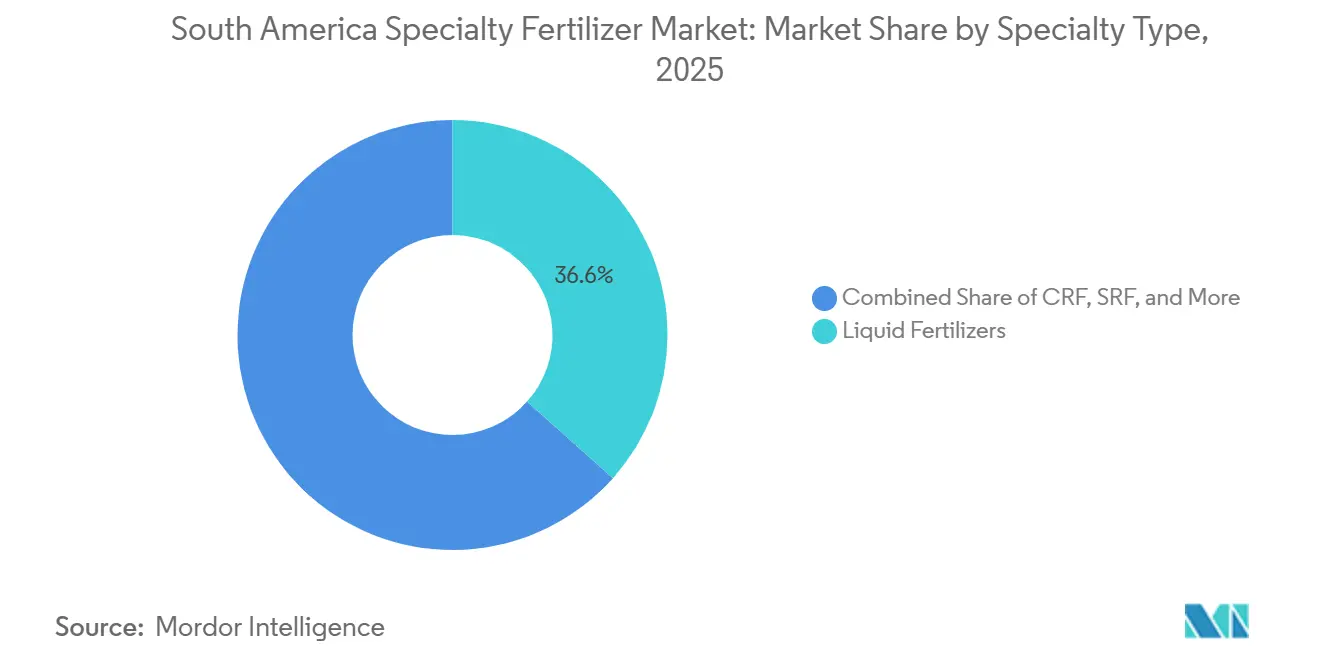
- By specialty type, liquid fertilizers accounted for the largest South America specialty fertilizer market share, 36.6%, in 2025, while controlled-release fertilizers are projected to grow fastest at a CAGR of 7.4% through 2031.
- By application mode, fertigation represented the largest South America specialty fertilizer market size in 2025 with a 52.3% share and is also forecast to expand at the fastest CAGR of 6.9% through 2031.
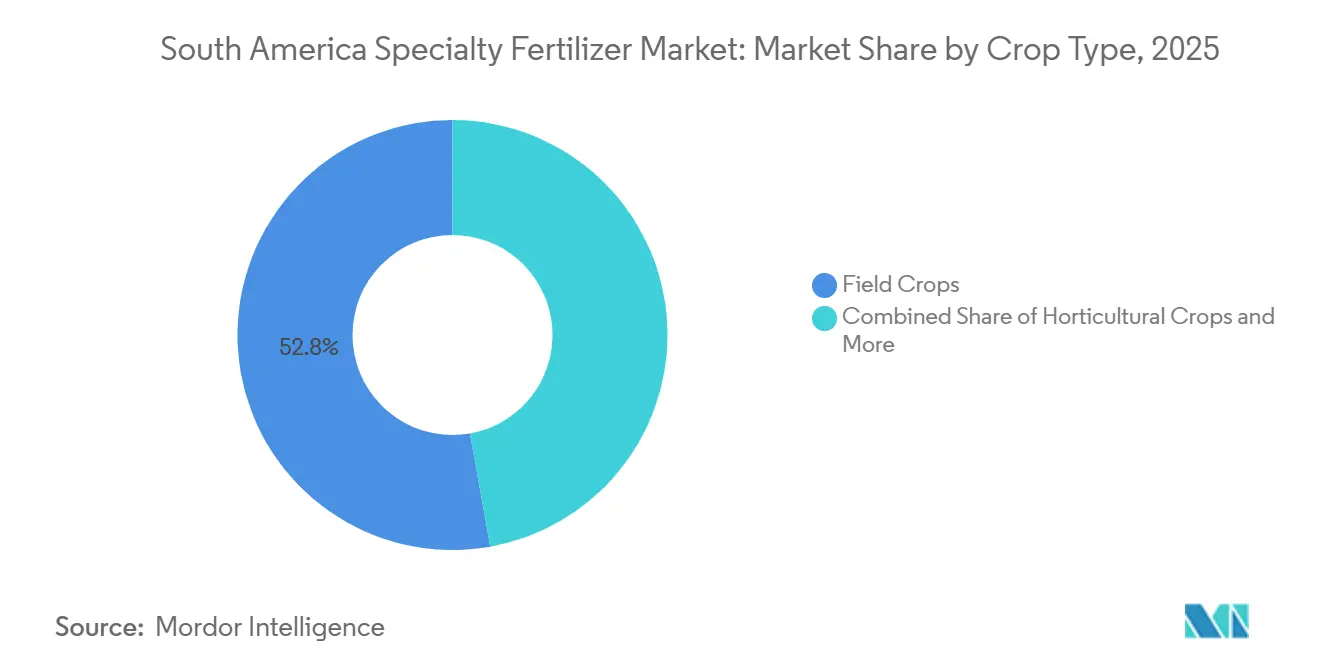
- By crop type, field crops led with a 52.8% share in 2025, whereas horticultural crops are anticipated to record the highest CAGR of 7.2% during the forecast period.
- By geography, Brazil accounted for the largest share at 67.4% in 2025, while Argentina is projected to be the fastest-growing market at a CAGR of 7.3% through 2031.
Note: Market size and forecast figures in this report are generated using Mordor Intelligence’s proprietary estimation framework, updated with the latest available data and insights as of 2026.
South America Specialty Fertilizer Market Trends and Insights
Drivers Impact Analysis*
| Driver | (~) % Impact on CAGR Forecast | Geographic Relevance | Impact Timeline |
|---|---|---|---|
| Surge in drip-irrigated acreage | +1.2% | Brazil, Argentina, Chile, Paraguay, Uruguay | Medium term (2-4 years) |
| Government tax incentives on enhanced-efficiency fertilizers | +0.9% | Brazil and Argentina | Short term (≤ 2 years) |
| Increasing soybean and corn double-cropping intensity | +1.1% | Brazil Cerrado and Mato Grosso; Argentina Pampas | Long term (≥ 4 years) |
| Tightening water-quality regulations on nitrate leaching | +0.8% | Brazil national basins; Argentina provincial watersheds | Medium term (2-4 years) |
| Biostimulant-fertilizer premix integration | +0.6% | Brazil, Argentina, spillover to Colombia and Chile | Long term (≥ 4 years) |
| Blockchain-based traceability premiums | +0.4% | Export hubs in Brazil and Argentina | Medium term (2-4 years) |
| Source: Mordor Intelligence | |||


Surge in Drip-Irrigated Acreage
Brazil’s irrigated land expanded 12% between 2019 and 2024, reaching 8.2 million ha, with drip systems the fastest-growing share[1]Brazilian National Water Agency, “Irrigated Agriculture Statistics,” gov.br . Drip technology requires fully soluble inputs, making specialty fertilizers essential to prevent emitter clogging and to match nutrient pulses with crop demand. Argentina added 1.8 million ha, chiefly in Mendoza vineyards and northern citrus groves, reinforcing liquid and water-soluble uptake. Regional equipment manufacturers posted 15-20% annual sales growth, reinforcing the feedback loop between precision irrigation and fertilizer innovation. Yield data show 8-10% gains when fertigation combines soluble NPK with micronutrient chelates, validating investment even under volatile commodity prices. Local agronomic service providers now bundle irrigation kits with nutrition advisories, speeding farmer learning curves. As drip lines penetrate Paraguay and Uruguay, cross-border demand for soluble blends climbs, widening the addressable base of the South America specialty fertilizer market[2]Brazilian National Environment Council, “Water Quality Framework Updates,” gov.br.
Government Tax Incentives on Enhanced-Efficiency Fertilizers
Brazil’s 2024 reform cut PIS/COFINS on controlled-release and slow-release fertilizers from 9.25% to 3.65%, trimming retail prices about 6%[3]Brazilian Ministry of Agriculture, “Tax Policy Updates for Enhanced-Efficiency Fertilizers,” gov.br . Argentina matched with lower import duties on polymer-coated urea and biostimulant additives, aligning with ISO 14001 certification rebates. Early market data show controlled-release tonnage up 23% just six months after rollout. The policy tightens the link between environmental stewardship and profitability, accelerating market penetration beyond high-value horticulture into broadacre soybean, corn, and cotton. Local blenders rapidly shifted portfolios toward coated products, leveraging transitional inventory credits. As fiscal benefits sunset in 2026, manufacturers expect demand stickiness given demonstrable yield boosts and lower labor costs per hectare. Neighboring governments monitor the Brazilian model, foreshadowing a broader incentive wave across South America specialty fertilizer market economies.
Increasing Soybean and Corn Double-Cropping Intensity
Brazil’s safrinha corn covered 15.8 million ha in 2024, 78% of national corn land, squeezing two nutrient-hungry crops inside a single calendar year[4]Brazilian Institute of Geography and Statistics, “Agricultural Census and Crop Statistics,” ibge.gov.br. Specialty fertilizers, especially polymer-coated N sources, sustain crop uptake across compressed seasons without extra passes, cutting machinery costs and soil compaction. Argentina’s Pampas sees expanding wheat-soy and wheat-corn sequences that similarly compress fertilization windows. Controlled-release blends align with these systems, releasing nutrients at soil-temperature-dependent rates that match crop phenology. Research plots record 4-6% yield lifts and 9% lower nitrogen leaching versus conventional urea. Double-cropping magnifies fertilizer value per hectare, tilting cost-benefit equations in favor of enhanced-efficiency inputs even for risk-averse growers. As commodity traders validate soil sustainability metrics, double-crop adopters gain price differentials, strengthening specialty fertilizer pull-through.
Tightening Water-Quality Regulations on Nitrate Leaching
Brazil enforced stricter nitrate caps in priority basins such as São Francisco and Paraná in 2024. Remote sensing and water sampling underpin compliance audits, exposing farmers to fines and trade-permit suspensions. Controlled-release and inhibitor-treated fertilizers reduce leaching by up to 35%, offering a practical compliance route. Argentina’s Buenos Aires and Santa Fe provinces enacted comparable rules, aligning with European buyer protocols. Retailer training now pairs product sales with nitrate testing services, creating bundled revenue streams. Financial institutions include nutrient-management plans in loan covenants, institutionalizing specialty fertilizer adoption. The policy push solidifies a long-term demand floor, anchoring the South America specialty fertilizer market growth outlook.
Restraints Impact Analysis*
| Restraint | (~) % Impact on CAGR Forecast | Geographic Relevance | Impact Timeline |
|---|---|---|---|
| High upfront cost versus commodity fertilizers | -1.8% | Smallholder zones across Brazil and Argentina | Short term (≤ 2 years) |
| Limited distribution infrastructure in interior Brazil | -1.2% | Mato Grosso, Pará, Rondônia | Long term (≥ 4 years) |
| Lack of crop-specific field trial data for tropical soils | -0.9% | Amazon basin and Cerrado transition, northern Argentina | Medium term (2-4 years) |
| Currency-exchange volatility impacting import costs | -1.1% | Brazil, Argentina, regional spillover | Short term (≤ 2 years) |
| Source: Mordor Intelligence | |||
High Upfront Cost versus Commodity Fertilizers
Specialty fertilizers sell at 25-40% premiums to conventional NPK, a hurdle for Brazil’s 3.9 million smallholders who comprise 77% of farm units[5]Brazilian Institute of Geography and Statistics, “Agricultural Census and Crop Statistics,” ibge.gov.br. When crop prices soften, growers revert to cheaper bulk nutrients. Peso depreciation in Argentina magnifies price gaps because many inputs are dollar-denominated. Distributors counter with seasonal credit plans and grain-barter programs, but repayment risk keeps interest rates high. Without cost-sharing incentives, adoption lags in zones where labor is abundant and yield ceilings are lower. Government voucher schemes remain pilot-scale, limiting near-term relief. Consequently, price sensitivity chops an estimated 1.8% from the South America specialty fertilizer market CAGR forecast over the next two years.
Limited Distribution Infrastructure in Interior Brazil
Moving liquid or temperature-sensitive formulations 1,000 km from ports to Mato Grosso can add 15-25% to delivered cost due to unpaved roads and scarce rail links[6]Brazilian Ministry of Infrastructure, “Rural Infrastructure Development,” gov.br . Seasonal rains close highways, stranding shipments and raising spoilage risk for water-soluble blends. Interior co-ops often lack climate-controlled storage or trained agronomists, constraining product rotation. Manufacturers invest in micro-hubs and third-party logistics, yet breakeven volumes take years in low-density areas. Resolving the bottleneck demands large-scale public works unlikely to complete before 2030, removing up to 1.2% from long-run CAGR potential. Until then, coastal states capture disproportionate specialty fertilizer penetration, leaving frontier farms dependent on bulk commodities.
*Our forecasts treat driver/restraint impacts as directional, not additive. The impact forecasts reflect baseline growth, mix effects, and variable interactions.
Segment Analysis
By Specialty Type: Liquid Fertilizers Lead Despite CRF Growth Surge
Liquid fertilizers held a dominant 36.6% share of the South America specialty fertilizer market in 2025, boosted by integration with fertigation and foliar equipment used in citrus, coffee, and sugarcane plantations. Rapid absorption, uniform mixing, and compatibility with crop-protection tank mixes underpin adoption. Controlled-release fertilizers, though smaller, are forecast to deliver a 7.4% CAGR during 2026-2031, reflecting Brazil’s tax cuts and mandatory nitrate caps that make enhanced-efficiency options cost-competitive.
Operational gains also favor liquids, such as fewer passes, reduced labor, and better shelf stability after recent innovations that slow crystallization. Conversely, polymer-coated granules thrive in broadacre grains where single-application convenience offsets higher upfront cost. Sulfur-coated urea finds traction in cotton and corn, while polymer-sulfur hybrids serve cost-sensitive soy areas. Slow-release organo-mineral blends occupy a niche among organic-certified growers. Overall, product portfolio diversification allows suppliers to hedge against weather, price swings, and policy shifts, sustaining revenue robustness across specialty categories.


By Application Mode: Fertigation Systems Drive Precision Agriculture
Fertigation accounted for 52.3% of the South America specialty fertilizer market share in 2025 and is also the fastest-growing segment, projected to grow at a CAGR of 6.9% from 2026 to 2031. This is due to the drip and micro-sprinkler networks spreading beyond fruit and vegetable estates. Precise nutrient timing and concentration support higher yields per millimeter of water, critical under tightening water-use audits. Soil application continues to gain adoption through polymer-coated granules that extend feeding intervals in double-cropped corn and soy. Segment experiments show 12 kg/ha nitrogen savings without yield loss, reinforcing adoption. These benefits support broader usage across large-scale field crop systems where operational efficiency and nutrient retention remain priorities.
Foliar nutrition retains a focused role in rapid micronutrient correction for coffee, grape, and citrus trees, where leaf uptake delivers visible greening in days. Suppliers pair foliar sprays with stress-mitigating biostimulants, gaining share in drought-prone savannah belts. Precision spreaders and variable-rate controllers widen the efficiency gap between specialty granules and bulk prills, redirecting capital budgets toward smart application gear bundled with data subscriptions. Collectively, mode diversification cushions suppliers against single-channel disruption and heightens the resilience of the South America specialty fertilizer market.
By Crop Type: Field Crops Dominate Through Intensive Production Systems
Field crops accounted for 52.8% of the South American specialty fertilizer market size in 2025. Soybean-corn rotations in Brazil’s Cerrado and Argentina’s Pampas consume bulk volumes of coated urea, stabilized ammonium nitrate, and micronutrient-enriched NPK. Double-cropping heightens nutrient flux, positioning specialty inputs as risk-mitigation tools against tight windows and volatile weather. Cotton in western Bahia and sugarcane in São Paulo adopt liquids and slow-release blends tuned to multi-year ratoon cycles.
Horticultural crops, though smaller in acreage, command higher per-hectare spend and are projected to grow fastest at a CAGR of 7.2% during the forecast period. Specialty penetration exceeds 80% in Chilean berries, Colombian flowers, and Brazilian greenhouse vegetables, where export grades demand consistent size and color. Turf and ornamental segments edge upward in urban Brazil, where municipal bylaws restrict quick-release nitrogen to curb runoff. As lifestyle spending rises, golf course and landscape managers shift to controlled-release formats despite higher upfront prices, enlarging niche demand pockets.
Geography Analysis
Brazil held 67.4% of the South America specialty fertilizer market share in 2025. Government tax incentives, domestic production hubs from Yara, EuroChem, and Mosaic, and the country’s 8.2 million ha of irrigated fields underpin demand. Precision-ag cooperatives in Mato Grosso roll out digital soil maps that match variable-rate applicators with coated nutrient blends, boosting input efficiency and farmer margins.
Argentina is projected to grow at a CAGR of 7.3% through 2031, driven by an export-oriented soybean-wheat-corn matrix that values sustainability certifications demanded by European and Asian buyers. Liquid and water-soluble products integrate with center-pivot and drip systems across Pampas estates, while tax rebates on polymer-coating imports stimulate local blending. Despite volatile prices, distributors collaborate with farmers on grain-for-input swaps that stabilize working capital cycles. Research partnerships between INTI institutes and global suppliers fine-tune formulations for Calcareous soils, widening adoption.
The rest of South America primarily comprises Chile, Colombia, Paraguay, and Uruguay. Chile’s fruit exporters favor fully soluble NPK and chelated micronutrients that meet residue tolerances. Colombia’s coffee and cut-flower sectors demand foliar and fertigation solutions that improve quality scores. Paraguay mirrors Brazil’s agronomic model in soybean frontiers, albeit constrained by smaller credit pools. Uruguay’s ranchers move toward polysulfate and stabilized nitrogen to lift pasture protein without waterway eutrophication. Sub-regional trade pacts ease cross-border shipment of specialty blends, broadening supplier reach.
Competitive Landscape
The market exhibits moderate concentration with a score of 5. Yara International ASA commands market share on the strength of its Cubatão and Rio Grande complexes, broad product suite, and extensive dealer network. Mosaic, EuroChem, Nutrien, and SQM round out the top five, together controlling 58.58% of 2024 revenues. Local specialists such as Fertilizantes Heringer carve niches in customized micro-nutrient blends, while global entrants pursue joint ventures to navigate regulatory and distribution hurdles.
Strategic thrusts cluster around capacity expansion, portfolio localization, and digital agronomy. Yara’s USD 150 million upgrade of Cubatão lifts water-soluble output 40%, meeting fertigation demand. Mosaic’s MicroEssentials SZ targets Cerrado zinc and sulfur deficiencies verified by field trials. EuroChem’s Tocantins plant scales polymer-coated urea, while Nutrien invests in distribution centers to shrink last-mile gaps. ICL and K+S differentiate with multi-nutrient minerals such as Polysulphate and soluMSK, leveraging lower chloride content appealing to fruit and vegetable growers.
Innovation races focus on biostimulant-fertilizer co-formulations, smart-release coatings triggered by soil moisture, and blockchain traceability apps integrated with farm-management platforms. Patent filings tracked by WIPO surged 12% year-on-year, evidencing sustained R&D outlays. M&A remains selective; firms target logistics assets and data-analytics startups to augment agronomic advisory services. Despite currency headwinds, supplier investments signal confidence in the long-run trajectory of the South America specialty fertilizer market.
South America Specialty Fertilizer Industry Leaders
Yara International ASA
SQM S.A.
The Mosaic Company
ICL Group Ltd.
K+S Aktiengesellschaft
- *Disclaimer: Major Players sorted in no particular order

Recent Industry Developments
- August 2025: Yara introduced a new market access strategy in Brazil aimed at increasing the availability of high-technology, value-added products for rural producers. The company is establishing commercial agreements with input distributors to position them as brand representatives in the field. These agreements have an initial duration of four years and are based on criteria such as the distributors' history, performance, and location.
- February 2025: Yara partnered with the Brazilian Agricultural Research Corporation (Embrapa) to support the Recupera Rural RS Program. This program, led by Embrapa, focuses on the sustainable agricultural recovery of Rio Grande do Sul. The partnership includes an investment of USD 83.0 thousand from Yara.
- April 2023: K+S acquired a 75% stake in the fertilizer business of Industrial Commodities Holdings (Pty) Ltd (ICH), a South African trading company. This acquisition expanded K+S's presence in the fertilizer market and strengthened its operations in southern and eastern Africa. Additionally, it aligns with K+S's strategic global expansion, which could influence its broader supply chains, including those in South America.


South America Specialty Fertilizer Market Report Scope
CRF, Liquid Fertilizer, SRF, Water Soluble are covered as segments by Speciality Type. Fertigation, Foliar, Soil are covered as segments by Application Mode. Field Crops, Horticultural Crops, Turf & Ornamental are covered as segments by Crop Type. Argentina, Brazil are covered as segments by Country.Specialty Type
| Controlled-Release Fertilizer (CRF) | Polymer-Coated |
| Polymer-Sulfur-Coated | |
| Others | |
| Liquid Fertilizer | |
| Slow-Release Fertilizer (SRF) | |
| Water-Soluble Fertilizer |
Application Mode
| Fertigation |
| Foliar |
| Soil |
Crop Type
| Field Crops |
| Horticultural Crops |
| Turf and Ornamental |
Country
| Argentina |
| Brazil |
| Rest of South America |
| Specialty Type | Controlled-Release Fertilizer (CRF) | Polymer-Coated |
| Polymer-Sulfur-Coated | ||
| Others | ||
| Liquid Fertilizer | ||
| Slow-Release Fertilizer (SRF) | ||
| Water-Soluble Fertilizer | ||
| Application Mode | Fertigation | |
| Foliar | ||
| Soil | ||
| Crop Type | Field Crops | |
| Horticultural Crops | ||
| Turf and Ornamental | ||
| Country | Argentina | |
| Brazil | ||
| Rest of South America |


Market Definition
- MARKET ESTIMATION LEVEL - Market Estimations for various types of fertilizers has been done at the product-level and not at the nutrient-level.
- NUTRIENT TYPES COVERED - Primary Nutrients: N, P and K, Secondary Macronutrients: Ca, Mg and S, Micronutients: Zn, Mn, Cu, Fe, Mo, B, and Others
- AVERAGE NUTRIENT APPLICATION RATE - This refers to the average volume of nutrient consumed per hectare of farmland in each country.
- CROP TYPES COVERED - Field Crops: Cereals, Pulses, Oilseeds, and Fiber Crops Horticulture: Fruits, Vegetables, Plantation Crops and Spices, Turf Grass and Ornamentals
| Keyword | Definition |
|---|---|
| Fertilizer | Chemical substance applied to crops to ensure nutritional requirements, available in various forms such as granules, powders, liquid, water soluble, etc. |
| Specialty Fertilizer | Used for enhanced efficiency and nutrient availability applied through soil, foliar, and fertigation. Includes CRF, SRF, liquid fertilizer, and water soluble fertilizers. |
| Controlled-Release Fertilizers (CRF) | Coated with materials such as polymer, polymer-sulfur, and other materials such as resins to ensure nutrient availability to the crop for its entire life cycle. |
| Slow-Release Fertilizers (SRF) | Coated with materials such as sulfur, neem, etc., to ensure nutrient availability to the crop for a longer period. |
| Foliar Fertilizers | Consist of both liquid and water soluble fertilizers applied through foliar application. |
| Water-Soluble Fertilizers | Available in various forms including liquid, powder, etc., used in foliar and fertigation mode of fertilizer application. |
| Fertigation | Fertilizers applied through different irrigation systems such as drip irrigation, micro irrigation, sprinkler irrigation, etc. |
| Anhydrous Ammonia | Used as fertilizer, directly injected into the soil, available in gaseous liquid form. |
| Single Super Phosphate (SSP) | Phosphorus fertilizer containing only phosphorus which has lesser than or equal to 35%. |
| Triple Super Phosphate (TSP) | Phosphorus fertilizer containing only phosphorus greater than 35%. |
| Enhanced Efficiency Fertilizers | Fertilizers coated or treated with additional layers of various ingredients to make it more efficient compared to other fertilizers. |
| Conventional Fertilizer | Fertilizers applied to crops through traditional methods including broadcasting, row placement, ploughing soil placement, etc. |
| Chelated Micronutrients | Micronutrient fertilizers coated with chelating agents such as EDTA, EDDHA, DTPA, HEDTA, etc. |
| Liquid Fertilizers | Available in liquid form, majorly used for application of fertilizers to crops through foliar and fertigation. |


Research Methodology
Mordor Intelligence follows a four-step methodology in all our reports.
- Step-1: IDENTIFY KEY VARIABLES: In order to build a robust forecasting methodology, the variables and factors identified in Step-1 are tested against available historical market numbers. Through an iterative process, the variables required for market forecast are set and the model is built on the basis of these variables.
- Step-2: Build a Market Model: Market-size estimations for the forecast years are in nominal terms. Inflation is not a part of the pricing, and the average selling price (ASP) is kept constant throughout the forecast period for each country.
- Step-3: Validate and Finalize: In this important step, all market numbers, variables and analyst calls are validated through an extensive network of primary research experts from the market studied. The respondents are selected across levels and functions to generate a holistic picture of the market studied.
- Step-4: Research Outputs: Syndicated Reports, Custom Consulting Assignments, Databases & Subscription Platforms


