
South America Data Center Networking Market Size and Share
Market Overview
| Study Period | 2020 - 2031 |
|---|---|
| Forecast Data Period | 2026 - 2031 |
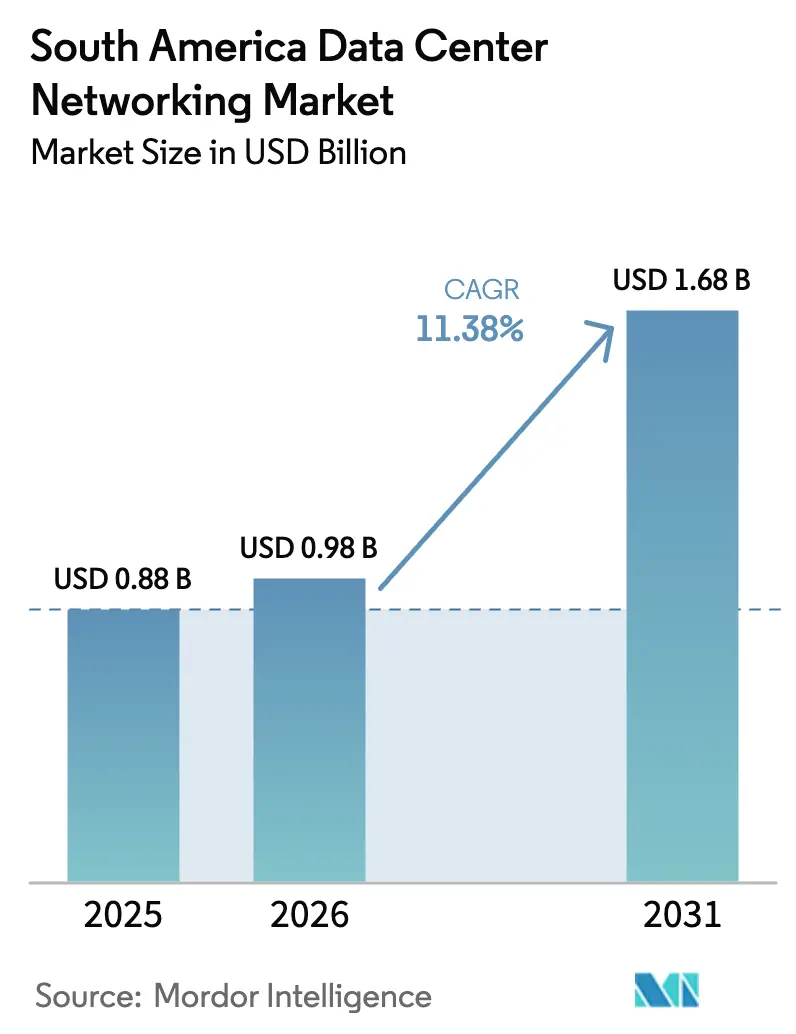
| Base Year Market Size (2025) | USD 0.88 Billion |
| Market Size (2026) | USD 0.98 Billion |
| Market Size (2031) | USD 1.68 Billion |
| Growth Rate (2026 - 2031) | 11.38 % |
| Market Concentration | Medium |
Major Players *Disclaimer: Major Players sorted in no particular order Image © Mordor Intelligence. Reuse requires attribution under CC BY 4.0. | |
South America Data Center Networking Market Analysis by Mordor Intelligence
The South America data center networking market size is expected to grow from USD 0.88 billion in 2025 to USD 0.98 billion in 2026 and is forecast to reach USD 1.68 billion by 2031 at 11.38% CAGR over 2026-2031. Robust capital flows from hyperscale cloud providers, national incentives for renewable-powered facilities, and rapid enterprise adoption of hybrid and multi-cloud architectures fuel this sustained growth. Submarine-cable additions along the Atlantic and Pacific coasts strengthen international connectivity, while open-networking ecosystems based on white-box switches and SONiC software drive cost efficiency. Vendors compete intensely around high-bandwidth optical interconnects, intent-based network automation, and integrated security appliances as Latin American organizations modernize data centers to run AI-driven workloads. Supply-chain‐friendly policies such as Brazil’s ex-tariff regime ease import duties on advanced ICT gear, offsetting pricing pressure from regional currency volatility and tariff structures.
Key Report Takeaways
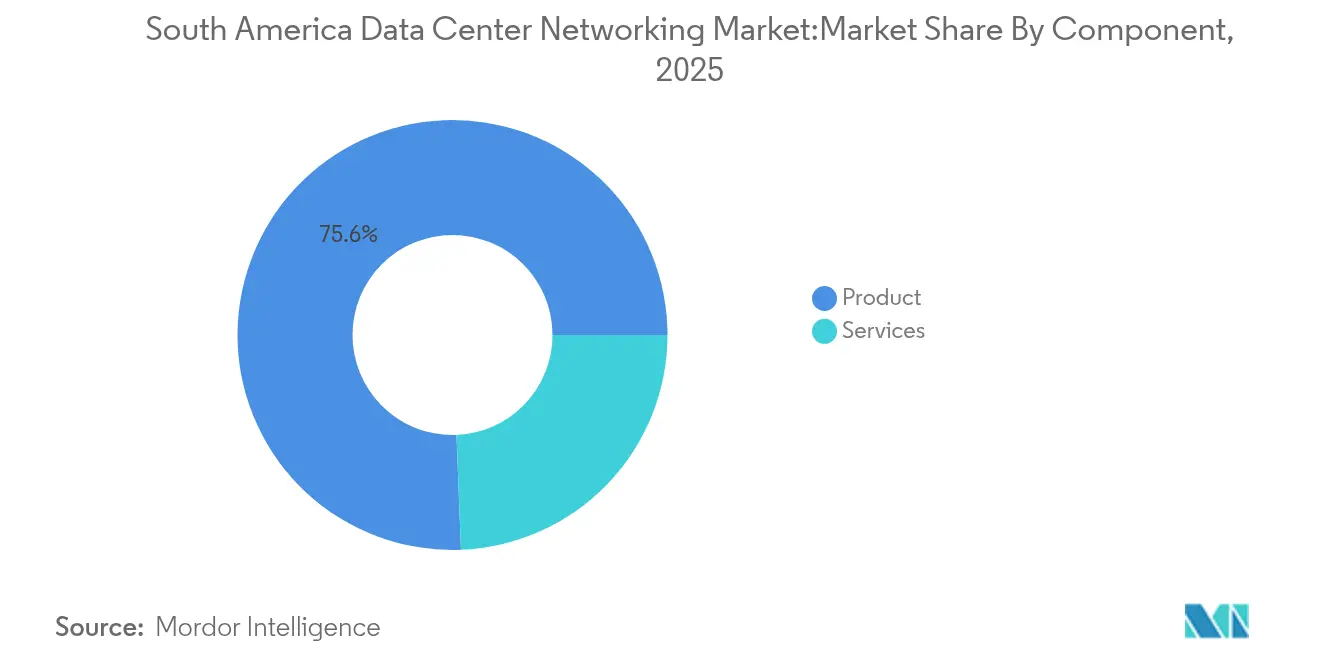
- By component, Products retained 75.63% of 2025 revenue, while Services are projected to expand at an 11.49% CAGR to 2031.
- By end-user, IT & Telecommunications accounted for 36.89% of 2025 revenue; Manufacturing & Industrial is poised for the fastest 11.88% CAGR through 2031.
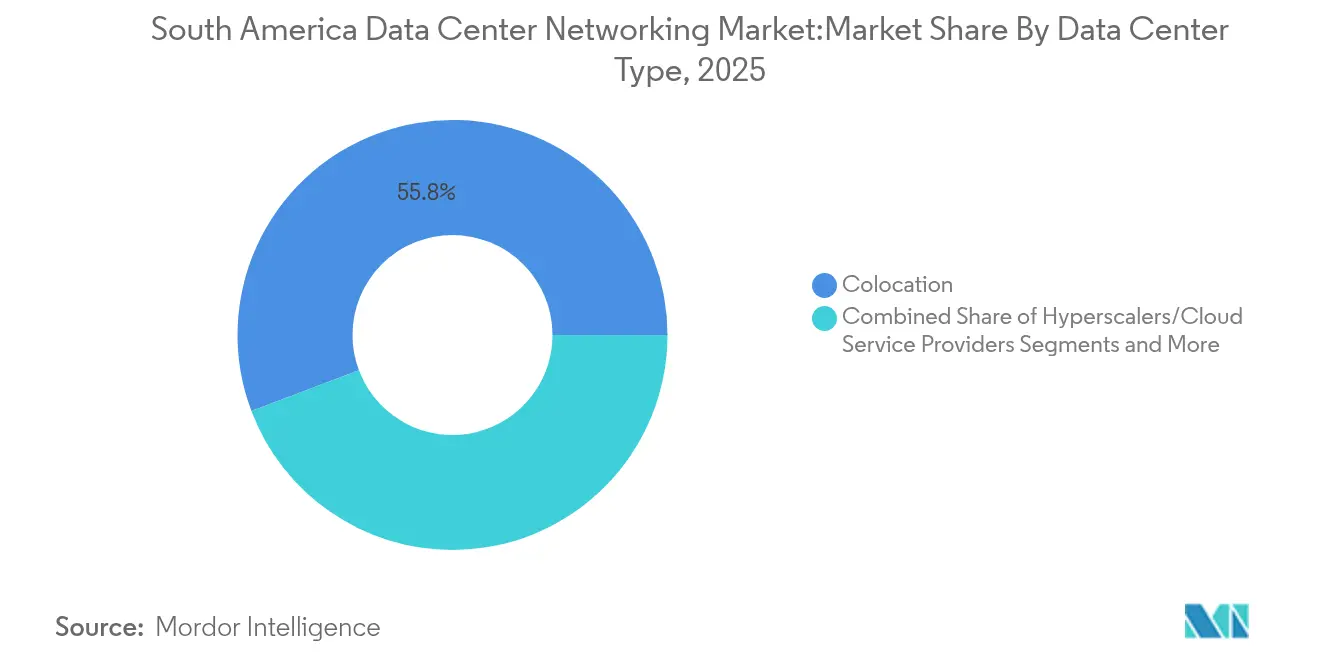
- By data-center type, Colocation sites held 55.75% of 2025 capacity; Hyperscalers & Cloud Service Providers lead growth at a 13.12% CAGR to 2031.
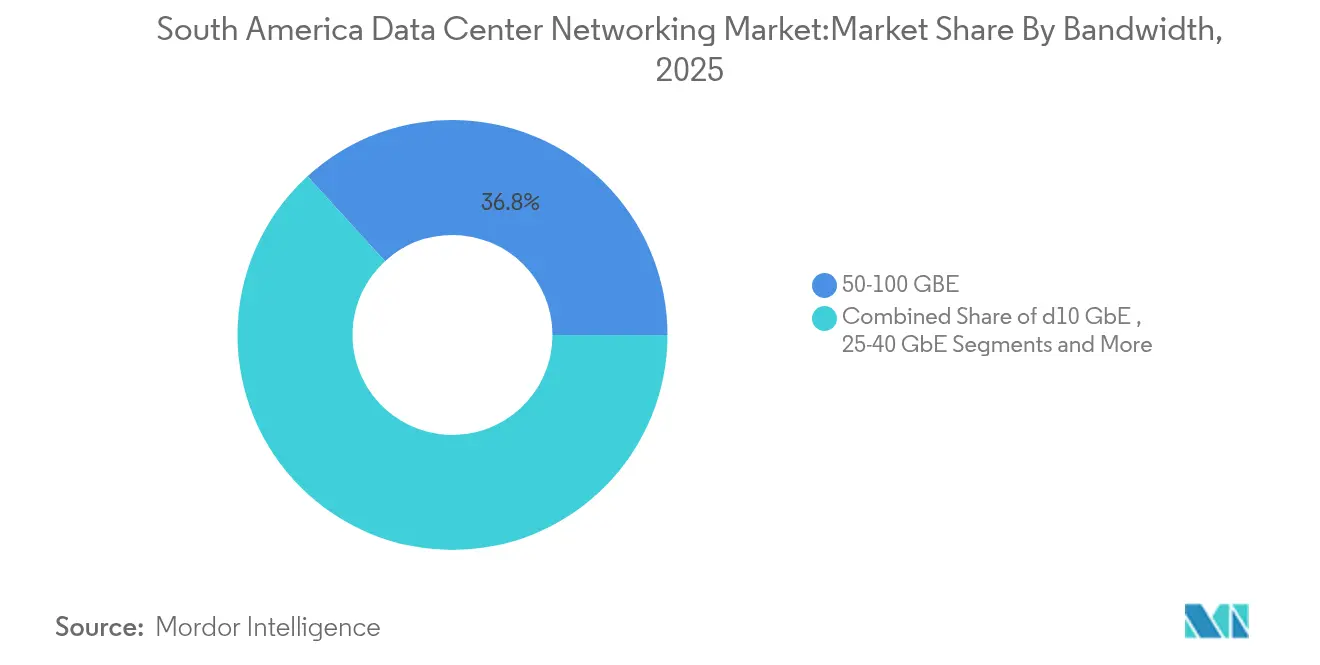
- By bandwidth, 50-100 GbE led with 36.78% of the South America data center networking market share in 2025, whereas greater than 100 GbE is forecast to post a 12.32% CAGR through 2031.
- By Country, Brazil led with 25.08 % of the South America data center networking market share in 2025, whereas Argentina is forecast to post a 11.02% CAGR through 2031.
Note: Market size and forecast figures in this report are generated using Mordor Intelligence’s proprietary estimation framework, updated with the latest available data and insights as of 2026.
Market Trends and Insights
Drivers Impact Analysis of South America Data Center Networking Market*
| Driver | ( ~ ) % Impact on CAGR Forecast | Geographic Relevance | Impact Timeline |
|---|---|---|---|
| Increasing need for cloud storage and reliable application performance | +2.8% | Brazil, Chile, Colombia, Argentina | Medium term (2-4 years) |
| Rising cyber-attacks among enterprises | +2.1% | Brazil & Argentina financial centers | Short term (≤ 2 years) |
| Proliferation of hyperscale data-center builds by global cloud providers | +3.2% | Brazil primary, Chile secondary | Medium term (2-4 years) |
| Surge in submarine-cable landings enabling low-latency coastal hubs | +1.8% | Brazil, Chile, Argentina | Long term (≥ 4 years) |
| Brazil’s renewable-energy incentives for green networking upgrades | +1.1% | National, early São Paulo clusters | Long term (≥ 4 years) |
| Adoption of open networking (white-box + SONiC) cutting CAPEX | +1.5% | Brazil, Chile | Medium term (2-4 years) |
| Source: Mordor Intelligence | |||
Increasing need for cloud storage and reliable application performance
Enterprises are shifting mission-critical workloads to cloud platforms, which raises throughput and latency requirements inside regional facilities. Banco Itaú’s program to move all core systems to the cloud by 2028 typifies the demand spike, prompting carriers to light new 400G and 800G links. Cirion Technologies has already demonstrated a 1.6 Tb/s single-carrier wavelength between São Paulo and Santiago, proving that optical backbones can stay ahead of AI-era traffic.[1]StockTitan, “Cirion Completes 1.6 Tb/s Trial,” stocktitan.net Storage performance is equally vital for hybrid deployments that synchronize on-premises and cloud repositories in real time.
Rising cyber-attacks among enterprises
Latin-American companies now record 2,569 attacks per week—40% above the global average—pushing CISOs to buy next-generation firewalls, secure SD-WAN, and AI-augmented threat analytics. Mutual Ser EPS, a Colombian insurer, adopted Fortinet’s FortiGate appliances to harden more than 50 branch locations that run multi-cloud applications.[2]Fortinet, “Mutual Ser EPS Secures Multi-Cloud,” fortinet.com Budgets are shifting fast; half of regional firms allocate between USD 10 million and USD 49 million annually to cybersecurity controls
Proliferation of hyperscale data-center builds by global cloud providers
Amazon is placing USD 4 billion in a new Chilean cloud region that comes online in 2026, while AWS and Microsoft combined invested USD 4.5 billion in Brazilian expansions during 2024.[3]BNamericas, “Banco Itaú Cloud Migration Roadmap,” bnamericas.comEach deployment requires leaf-spine fabrics using 25–100 GbE links for general compute and >100 GbE for AI clusters, triggering multi-year hardware refresh cycles at carrier hotels and metro backbones
Surge in submarine-cable landings enabling low-latency coastal hubs
Google’s trans-Pacific cable and Cirion’s SAC2 system are elevating Valparaíso and Fortaleza into latency-sensitive exchange points. Fortaleza now hosts 16 live cables, letting operators deliver sub-60 ms round-trip times to Miami, Luanda, and Lisbon. These facilities deploy dense optical cross-connects and automated fiber monitoring to handle traffic peaks during live-stream events and gaming launches.
Restraints Impact Analysis of South America Data Center Networking Market*
| Restraint | ( ~ ) % Impact on CAGR Forecast | Geographic Relevance | Impact Timeline |
|---|---|---|---|
| Increasing network complexity | −1.8% | Brazil & Chile enterprises | Short term (≤ 2 years) |
| High import tariffs and CAPEX for advanced equipment | −2.3% | Argentina, Colombia | Medium term (2-4 years) |
| Shortage of automation-skilled network engineers | −1.6% | Region-wide | Medium term (2-4 years) |
| Fragmented data-sovereignty regulations | −1.4% | Multinationals | Long term (≥ 4 years) |
| Source: Mordor Intelligence | |||
Increasing network complexity
Hybrid-cloud overlays, east-west microsegmentation, and edge bursts expose skill gaps. Enterprises deploying intent-based controllers face multi-vendor API sprawl that strains thin NOC teams. Lack of trained staff delays 400G adoption schedules, inflates consulting reliance, and limits achievable automation depth.
High import tariffs & CAPEX for advanced equipment
Tariffs pushing costs 8–20% higher for routers and leaf switches persuade smaller operators to extend life cycles rather than embrace 800G optics. Brazil’s ex-tariff program counters part of this penalty by exempting 1,495 ICT SKUs from duties, accelerating availability of AI-optimized NICs that are not manufactured domestically.
*Our forecasts treat driver/restraint impacts as directional, not additive. The impact forecasts reflect baseline growth, mix effects, and variable interactions.
South America Data Center Networking Market Segment Analysis
By Component:
Services Accelerate Despite Hardware DominanceProducts anchored 75.63% of 2025 revenue, reflecting heavy outlays on switches, routers, optical transponders, and security appliances that form the bedrock of every data center networking market deployment. Ethernet leaf–spine upgrade cycles shift from 25G/100G toward 400G class, while modular routers integrate SR-MPLS for simplified underlay automation. Vendors synchronize switch ASIC roadmaps with merchant-silicon breakthroughs to meet latency budgets of AI clusters running RDMA over Converged Ethernet.Services expand at an 11.49% CAGR, fueled by managed SDN controllers, lifecycle automation, and white-glove zero-trust overlays for enterprises lacking in-house skill sets. Consulting arms of OEMs bundle network-as-code blueprints plus DevNet-style training that compress deployment lead times. Regional MSPs carve niches by delivering multicloud connectivity hand-offs and ISO 27001-aligned managed detection and response, ensuring compliance across heterogeneous domiciles.



By End-User:
Manufacturing Disrupts Traditional IT LeadershipIT & Telecommunications kept a 36.89% revenue lead in 2025 as telco clouds virtualized core network slices and OTT video platforms cached near-edge nodes. Banking retained multi-region active–active data stores to satisfy instant-payment directives, lifting demand for encrypted 100G MAC-sec ports. Yet Manufacturing & Industrial registers the fastest 11.88% CAGR as Industry 4.0 retrofits call for deterministic Ethernet, Time-Sensitive Networking, and private 5G gateways linking PLCs to fog servers. Mining consortia run tele-remote haulage over Cisco URWB links under 10 ms RTT, demonstrating ruggedized optical rings that survive high-vibration pits. Automotive plants spearhead open networking pilots that enforce vendor-agnostic telemetry on CAN-bus digital twins feeding cloud AI quality-control engines.
By Data-Center Type:
Hyperscalers Reshape Market DynamicsColocation halls comprised 55.75% of live footprint in 2025 and remain pivotal for latency-sensitive metro peering. Neutral facilities diversify with renewable PPAs and sovereign-cloud enclaves to shield regulated customer data. Still, hyperscalers log a 13.12% CAGR as Amazon, Microsoft, and Google pour more than USD 10 billion into South American regions between 2024-2025, architecting multistorey campuses wired at 25/50 kV feeds. The data center networking market share for hyperscalers will approach 40.60% by 2031 as tenants chase predictable cloud availability zones.Scala Data Centers’ planned 4.7 GW AI City in Porto Alegre will rely on fabric switches delivering 64 x 800G ports per chassis for NVLink mesh backplanes that host LLM inference farms. Edge and micro-modular sites spring up along cable landing beaches, where <1 MW pods terminate 800G coherent optics into coastal IPoDWDM supernodes.
By Bandwidth:
High-Speed Connectivity Drives InnovationPorts above 100 GbE exhibit a 12.32% CAGR as training clusters traverse 1.6 Tb/s trunks over 800G DR4+ optics. Conversely, 50-100 GbE continues as the largest slice at 36.78% given its balance of price-per-gig and backward compatibility. The data center networking market size for >100 GbE ports is forecast to hit USD 624.37 million in 2031, underscoring AI and HPC momentum. RoCE v2 acceleration and PFC-free transport shape topological decisions, while IPoDWDM collapses gray optics to curb power envelopes.Legacy ≤10 GbE links linger in branch DCs and archival backup segments that tolerate higher oversubscription. Mid-tier 25-40 GbE lines underpin edge deployments where workloads burst unpredictably yet remain smaller than core-DC AI jobs.
Geography Analysis
Brazil Data Center Networking Market
Brazil led with 25.08 % of the South America data center networking market share in 2025. São Paulo state concentrates 427.5 MW live draw and another 672 MW in build or planning, propelled by USD 2.7 billion from Microsoft and USD 1.8 billion from AWS. Brazil’s tax-exempt ex-tariff roster accelerates uptake of switch ASICs otherwise unavailable domestically, giving the data center networking market a cost buffer during currency swings. Fortaleza’s 16 cable landings transform Ceará into a continental traffic exchange, reducing round-trip latency to Miami below 55 ms.
South America Data Center Networking Market
Chile rises as a Pacific data-hub candidate backed by December 2024’s National Data Centers Plan, pledging USD 2.5 billion in incentives plus expedited environmental approvals. Amazon’s USD 4 billion Santiago cloud region, slated to go live in 2026, will couple with Google’s trans-Pacific Topaz cable to anchor latency-sensitive trade between Latin America and Asia. Equinix’s USD 130 million Santiago IBX further diversifies operator choices and fosters neutral caching clusters atop 100% renewable power.Argentina is forecast to post a 11.02% CAGR through 2031. Argentina’s national digital-health grid on Red Hat OpenShift scaled transaction volumes 15× in under two years, showcasing demand for scalable underlay fabrics Red Hat. Colombia’s fintech surge and submarine-fiber additions spur adoption of AES-256 MAC-sec for compliance, even as peso volatility and tariff overhead dilute smaller ISPs’ capex budgets. Both nations work on harmonizing cybersecurity statutes to lure multinational tenants wary of fragmented oversight.
Regulatory Landscape
South America remains a patchwork of tax, investment, and data policy frameworks that affect data center networking capex and deployment timing. In Brazil, the ReData tax regime (PL 278/2026, building on MP 1.318/2025) introduced federal tax suspensions on select machinery and construction inputs used in data centers, complementing the existing ex-tariff approach for ICT imports and supporting higher-throughput switching, routing, and optical upgrades. Chile is operating under the National Data Center Plan 2024-2030, which includes technical guidance for critical permits and helps standardize project approval requirements for new buildouts and network expansions.
Cross-border connectivity and localization considerations also influence network architecture decisions for multinational tenants. In Brazil, Google has advocated for a unified regulatory framework for submarine cables, including support for PL 270 tied to a National Policy for Submarine Cable Infrastructure (PNICS), relevant for coastal hubs and interconnection-heavy designs. In Argentina, discussion around the Super RIGI framework includes local purchasing and supplier-development requirements that are positioned to attract large-scale data center investment, which can add compliance steps affecting vendor selection, sourcing, and lead times for advanced networking equipment.
Competitive Landscape
Market concentration remains moderate as entrenched global vendors face white-box commoditization pressures. Cisco, Juniper, and Arista dominate leaf-spine orders, yet Arista’s 27.6% revenue jump to USD 2.005 billion in Q1 2025 underscores demand for its AI-centric 800G platforms. Juniper expands Apstra intent-based fabric blueprints for multi-vendor SONiC estates, while Cisco integrates line-rate AES-256 MAC-sec on 51.2T ASICs and reports USD 8.252 billion Americas revenue in Q1 FY25.
Dell Technologies wins share through open-networking bundles pairing PowerSwitch with SONiC, highlighted by SKY Brazil’s deployment that cut provisioning cycles by 60%. Fortinet leverages regional threat upticks by converging NGFW, SD-WAN, and zero-trust network-access into ASIC-accelerated appliances such as the FortiGate 70G launched in February 2025. HPE couples Cray Slingshot interconnects with NVIDIA Blackwell GPUs in its June 2025 AI Factory blueprint for turnkey liquid-cooled clusters.
South America Data Center Networking Industry Leaders
Cisco Systems Inc.
Huawei Technologies Co. Ltd.
Juniper Networks Inc.
Hewlett Packard Enterprise Development LP
Arista Networks Inc.
- *Disclaimer: Major Players sorted in no particular order

South America Data Center Networking Market Companies Covered in this Report
- Cisco Systems Inc.
- Huawei Technologies Co. Ltd.
- Juniper Networks Inc.
- Hewlett Packard Enterprise Development LP
- Arista Networks Inc.
- Dell Technologies Inc. (Dell EMC)
- Extreme Networks Inc.
- Fortinet Inc.
- VMware Inc.
- NEC Corporation
- TP-Link Corporation Ltd.
- A10 Networks Inc.
- Radware Ltd.
- Moxa Inc.
- EdgeCore Networks Corp.
- Nokia Corp.
- FiberHome Telecommunication Technologies Co. Ltd.
- Check Point Software Technologies Ltd.
- Palo Alto Networks Inc.
- Ciena Corp.
- Mellanox Technologies Ltd. (NVIDIA)
- Super Micro Computer Inc.
- Ubiquiti Inc.
- NetScout Systems Inc.
- F5 Inc.
Read Analysis of South America Data Center Networking Companies

Market Opportunities and Future Outlook
Policy and infrastructure programs underway across Brazil, Chile, and Argentina create room for high-speed optical transport, spine-leaf switching refreshes, and network security modernization across new campuses and interconnection corridors. Brazil's ReData tax regime and established ex-tariff mechanisms reduce effective costs for imported advanced ICT and data center inputs, which supports faster adoption of 400G/800G-class switching and coherent optics in hyperscale and colocation facilities. In Chile, the National Data Center Plan 2024-2030 and the buildout cycle around new cloud regions and cable-linked coastal hubs support metro-scale fabrics, carrier-grade DCI, and automated operations tooling that helps manage complexity as networks scale.
A second opportunity cluster is taking shape around neutral connectivity and local supply-chain enablement, reducing deployment friction for multi-site and cross-border architectures. Conecta Infra's announced USD 350 million plan to deploy 6,000 km of neutral fiber through 2028 to interconnect major data center hubs in Argentina, Chile, and Brazil supports demand for optical interconnects, IPoDWDM, and secure inter-DC routing at scale. On the supply side, Corning is moving to establish local production of pre-connectorized fiber solutions in Brazil, improving availability for data center rollouts across Brazil, Colombia, Argentina, and Peru. Campus investments such as Ada Infrastructure's GRU10 project in the Sao Paulo metro area (R$2.7 billion planned through 2030) also expand addressable demand for switching, routing, structured cabling, and security appliances delivered with integration and managed services.
Recent Industry Developments in South America Data Center Networking Market
- July 2026: Huawei opened a new Huawei Cloud region in Chile to support AI services, with reporting citing a target of around 20 ms domestic latency. The buildout increases requirements for high-capacity leaf-spine fabrics, DCI, and security controls within national borders, supporting enterprise and public-sector cloud adoption in the region.
- June 2026: Huawei reported expansion of its data center capacity in Argentina to meet cloud and AI service demand, while continuing to evaluate additional footprint. The added capacity increases near-term demand for high-bandwidth switching, optical interconnects, and automated operations as operators scale east-west traffic for AI-oriented workloads.
- March 2026: Conecta Infra announced a USD 350 million investment to deploy about 6,000 km of fiber by 2028, targeting interconnection of major data center hubs across Argentina, Chile, and Brazil. The neutral backbone expands options for low-latency inter-DC connectivity and supports multi-cloud architectures that depend on resilient metro and long-haul transport.


South America Data Center Networking Market Report Scope and Research Methodology
Market Definition and Coverage
This market covers networking equipment, software, and related services that are deployed in data centers to connect servers, storage, and external networks, and to operate, secure, and manage traffic across these environments in South America.
Scope exclusions: We exclude enterprise campus networking that is not deployed for a data center environment, and we exclude telecom carrier core network equipment that is not sold for data center use.
Segments Covered in This Report
- By Component
- Products
- Ethernet Switches
- Routers
- Storage Area Network (SAN)
- Application Delivery Controllers (ADC)
- Network Security Appliances
- Software-Defined Networking (SDN) Controllers
- Optical Interconnects
- Services
- Installation and Integration
- Training and Consulting
- Support and Maintenance
- Managed Network Services
- Products
- By End-User
- IT and Telecommunications
- Banking, Financial Services and Insurance (BFSI)
- Government and Defense
- Media and Entertainment
- Healthcare and Life Sciences
- Manufacturing and Industrial
- Other End-Users
- By Data-Center Type
- Colocation
- Hyperscalers/Cloud Service Providers
- Edge/Micro Data Centers
- By Bandwidth
- Less than or Equal to 10 GbE
- 25-40 GbE
- 50-100 GbE
- Greater than 100 GbE
- By Country
- Brazil
- Mexico
- Argentina
- Rest of South America
Data Sources, Market Sizing, and Validation
Desk Research
Desk research was used to build the initial demand picture and to set the country context before the model was finalized. We reviewed public indicators that connect directly to data center build activity and network upgrades, so the sizing work starts from measurable signals rather than loose assumptions.
Sources were taken from reputable, non paywalled references such as ITU statistics, World Bank macro series, national telecom regulators and digital ministries across the region, customs and trade statistics portals, and energy regulator or grid operator publications that reflect large load additions. We also used company filings, earnings decks, investor presentations, and credible press coverage to time capex cycles, and then validated select company level signals through paid subscriptions for company financials and news, plus a paid patent database for directional checks. The desk sources listed here are illustrative, and many other public documents were also used for collection, cross checks, and clarification.
Primary Interviews and Surveys
We use expert interviews and surveys with data center operators, networking distributors, integrators, cloud infrastructure teams, and enterprise technology managers in South America. Their feedback tests equipment mix, replacement timing, bandwidth demand, service attachment, and pricing assumptions, while helping close gaps in public trade and capacity records. Conflicting answers are reviewed before final analysis.
Distribution of primary research fieldwork respondents
| Company type | Respondent position |
|---|---|
| Top tier: 29% | CXOs: 20% |
| Mid tier: 46% | Functional/Unit leaders: 31% |
| Smaller Players: 25% | Managers: 49% |
Market-Sizing & Forecasting
Sizing starts with a top-down reconstruction of data center networking spend by linking active and planned data center footprint to typical network architectures and refresh cycles across the region. For each country group, we mapped build and upgrade signals, then applied mix assumptions for ethernet switching, routing, storage networking, application delivery, and services. Those mix assumptions are finalized only after deployment intensity and product mix are aligned.
Key inputs used in the model include the pace of new data center capacity coming online, server and storage density expectations, port speed migration (such as 10G to 25G and 100G), average selling price movement by bandwidth class, and the share of projects routed through integrators versus direct procurement. We also track import reliance and currency movement as practical adjusters because much of the equipment is traded and typically priced in USD. Forecasting is built using scenario analysis supported by a light multivariate regression overlay, where drivers like capacity additions, cloud adoption signals, and replacement cycles are stressed, then reconciled with what interviewees expect for budgets and lead times.
Selective bottom-up approximations are used to validate and adjust totals, such as sampled ASP times estimated unit volumes for switch ports and router interfaces, plus channel checks on services attach rates. When country or channel visibility is limited, the gap is handled through ratio based allocation anchored to observed demand indicators, and then it is rechecked during the validation step.
Data Validation & Update Cycle
Outputs are checked in multiple steps so the totals remain consistent with independent signals. We compare model results with data center commissioning timelines, trade flows for relevant equipment categories, and observed price ranges by bandwidth class, and then investigate any sharp swings that do not match installation patterns.
Before sign off, the model goes through an internal peer review, followed by targeted re contact with respondents when a key assumption changes the market materially. Reports are refreshed annually, and interim updates are made when major build announcements, import related policy changes, or sudden FX moves shift purchasing behavior. Right before delivery, an analyst performs a fresh pass so clients receive the latest view that still traces back to repeatable steps.
Mordor Intelligence's South America Data Center Networking Market Estimate Compared With Other Published Estimates
Published estimates for this market can look far apart because the counted spend is not always defined the same way, even when the market title sounds similar. Differences also come from how pricing is treated in USD during volatile FX periods, and whether the estimate leans more on shipment based signals or on installed base refresh patterns.
In South America, the biggest gaps usually show up around what is included under services, whether managed network services are counted inside the core number, and how much adjacent enterprise networking gets pulled into data center spend through shared channels. Another split comes from how quickly 25G and 100G ports are assumed to replace older speeds, which can shift both unit volumes and ASP paths in the same year.
Benchmark comparison
| Source | Market Size | Gaps in Research Methodology |
|---|---|---|
| Mordor Intelligence | USD 0.88 B (2025) | |
| Regional Consultancy A | USD 1.06 B (2025) | This figure appears to include a wider services bucket, especially managed network operations, and it may also pull in some non data center enterprise switching sold through the same distribution routes. |
| Industry Association B | USD 0.74 B (2025) | This estimate seems to focus mainly on hardware shipments and a narrower set of network device types, which can undercount integration, support, and maintenance spend. |
Across the three figures, the spread is best explained by scope control for services and by how port speed migration is timed in the model, with managed services and non data center enterprise networking kept out of scope, a filtering step applied by Mordor Intelligence.


Key Questions Answered in the Report
What is the current value of the South America data center networking market?
The market is valued at USD 0.98 billion in 2026 and is projected to reach USD 1.68 billion by 2031.
Which component segment is growing fastest?
Services are expanding at an 11.49% CAGR, driven by managed SDN, automation consulting, and skill-gap outsourcing.
Why are Manufacturing & Industrial users adopting data center networking solutions rapidly?
Industry 4.0 initiatives, ultra-low-latency control loops, and private 5G deployments push Manufacturing & Industrial toward a forecast 11.88% CAGR.
Which bandwidth tier is expected to dominate by 2031?
Links above 100 GbE, tied to AI and HPC workloads, will post a 12.32% CAGR, although 50-100 GbE remains the largest share through the forecast horizon.
Page last updated on:
- Artificial Intelligence (AI) Data Center Market AI facilities across the global market, covering facility type, component and tier.
- Data Center Server Market Global servers demand, split by tier, facility size and facility type.
- Data Center Power Market Power systems across all regions, split by component, tier and facility size.
- South America Hyperscale Data Center Market South America hyperscale sites, split by facility type, component and tier.
- South America Data Center Construction Market South America construction, split by tier.
- South America Data Center Server Market South America's servers, split by facility size and tier.
- South America Data Center Power Market Power systems demand across South America, covering power infrastructure, end user and power capacity range.
- South America Artificial Intelligence (AI) Data Center Market AI facilities demand across South America, covering facility type, component and tier.
- North America Artificial Intelligence (AI) Data Center Market AI facilities in North America, split by facility type, component and tier.





