Market Overview
| Study Period | 2018 - 2031 |
|---|---|
| Forecast Data Period | 2026 - 2031 |
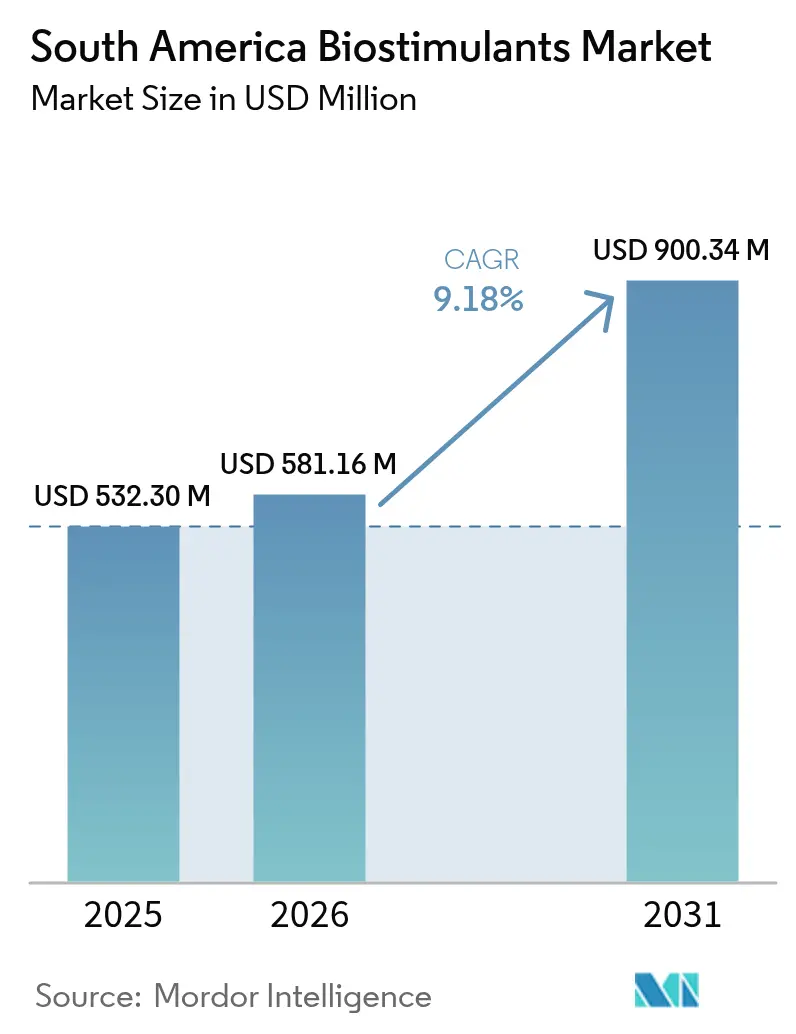
| Base Year Market Size (2025) | USD 532.30 Million |
| Market Size (2026) | USD 581.16 Million |
| Market Size (2031) | USD 900.34 Million |
| Growth Rate (2026 - 2031) | 9.18% CAGR |
| Market Concentration | Low |
Major Players *Disclaimer: Major Players sorted in no particular order Image © Mordor Intelligence. Reuse requires attribution under CC BY 4.0. | |
South America Biostimulants Market Analysis by Mordor Intelligence
The South America biostimulants market size was valued at USD 532.30 million in 2025 and estimated to grow from USD 581.16 million in 2026 to reach USD 900.34 million by 2031, at a CAGR of 9.18% during the forecast period (2026-2031). Accelerated soybean acreage growth in Brazil and Argentina, along with stricter retailer sustainability mandates, is driving large‐scale replacement of conventional crop inputs with bio‐based products. Retailers’ residue limits and premium pricing have spurred farmers to adopt seaweed extracts that improve tolerance to drought and heat stress, especially during volatile El Niño–La Niña cycles. Venture capital inflows surpassing USD 50 million in 2024 are fast‐tracking new product launches, while Chilean and Peruvian coastal bio‐refineries have cut seaweed extract production costs by more than 15%, broadening access for price‐sensitive growers. Regulatory harmonization is progressing Brazil’s Law 15070/2024 and Argentina’s National Service of Agri-Food Health and Quality (SENASA) Resolution 458/2025 now shorten registration lead times, lowering entry barriers for both regional innovators and global agrochemical firms.
Key Report Takeaways
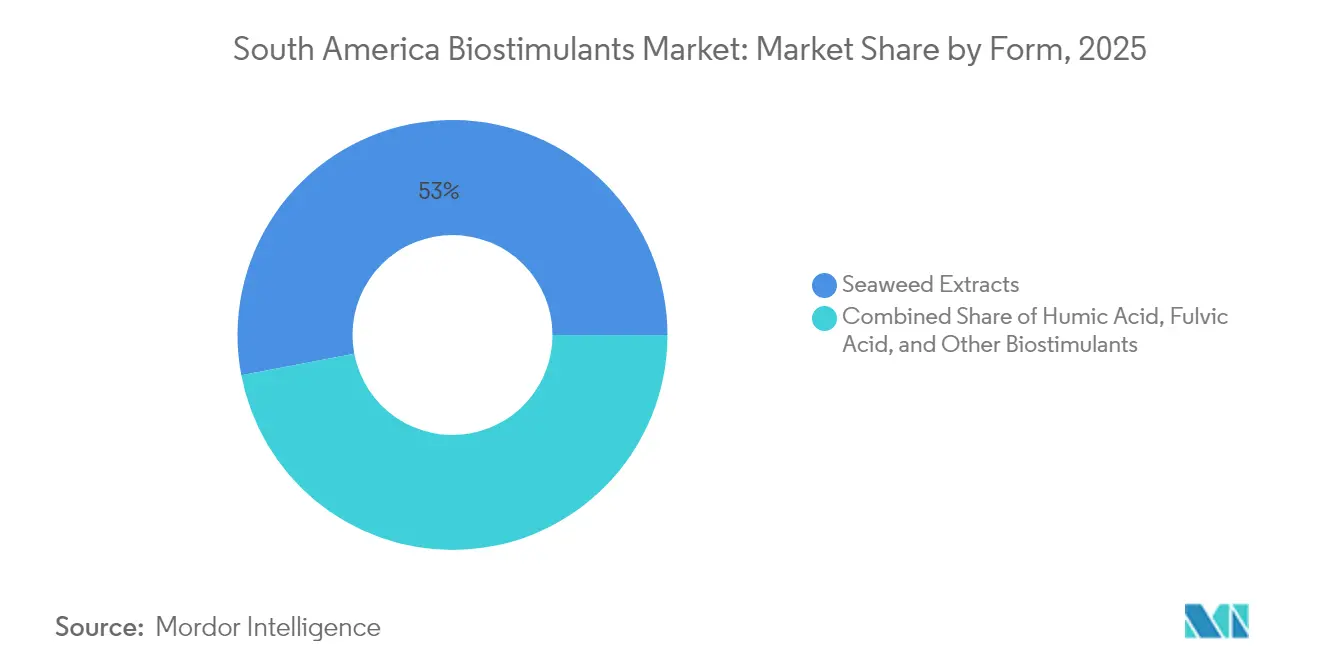
- By form, seaweed extracts held 53.00% of the South America biostimulants market share in 2025. In contrast, Amino Acids are forecast to expand at a 10.86% CAGR to 2031.
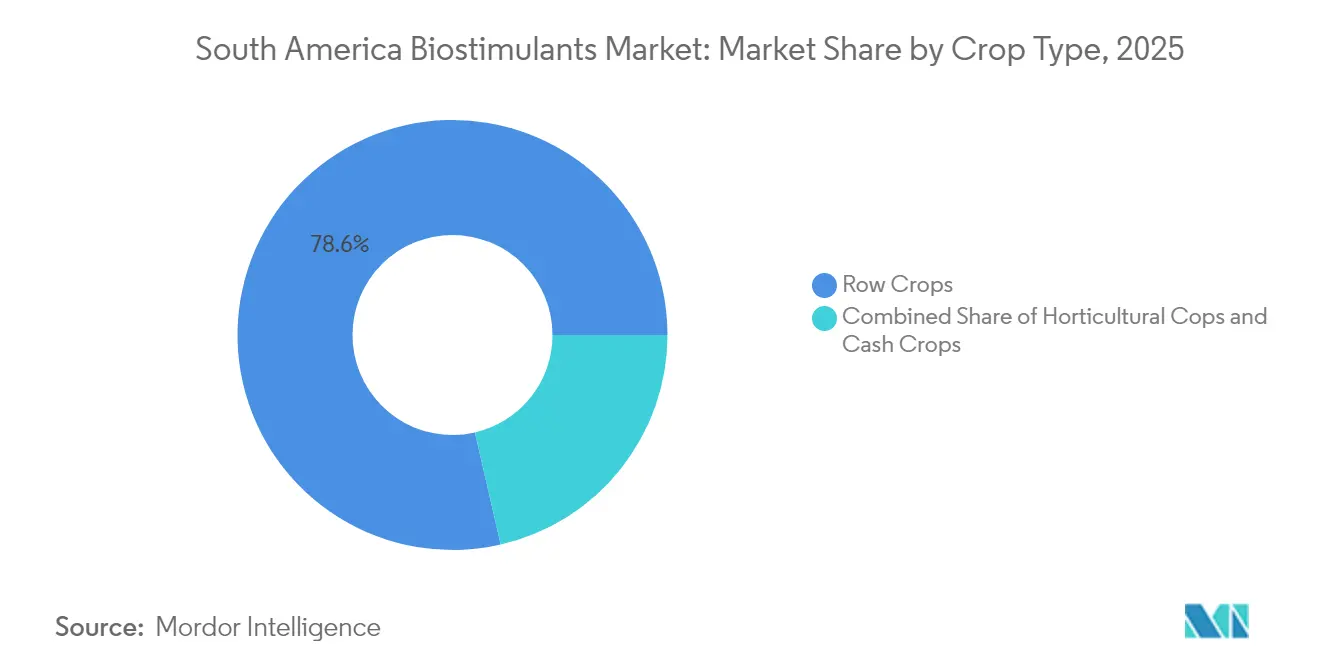
- By crop type, row crops accounted for 78.60% of the South America biostimulants market size in 2025 and are forecast to expand at a 9.05% CAGR to 2031.
- By geography, Brazil led with a 63.72% revenue share in 2025, while Argentina is set to grow at a 9.62% CAGR through 2031.
Note: Market size and forecast figures in this report are generated using Mordor Intelligence’s proprietary estimation framework, updated with the latest available data and insights as of 2026.
South America Biostimulants Market Trends and Insights
Drivers Impact Analysis*
| Driver | (~) (%) Impact on CAGR Forecast | Geographic Relevance | Impact Timeline |
|---|---|---|---|
| Rapid expansion of soybean acreage in Brazil and Argentina | +2.1% | Brazil and Argentina | Medium term (2–4 years) |
| Shift toward sustainable inputs driven by retailer procurement standards | +1.8% | Export-oriented zones | Long term (≥4 years) |
| Enhanced crop-stress tolerance from seaweed-based formulations | +1.5% | Drought-prone areas | Medium term (2–4 years) |
| Government subsidies for carbon-efficient farming practices | +1.2% | Brazil and Chile | Long term (≥4 years) |
| Emergence of coastal bio-refineries lowering seaweed extract costs | +1.4% | Chile and Peru, with spillover to Brazil | Medium term (2–4 years) |
| Growing venture investment in biological ag-tech start-ups | +1.3% | Urban tech hubs feeding rural demand | Short term (≤2 years) |
| Source: Mordor Intelligence | |||
Rapid Expansion of Soybean Acreage in Brazil and Argentina
Brazil lifted soybean plantings 2.8% to 45.2 million ha in 2024, and Argentina added 7%, extending cultivation into more marginal soils that require biological support[1]Source: USDA Foreign Agricultural Service, “Brazil Oilseeds and Products Annual Report 2024,” fas.usda.gov. Growers are adopting seaweed and amino-acid blends to maintain yields while reducing chemical fertilizer run-off that threatens export certifications. Demonstration plots in the Cerrado and Pampas show yield uplifts of 6–10 bushels per acre when biostimulants are included in starter programs. Rapid regulatory clearance under Brazil’s Law 15070/2024 trims product launch windows from 18 months to 12 months, letting suppliers scale alongside the acreage boom[2]Source: Government of Brazil, “Lei 15.070/2024 – Marco Regulatório dos Insumos Biológicos,” gov.br. Dealers report that bundled seed-treatment packages combining inoculants and seaweed stimulants now outsell conventional inoculants two to one in expansion zones.
Shift Toward Sustainable Inputs Driven by Retailer Procurement Standards
The European Union deforestation regulation covers USD 23.2 billion in South America exports and requires audited low-residue production methods[3]Source: European Commission, “EU Deforestation Regulation Implementation,” ec.europa.eu. Brazilian crushers and Argentine exporters pay premiums of 15–20% for soy lots certified as biostimulant-treated, creating a direct price signal at farm level. Food processors track inputs through digital ledgers, so growers that cannot verify biological usage risk contract loss. Large cooperatives in Mato Grosso responded by writing seaweed extracts into their agronomy protocols, driving bulk-purchase discounts that pull smaller growers into the same system. As compliance deadlines tighten in 2027, adoption momentum is anticipatedto spread into corn, cotton, and sugarcane rotations that share logistics with soybean supply chains.
Enhanced Crop-Stress Tolerance From Seaweed-Based Formulations
Seaweed extracts rich in cytokinins and betaines lift drought-stressed soybean yields 12–18% in Brazilian trials and cut heat damage 25% in Argentina’s Pampas during 2024’s record temperature spikes. Farmers report greener canopies and firmer pods during late-season dry spells, tangible signs that encourage repeat purchases. The extracts also improve salinity tolerance in coastal vegetable belts and reduce heavy-metal uptake near mining districts, broadening their agronomic appeal. Bio-refineries in Chile and Peru now concentrate active compounds 40% more than legacy methods, letting growers spray lower volumes without sacrificing efficacy. With meteorologists forecasting stronger La Niña conditions in 2026, demand for stress-mitigating formulations is poised to accelerate further.
Government Subsidies for Carbon-Efficient Farming Practices
Brazil’s ABC Plan supplies BRL 5 billion (USD 900 million) in subsidized credit each year for farmers who cut synthetic input use by at least 15%[4]Source: Brazilian Development Bank, “Programa Nacional de Apoio ao Crédito Rural – ABC,” bndes.gov.br. Approved biological packages receive interest rates 35–40 basis points below conventional loans, lowering total production costs on everything from soy to citrus. Chile’s tax rebates enable farms to deduct up to 30% of biological input spending, and early adopters have already claimed savings that offset application costs. Verified carbon reductions earn growers USD 15–25 per metric ton of CO₂ on voluntary markets, producing an extra revenue layer that local banks now count in cash-flow models. These financial levers combine to shorten payback periods to fewer than two harvests for most row-crop operations.
Restraints Impact Analysis*
| Restraint | (~) (%) Impact on CAGR Forecast | Geographic Relevance | Impact Timeline |
|---|---|---|---|
| Absence of harmonized biostimulant registration across South America | −1.4% | Region-wide | Long term (≥4 years) |
| Low farmer awareness of return-on-investment metrics | −1.1% | Rural areas | Medium term (2–4 years) |
| Supply volatility in seaweed raw material due to climate events | −0.8% | Chile and Peru | Short term (≤2 years) |
| High import tariffs on specialty amino-acid inputs in Argentina | −0.6% | Argentina | Medium term (2–4 years) |
| Source: Mordor Intelligence | |||
Absence of Harmonized Biostimulant Registration Across South America
Distinct approval tracks in Brazil, Argentina, and Chile raise compliance costs to 300% for firms registering the same formulation across borders. Smaller companies often lack the cash to finance multiple residue and efficacy trials, delaying product introductions for two to three years. Divergent labeling rules add further complexity, forcing localized packaging that drives inventory overhead. Cross-border distributors shy away from carrying unapproved products, limiting market reach. Industry associations lobby for mutual recognition, but progress remains slow, keeping friction high through the forecast period.
Low Farmer Awareness of Return-on-Investment Metrics
Only 35% of growers can calculate biostimulant payback compared with 78% for synthetic fertilizers, a gap attributed to limited extension services and lab access. Benefits like improved soil biology accrue over multiple harvests, which does not align with season-to-season budgeting. Technical jargon around hormone pathways and microbial modes of action often confuses non-specialist farmers. Few cooperatives offer field days that isolate biological effects, making word-of-mouth adoption slow. Until inexpensive diagnostics or guarantee programs become widespread, ROI uncertainty will hold back full-scale uptake.
*Our forecasts treat driver/restraint impacts as directional, not additive. The impact forecasts reflect baseline growth, mix effects, and variable interactions.
Segment Analysis
By Form: Seaweed Extracts Extend Leadership as Costs Fall
Seaweed extracts accounted for 53.00% of the South America biostimulants market share in 2025 as growers turned to their well-documented stress mitigation capabilities. Rapid cost declines from enzymatic extraction have opened the segment to commodity crops, pushing adoption beyond premium horticulture. Amino-acid formulations are projected to record an 10.86% CAGR through 2031 as growers recognize their role in protein synthesis and metabolic recovery. Humic and fulvic acids sustain niche demand in acidic soils of Brazil’s Cerrado, while protein hydrolysates gain momentum in Argentina’s high-intensity rotations.
Seaweed extracts will remain the backbone of soybean programs, yet differentiated amino-acid blends should capture share in intensive vegetable operations that demand quick stress reversal. Regulations under Law 15070/2024 and National Service of Agri-Food Health and Quality (SENASA) 458/2025 favor proven categories, such as seaweed extracts, but emerging microbial inoculants will gain traction once region-specific efficacy data build confidence. Continued investment in Chilean and Peruvian bio-refineries promises further cost relief and expanded application versatility.


By Crop Type: Row Crops Dominate on Export-Oriented Expansion
Row crops held 78.60% of the South America biostimulants market size in 2025 and will grow 9.05% annually to 2031, propelled by Brazil’s 45.2 million ha soybean base and Argentina’s acreage gains. Horticulture commands a smaller volume yet shows higher per-hectare input intensity, with adoption rates beyond 60% due to stricter quality benchmarks. Cash crops such as cotton and sugarcane are integrating biostimulants to satisfy sustainability certifications demanded by Europe and Asia.
Large-scale row-crop growers validate the performance of biological inputs through digital tools and third-party audits, thereby accelerating mainstream acceptance. Horticulture will continue to adopt premium amino-acid and microbial packages for rapid growth recovery and residue-free status. The adoption of cash crops hinges on cost-effective formulations that deliver both yield and quality improvements without increasing total input costs.
Geography Analysis
Brazil’s dominant 63.72% share of the South America biostimulants market in 2025 reflects unmatched scale, structured regulations, and robust financing channels that together encourage supplier investment. Farmers adopted biostimulants to secure European market premiums and mitigate input cost volatility. Biological sales reached BRL 5 billion (USD 900 million) and grew by 15% year-over-year. EMBRAPA’s decades-long research pipeline and retailer audits from Europe and Asia provide a steady scientific and commercial pull for new products.
Argentina’s 9.62% CAGR through 2031 is rooted in the 7% soybean acreage jump in 2024 and in farmers’ resolve to meet global sustainability metrics amid currency headwinds. Streamlined National Service of Agri-Food Health and Quality (SENASA) Resolution 458/2025 trimmed approval timelines to 12 months, sparking a wave of local formulation investments. Import tariffs of up to 35% on specialty amino acids created openings for domestic producers that can overcome raw-material gaps through technology transfer deals. The Pampas region, with its intense crop cycles, is the proving ground for new seaweed and amino-acid blends.
Chile, Colombia, and Peru together account for a modest yet rising share where specialized value chains drive adoption. Chile’s enzymatic extraction plants now ship higher-concentration extracts across the region, lowering farmers’ per-hectare costs and supporting advancements in both row-crop and horticulture programs. Colombia’s flower industry, already under strict international residue limits, achieves adoption rates exceeding 70% as growers chase premium export pricing. Peruvian fruit exporters incorporate biostimulants within integrated pest and nutrient programs to keep pace with expanding global demand. Each of these markets benefits from technology and capital flows originating in Brazil and Argentina, but fragmentation in local rules still impedes seamless product rollout.
Competitive Landscape
The South America biostimulants market remains highly fragmented, with the top five companies controlling only limited share of revenue, which leaves ample room for new entrants and niche specialists. Fragmentation is rooted in varied agro-ecological zones and complex national regulations that favor agile regional formulators over one-size-fits-all approaches. Many growers rely on trusted local agronomists, enabling small brands with strong technical service to outcompete larger firms lacking field presence.
Consolidation momentum is building. Biobest paid BRL 2.8 billion (USD 504 million) for 85% of Biotrop, instantly creating the region’s largest integrated biological platform. Syngenta completed four Brazilian takeovers in three years and spent USD 2.1 billion on a 140,000-strain microbe library to accelerate pipeline depth. FMC partnered with Ballagro to pair global chemistry expertise with local distribution networks, while UPL launched Nimaxxa, the first dual biostimulant-bionematicide registered in Brazil. Corteva earmarked USD 300 million for biological research and development centers, signaling strategic commitment rather than opportunistic diversification.
Competitive tactics hinge on supply-chain integration, formulation science, and data-driven agronomy. Chilean enzymatic refineries give certain brands a raw-material cost edge that they leverage through long-term offtake contracts with distributors. Brazilian startups like Genica and Puna Bio use rapid prototyping and region-specific microbes to address local soil challenges, often bundling apps that track leaf-level response for proof of performance. Multinationals focus on regulatory compliance portfolios that create entry barriers for smaller challengers, yet they also partner with cooperatives to secure distribution density. Field-support networks delivering weekly crop walks and tissue analyses remain decisive, as growers expect biological suppliers to act as technical allies rather than commodity vendors.
South America Biostimulants Industry Leaders
Biolchim SpA
Humic Growth Solutions Inc.
Koppert Biological Systems Inc.
Trade Corporation International
Vittia Group
- *Disclaimer: Major Players sorted in no particular order

Recent Industry Developments
- March 2025: Syngenta acquired Novartis’ repository of 140,000 microbial strains for USD 2.1 billion to expand its biological R & D footprint in South America.
- February 2025: UPL introduced Nimaxxa in Brazil, the first product to combine biostimulant activity with bionematicide traits for soybeans and corn.
- January 2025: FMC partnered with Ballagro on fungi-based biosolutions targeting Brazilian row crops.


South America Biostimulants Market Report Scope
A biostimulant is a substance applied to plants or soils that enhances plant growth, nutrient uptake, stress tolerance, and overall crop performance. The South America biostimulants market report is segmented by form: Humic Acid, Fulvic Acid, Amino Acids, Protein Hydrolysates, Seaweed Extracts, and other biostimulants; by crop type: Row Crops, Horticultural Crops, and Cash Crops; and by geography: Brazil, Argentina, and the rest of South America. The market forecasts are provided in terms of value (USD) and volume (Metric Tons).
Form
| Amino Acids |
| Fulvic Acid |
| Humic Acid |
| Protein Hydrolysates |
| Seaweed Extracts |
| Other Biostimulants |
Crop Type
| Cash Crops |
| Horticultural Crops |
| Row Crops |
Country
| Argentina |
| Brazil |
| Rest of South America |
| Form | Amino Acids |
| Fulvic Acid | |
| Humic Acid | |
| Protein Hydrolysates | |
| Seaweed Extracts | |
| Other Biostimulants | |
| Crop Type | Cash Crops |
| Horticultural Crops | |
| Row Crops | |
| Country | Argentina |
| Brazil | |
| Rest of South America |


Market Definition
- AVERAGE DOSAGE RATE - The average application rate is the average volume of biostimulants applied per hectare of farmland in the respective region/country.
- CROP TYPE - Crop type includes Row crops (Cereals, Pulses, Oilseeds), Horticultural Crops (Fruits and vegetables) and Cash Crops (Plantation Crops, Fibre Crops and Other Industrial Crops)
- FUNCTION - The Crop Protection function of agirucultural biological include products that prevent or control various biotic and abiotic stress.
- TYPE - Biostimulants boost crop growth and yield by preventing or controlling various abiotic stresses.
| Keyword | Definition |
|---|---|
| Cash Crops | Cash crops are non-consumable crops sold as a whole or part of the crop to manufacture end-products to make a profit. |
| Integrated Pest Management (IPM) | IPM is an environment-friendly and sustainable approach to control pests in various crops. It involves a combination of methods, including biological controls, cultural practices, and selective use of pesticides. |
| Bacterial biocontrol agents | Bacteria used to control pests and diseases in crops. They work by producing toxins harmful to the target pests or competing with them for nutrients and space in the growing environment. Some examples of commonly used bacterial biocontrol agents include Bacillus thuringiensis (Bt), Pseudomonas fluorescens, and Streptomyces spp. |
| Plant Protection Product (PPP) | A plant protection product is a formulation applied to crops to protect from pests, such as weeds, diseases, or insects. They contain one or more active substances with other co-formulants such as solvents, carriers, inert material, wetting agents or adjuvants formulated to give optimum product efficacy. |
| Pathogen | A pathogen is an organism causing disease to its host, with the severity of the disease symptoms. |
| Parasitoids | Parasitoids are insects that lay their eggs on or within the host insect, with their larvae feeding on the host insect. In agriculture, parasitoids can be used as a form of biological pest control, as they help to control pest damage to crops and decrease the need for chemical pesticides. |
| Entomopathogenic Nematodes (EPN) | Entomopathogenic nematodes are parasitic roundworms that infect and kill pests by releasing bacteria from their gut. Entomopathogenic nematodes are a form of biocontrol agents used in agriculture. |
| Vesicular-arbuscular mycorrhiza (VAM) | VAM fungi are mycorrhizal species of fungus. They live in the roots of different higher-order plants. They develop a symbiotic relationship with the plants in the roots of these plants. |
| Fungal biocontrol agents | Fungal biocontrol agents are the beneficial fungi that control plant pests and diseases. They are an alternative to chemical pesticides. They infect and kill the pests or compete with pathogenic fungi for nutrients and space. |
| Biofertilizers | Biofertilizers contain beneficial microorganisms that enhance soil fertility and promote plant growth. |
| Biopesticides | Biopesticides are natural/bio-based compounds used to manage agricultural pests using specific biological effects. |
| Predators | Predators in agriculture are the organisms that feed on pests and help control pest damage to the crops. Some common predator species used in agriculture include ladybugs, lacewings, and predatory mites. |
| Biocontrol agents | Biocontrol agents are living organisms used to control pests and diseases in agriculture. They are alternatives to chemical pesticides and are known for their lesser impact on the environment and human health. |
| Organic Fertilizers | Organic fertilizer is composed of animal or vegetable matter used alone or in combination with one or more non-synthetically derived elements or compounds used for soil fertility and plant growth. |
| Protein hydrolysates (PHs) | Protein hydrolysate-based biostimulants contain free amino acids, oligopeptides, and polypeptides produced by enzymatic or chemical hydrolysis of proteins, primarily from vegetal or animal sources. |
| Biostimulants/Plant Growth Regulators (PGR) | Biostimulants/Plant Growth Regulators (PGR) are substances derived from natural resources to enhance plant growth and health by stimulating plant processes (metabolism). |
| Soil Amendments | Soil Amendments are substances applied to soil that improve soil health, such as soil fertility and soil structure. |
| Seaweed Extract | Seaweed extracts are rich in micro and macronutrients, proteins, polysaccharides, polyphenols, phytohormones, and osmolytes. These substances boost seed germination and crop establishment, total plant growth and productivity. |
| Compounds related to biocontrol and/or promoting growth (CRBPG) | Compounds related to biocontrol or promoting growth (CRBPG) are the ability of a bacteria to produce compounds for phytopathogen biocontrol and plant growth promotion. |
| Symbiotic Nitrogen-Fixing Bacteria | Symbiotic nitrogen-fixing bacteria such as Rhizobium obtain food and shelter from the host, and in return, they help by providing fixed nitrogen to the plants. |
| Nitrogen Fixation | Nitrogen fixation is a chemical process in soil which converts molecular nitrogen into ammonia or related nitrogenous compounds. |
| ARS (Agricultural Research Service) | ARS is the U.S. Department of Agriculture's chief scientific in-house research agency. It aims to find solutions to agricultural problems faced by the farmers in the country. |
| Phytosanitary Regulations | Phytosanitary regulations imposed by the respective government bodies check or prohibit the importation and marketing of certain insects, plant species, or products of these plants to prevent the introduction or spread of new plant pests or pathogens. |
| Ectomycorrhizae (ECM) | Ectomycorrhiza (ECM) is a symbiotic interaction of fungi with the feeder roots of higher plants in which both the plant and the fungi benefit through the association for survival. |


Research Methodology
Mordor Intelligence follows a four-step methodology in all our reports.
- Step-1: Identify Key Variables: In order to build a robust forecasting methodology, the variables and factors identified in Step-1 are tested against available historical market numbers. Through an iterative process, the variables required for market forecast are set and the model is built on the basis of these variables.
- Step-2: Build a Market Model: Market-size estimations for the forecast years are in nominal terms. Inflation is not a part of the pricing, and the average selling price (ASP) is kept constant throughout the forecast period.
- Step-3: Validate and Finalize: In this important step, all market numbers, variables and analyst calls are validated through an extensive network of primary research experts from the market studied. The respondents are selected across levels and functions to generate a holistic picture of the market studied.
- Step-4: Research Outputs: Syndicated Reports, Custom Consulting Assignments, Databases & Subscription Platforms.


