
South Africa Grain Market Analysis by Mordor Intelligence
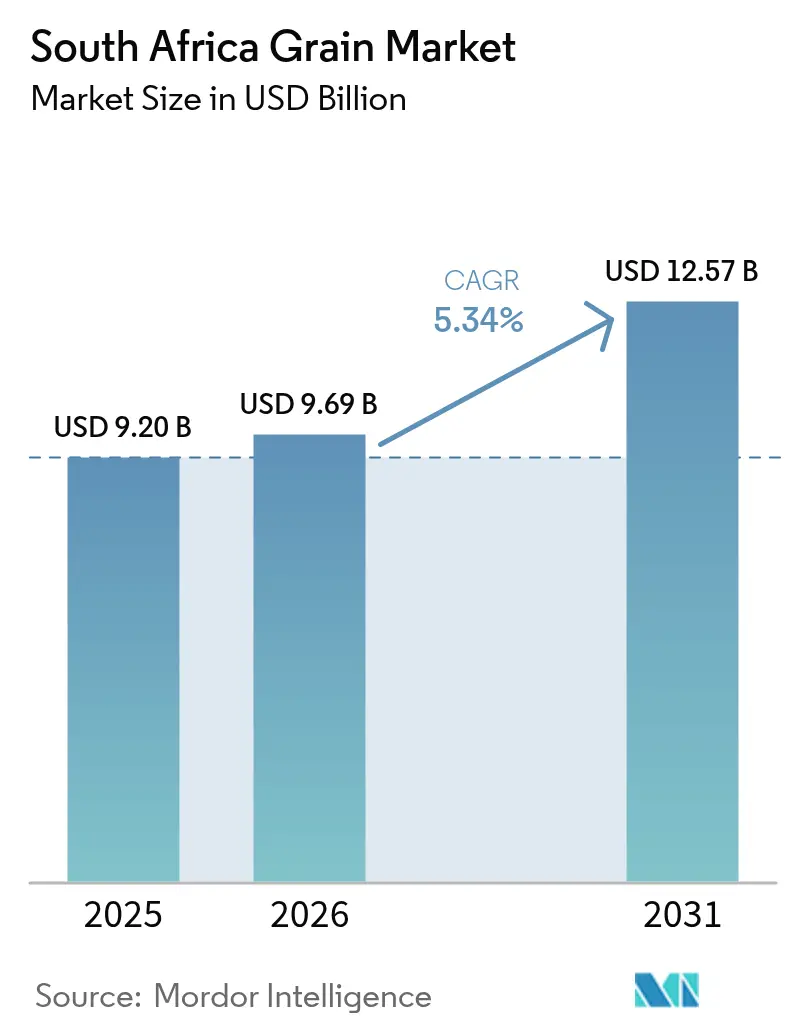
The South Africa grain market size was valued at USD 9.2 billion in 2025 and estimated to grow from USD 9.69 billion in 2026 to reach USD 12.57 billion by 2031, at a CAGR of 5.34% during the forecast period (2026-2031). Corn-driven self-sufficiency, demand from regional importers, and rising feedstock needs for biofuels sustain momentum. Producers are reallocating acreage toward maize as the corn-soy price ratio remains attractive, while sorghum gains traction as a climate-resilient alternative. Rail-corridor upgrades and water-infrastructure spending over three years improve logistics and irrigation capacity, countering historic bottlenecks. Mounting Brazilian export competition and greater drought variability heighten revenue volatility, pushing farmers to adopt precision-agriculture tools that deliver double-digit yield gains. The competitive landscape reveals increasing consolidation among global grain traders, with the Bunge-Viterra merger creating enhanced origination capacity and geographic diversification that directly impacts South African supply chains. This concentration dynamic, combined with South Africa's infrastructure constraints, necessitates strategic positioning to maintain market access and competitive margins.
Key Report Takeaways
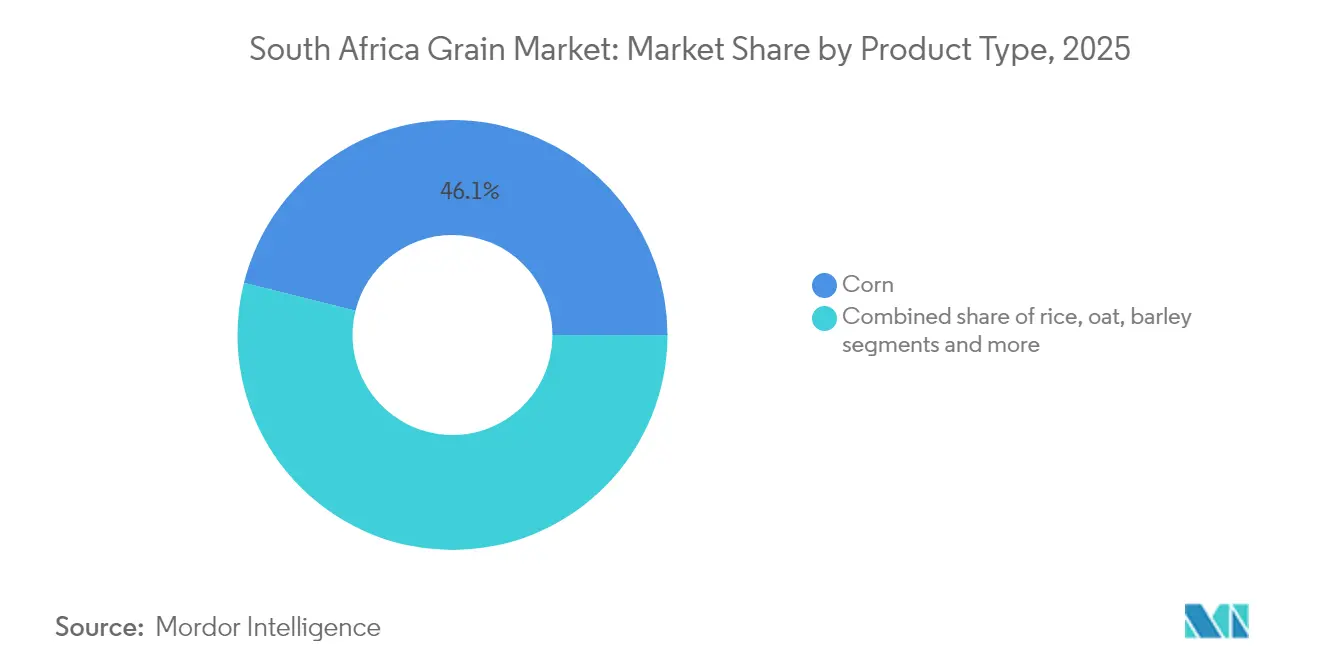
- By product type, corn led with 46.10% of the South Africa grain market share in 2025, and sorghum is forecast to post the fastest 6.12% CAGR through 2031.
Note: Market size and forecast figures in this report are generated using Mordor Intelligence’s proprietary estimation framework, updated with the latest available data and insights as of 2026.
South Africa Grain Market Trends and Insights
Drivers Impact Analysis*
| Driver | (~)% Impact on CAGR Forecast | Geographic Relevance | Impact Timeline |
|---|---|---|---|
| Expanding corn acreage from favorable corn-soy price ratio | +1.2% | National, concentrated in the Free State, North West, and Mpumalanga | Short term (≤ 2 years) |
| Rising demand for ethanol and renewable diesel feedstocks | +0.8% | National, with processing hubs in Gauteng and KwaZulu-Natal | Medium term (2-4 years) |
| Federal crop insurance and Farm Bill subsidies | +0.6% | National, targeting commercial and emerging farmers | Medium term (2-4 years) |
| Precision-agriculture yield gains | +0.9% | Commercial farms in the Free State, the Northwest, Western Cape | Long term (≥ 4 years) |
| Sorghum demand in pet food and gluten-free markets | +0.4% | National production, export-oriented to regional markets | Medium term (2-4 years) |
| Rail-corridor upgrades speeding grain exports | +1.1% | Export corridors to Durban, Richards Bay, and Cape Town ports | Long term (≥ 4 years) |
| Source: Mordor Intelligence | |||
Expanding Corn Acreage from Favorable Corn-Soy Price Ratio
A sharp rebound in local maize prices after the weather-hit 2024 crop has encouraged farmers to plant roughly 2.64 million ha for 2024/25, near the five-year average[1]Source: Food and Agriculture Organization of the United Nations, “FAO GIEWS Country Brief on South Africa,” fao.org. Growers in Free State and North West provinces lead this expansion, exploiting arbitrage opportunities as domestic prices exceed import parity. Seasonal outlooks projecting below-normal rainfall in central provinces and improved moisture in the northeast are funneling plantings toward North West and Limpopo. This shift spreads climatic risk geographically while safeguarding national supply targets. The acreage response underlines how swiftly the South Africa grain market reacts to price signals.
Rising Demand for Ethanol and Renewable Diesel Feedstocks
The Biofuels Industrial Strategy aims for a 2% share of the national liquid-fuel supply, equivalent to 400 million L annually, stimulating demand for non-maize feedstocks such as sorghum[2]Source: Department of Mineral Resources and Energy, “Biofuels,” dmre.gov.za. Global biofuel expansion keeps upward pressure on grain prices because maize still powers half of worldwide ethanol production. Brazil’s looming with a good blend mandate intensifies international pull, transmitting price signals into South African spot markets. A proposed 100% fuel-tax rebate for bioethanol enhances investment incentives. As processing firms in Gauteng and KwaZulu-Natal scale capacity, the South Africa grain market gains a diversified demand base beyond traditional food channels.
Federal Crop-Insurance and Farm Bill Subsidies
Blended-finance instruments with the Land Bank expand credit access, cushioning farmers against commodity-price cycles. An empirical analysis of government subsidies in South Africa reveals consistently negative effects on technical change and increased inefficiency, suggesting moral hazard and rent-seeking behaviors that may undermine long-term productivity gains. The conditional grant review process, including merging agricultural conditional grants, signals structural changes in funding mechanisms that require stakeholder monitoring to ensure effective resource allocation. Water infrastructure investments, including the Mkhomazi Project and Berg River-Voëlvlei Augmentation Scheme, provide indirect agricultural support through improved irrigation access and drought resilience.
Precision-Agriculture Yield Gains
Commercial farms adopting drone imagery and AI-based analytics report 20-25% yield lifts and 20% fertilizer savings. Smallholders using data-driven coaching in Raymond Mhlaba municipality have nearly 40% higher output, with maize yields climbing from 4.2 metric tons/ha to 6.0 metric tons/ha. AI drought-prediction systems like ITIKI achieve 98% accuracy 19 months ahead, aiding planting decisions. Payback arrives in 2-3 years for large operators and up to 5 years for smallholders without subsidies. These technologies sharpen competitiveness and reinforce supply resilience in the South Africa grain market.
Restraints Impact Analysis*
| Restraint | (~)% Impact on CAGR Forecast | Geographic Relevance | Impact Timeline |
|---|---|---|---|
| Volatile farm-gate prices amid Brazil export competition | -1.4% | National | Short term (≤ 2 years) |
| Greater drought and weather variability in the Corn Belt | -1.8% | Free State, North West, Mpumalanga | Medium term (2-4 years) |
| Trade-policy/tariff uncertainty depressing exporter margins | -1.1% | Durban, Richards Bay, Cape Town | Medium term (2-4 years) |
| Soil-fertility decline driving higher nutrient costs | -0.7% | National | Short term (≤ 2 years) |
| Source: Mordor Intelligence | |||
Volatile Farm-Gate Prices Amid Brazil Export Competition
Brazil’s scale and cost leadership intensify competition, undercutting regional bids and amplifying price swings. South Africa's dependence on regional export markets, with 44% of agricultural exports destined for other African countries, exposes producers to demand shocks in neighboring economies affected by their own production variability. Currency volatility compounds price uncertainty, with rand weakness increasing import costs for inputs while potentially improving export competitiveness, creating complex hedging requirements for producers and processors.
Greater Drought and Weather Variability in the Corn Belt
South Africa warms faster than global averages, with Free State and North West temperatures climbing 0.03-0.04 °C annually. The 2024 mid-summer drought cut maize output by over 15%. Yield losses can reach in severe El Niño years. Stress-tolerant hybrids and crop insurance soften blows, yet escalating extremes could overwhelm adaptive capacity without sustained irrigation and soil-moisture investments. The sector's adaptive capacity through stress-tolerant hybrids, improved agronomy, and risk management instruments has maintained relative yield stability despite precipitation deficits, though continued climate intensification may overwhelm these adaptation measures without systematic resilience investments.
*Our forecasts treat driver/restraint impacts as directional, not additive. The impact forecasts reflect baseline growth, mix effects, and variable interactions.
Segment Analysis
By Product Type: Corn Dominance Drives Market Expansion
Corn’s 46.10% underscores its pivotal role in the South Africa grain market share, and Sorghum is forecast to post the fastest 6.12% CAGR through 2031. This output comfortably covers the domestic demand of roughly 12 million metric tons and sustains a self-sufficiency ratio, enabling exports to deficit neighbors. Wheat retains a large footprint, yet local output meets less than half of consumption, necessitating imports that expose millers to global price volatility. Sorghum, though representing a modest share, is projected to record a CAGR of 6.12% through 2031, supported by rising demand in gluten-free products and pet food applications. Barley dominates Western Cape winter rotations, while rice, oats, and rye occupy smaller dietary and brewing pockets.
Precision agriculture enhances productivity across crops; variable-rate tools have cut fertilizer and water use. The South Africa grain market size for feed applications remains robust because animal feed mills consume oilcake, stabilizing farm-gate prices. Technology adoption among smallholders is rising but still constrained by financing gaps and limited connectivity. Broader uptake would unlock further gains, cementing resilience in an increasingly climate-stressed environment.



Geography Analysis
Maize output clusters in Free State, North West, Mpumalanga, and KwaZulu-Natal, which collectively account for the bulk of the national supply. North West and Mpumalanga anticipate above-average rainfall in 2025, promoting acreage recovery after the 2024 drought. The Free State leads maize production but faces increasing climate stress, with significant temperature increases of 0.03-0.04°C annually and occasional precipitation declines that negatively correlate with yields.
Western Cape dominates winter grains such as wheat and barley; the severe 2015-2018 drought showed the limits of rainfed reliance. Water-augmentation schemes like Mkhomazi and Berg River-Voëlvlei, part of the USD 8.6 billion water-works package, aim to expand irrigation and stabilize yields. The Bunge-Viterra merger deepens origination reach and may intensify competition for elevator space and farmer contracts. Limpopo province shows increasing importance for sorghum and drought-tolerant crops, with regional maize production coming from smallholder farmers operating predominantly rainfed systems with less under irrigation.
Enhanced port capacity supports producers nationwide. Richards Bay’s 10% export uptick in 2024 and Durban’s plan to scale indicate rising throughput. As rail reforms attract private wagons, interior provinces stand to cut freight costs, widening farm margins and reinforcing the South Africa grain market’s regional leadership. The government's water infrastructure investment, including the Mkhomazi Project and Berg River-Voëlvlei Augmentation Scheme, addresses regional water constraints that limit irrigation expansion and production stability.
Regulatory Landscape
South Africa's grain market is shaped by quality, marketing, and trade instruments. Quality and labeling requirements for grains and grain products sit primarily under the Agricultural Product Standards Act, administered by the Department of Agriculture, while market access tools and statutory measures, including levies and registrations, are enabled through the Marketing of Agricultural Products Act and overseen by the National Agricultural Marketing Council (NAMC).
On the trade side, the International Trade Administration Commission of South Africa (ITAC) manages variable import duties and reference-price mechanisms that influence wheat pricing and import parity. In February 2026, ITAC announced a revised wheat import duty of R619/MT (down from R851.25/MT that applied since July 2025), and in June 2026 it defended maintaining the wheat Dollar-Based Reference Price at USD 279/MT despite requests from Grain SA and SACOTA to raise the trigger. These decisions keep tariff settings and reference prices central to balancing domestic producer protection with downstream affordability for millers and consumers.
Value Chain Analysis
The South Africa grain value chain extends from upstream inputs (seed, fertilizer, crop protection, mechanization, and finance) through farm production, aggregation and storage (silos and elevators), trading and risk management, primary processing (milling and feed manufacturing), and distribution to retail, industrial users, and export channels. Commercial production is concentrated in the summer-grain belt, with Free State, North West, and Mpumalanga key maize areas, while the Western Cape supports winter grains such as wheat and barley, with flows into domestic processors and export corridors linked to Durban, Richards Bay, and Cape Town.
Cost and reliability pressures are most evident in the input and logistics links. Fertilizer and other key raw materials are largely imported, exposing farmers and agribusinesses to currency and global price swings, while transport margins and fuel costs increase the cost-to-serve from inland production regions to processors and ports. Implementation frictions also show up in input market governance, with the Act 36 registration system for agricultural inputs reported as backlogged for extended periods, limiting access to newer products and raising compliance and sourcing complexity for distributors and growers. Public support programs aimed at producers, alongside rail and port performance improvements, remain central to reducing friction between farmgate supply and end-market demand.
Market Opportunities and Future Outlook
Technology-enabled productivity and service delivery is a discernible gap across both commercial and emerging farmer segments, backed by named public initiatives. In February 2026, the Department of Science, Technology and Innovation advanced the SASSAM pilot in Mthatha to digitize farms using integrated soil analysis, pest identification, and AI-driven forecasting, and in July 2026 the Limpopo Department of Agriculture and Rural Development launched AGIS Drone Services under a formal memorandum arrangement to operationalize unmanned aircraft capability for agricultural services. These initiatives support near-term opportunities for agronomy platforms, input providers, and service contractors to package diagnostics, variable-rate advice, and on-farm execution.
Market structure and trade mechanics also create entry points for participants that can manage volatility and help maintain throughput. ITAC's February 2026 wheat duty adjustment and its June 2026 defense of the wheat reference-price trigger show that import parity and domestic price formation for wheat continue to be influenced by administered mechanisms, supporting demand for hedging, structured procurement, and flexible origination among millers and traders. On the supply side, large crop forecasts released by the Crop Estimates Committee during 2026 increase the need for storage optimization and export execution, keeping attention on corridor performance to Durban, Richards Bay, and Cape Town and on commercial models that improve slot booking, inland consolidation, and carry-over stock management for maize and soybeans.
Recent Industry Developments
- July 2026: The Limpopo Department of Agriculture and Rural Development launched AGIS Drone Services under a Memorandum of Agreement with the Department of Land Reform and Rural Development to utilize their Unmanned Aircraft Systems Operator Certificate. The initiative expands access to aerial scouting and data capture for producers, strengthening the service layer that supports precision decisions on grains and other row crops.
- June 2026: Phatisa, through its Food Fund platform, and a WIPHOLD-PIC consortium finalized the acquisition of Zaad Holdings in a reported R1.4 billion transaction. By combining seed breeding, distribution reach, and crop protection exposure under a larger investment platform, the deal increases the strategic importance of integrated input portfolios for grain productivity and farmer engagement.
- June 2024: In2food launched Smul, a new range of convenient foods built around whole grains, seeds, and nuts. Product innovation in consumer-facing whole-grain formats supports downstream demand pull and encourages value-added channels beyond bulk grain use.


Research Methodology Framework and Report Scope
Market Definition and Coverage
This market covers the value of grains produced, consumed, and traded within South Africa, measured in USD, using a consistent view of domestic supply, demand, and price formation across the grain value chain.
Scope exclusions: We exclude oilseeds, pulses, horticulture crops, and processed grain-based foods because they follow different pricing drivers and demand channels.
Segmentation Overview
- By Product Type (Production Analysis by Volume, Consumption Analysis by Value and Volume, Import Analysis by Value and Volume, Export Analysis by Value and Volume, and Price Trend Analysis)
- Corn (Maize)
- Wheat
- Sorghum
- Barley
- Rice
- Oats
- Rye
Data Sources, Market Sizing, and Validation
Desk Research
Desk work started with anchoring grain supply and use flows, and then aligning them to pricing references that are openly published and regularly updated. We relied on public statistical series and sector notes to frame production seasonality, planted area shifts, and trade direction changes before building the market model.
Typical sources used include official agriculture and trade releases such as Statistics South Africa, the Department of Agriculture, Land Reform and Rural Development, the South African Revenue Service trade statistics, and the South African Grain Information Service market updates. We also referred to international public datasets and briefs such as FAOSTAT and USDA FAS commodity reports, and we checked supporting context from peer-reviewed agronomy and food security journals when climate and yield drivers needed validation. Company annual reports and investor presentations helped us understand procurement behavior and storage and handling context, while a paid subscription covering company financials and another covering shipment-level import and export records were used selectively to cross-check value splits and trade signals. These examples are not exhaustive, and many other public and paid sources were also used for data collection, validation, and clarification.
Primary Interviews and Surveys
Our field research in South Africa includes interviews and surveys with grain producers, traders, millers, storage operators, importers, exporters, and distribution professionals. Responses are used to check production costs, realized prices, inventory movement, demand from food and feed users, and the timing of trade flows. Analysts recheck unusual answers against secondary records before final assumptions are accepted.
Distribution of primary research fieldwork respondents
| Company type | Respondent position |
|---|---|
| Top tier: 28% | CXOs: 15% |
| Mid tier: 52% | Functional/Unit leaders: 30% |
| Smaller Players: 20% | Managers: 55% |
Market-Sizing & Forecasting
Sizing used a top-down and bottom-up blend, where national production, consumption, and trade balances were reconstructed by grain type and then translated into value using price trend series that match local market practice. Once the demand pool was built from these supply and use indicators, it was corroborated with selective bottom-up checks using sampled volumes by crop, typical price bands, and channel feedback from interviews. Where the two views disagreed, we adjusted the estimates.
Key inputs that shaped the model included planted area and yield shifts by season, production volumes, import and export tonnage, stock direction, and local price movements across major grains. Because the country is exposed to weather variability, scenario analysis was used for forecasting. The scenarios were guided by expert views on likely rainfall patterns, planting responses, and trade substitution behavior. When granular splits were not consistently available, gaps were handled through ratio-based allocations anchored to the most stable public series, and then re-checked through primary inputs before finalizing.
Data Validation & Update Cycle
Outputs were checked against independent signals, including whether implied per-ton values stayed within realistic price corridors and whether trade shares moved in line with known policy and logistics constraints. Any sharp jumps were reviewed again, and follow-up conversations were triggered when interview feedback and desk indicators diverged.
Before sign-off, the model went through a multi-step internal review to keep assumptions, units, and currency treatment consistent across grains and years. The report is refreshed annually, and interim updates are made when material events occur (for example, a major drought, policy change, or trade disruption). Before delivery, a final analyst pass confirms that the latest public releases are reflected.
Mordor Intelligence's South African Grain Market Size Versus Other Published Estimates
Published market sizes for South Africa grains do not always match because the counted value pool can change depending on whether a study follows marketing-year flows, which grain types are included, and how trade values and domestic prices are converted into a single USD figure.
The table shows a spread that is mainly explained by scope and timing differences, especially around how imports and exports are treated and whether pricing is captured as farm-gate, wholesale, or a blended realization across channels.
Benchmark comparison
| Source | Market Size | Gaps in Research Methodology |
|---|---|---|
| Mordor Intelligence | USD 9.69 B (2026) | |
| Global Consultancy A | USD 10.90 B (2023) | Uses an earlier base year and is typically presented with broad crop and application framing, which shifts totals when trade values and domestic pricing are not aligned to the same marketing-year window. |
| Industry Publisher B | USD 12.20 B (2025) | Often applies a single blended price progression across grains and years, which can inflate value in seasons where local prices correct after harvest or where imports substitute domestic supply. |
The table points to timing and price-construction differences more than a disagreement on volumes. In Mordor Intelligence's model, value is built by linking grain-type supply and use (production, consumption, and trade) with price trend series for the same period, so import and export valuation does not get mixed with mismatched years or channels.


Key Questions Answered in the Report
How large is the South Africa grain market in value terms for 2026?
It is valued at USD 9.69 billion in 2026 with a forecast to reach USD 12.57 billion by 2031.
Which crop currently holds the largest share of grain output?
Corn accounts for 46.10% of the nation's grain value and routinely tops 15 million metric tons of annual production.
What is driving future demand growth for South African grains?
Rising biofuel mandates, expanding regional feed demand, and acreage gains spurred by favorable corn-soy price ratios are key drivers.
Which segment is projected to grow fastest through 2031?
Sorghum is forecast to rise at a 6.12% CAGR, buoyed by gluten-free food and pet-feed demand.
Page last updated on:





