Market Overview
| Study Period | 2021 - 2031 |
|---|---|
| Forecast Data Period | 2026 - 2031 |
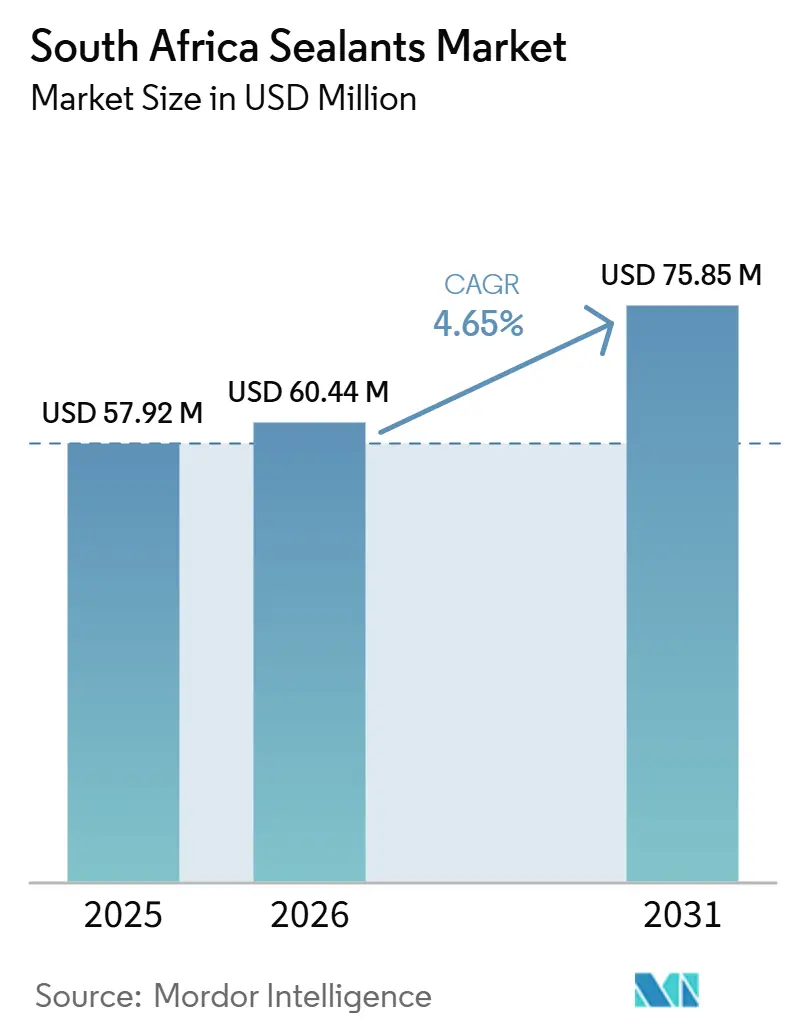
| Base Year Market Size (2025) | USD 57.92 Million |
| Market Size (2026) | USD 60.44 Million |
| Market Size (2031) | USD 75.85 Million |
| Growth Rate (2026 - 2031) | 4.65% CAGR |
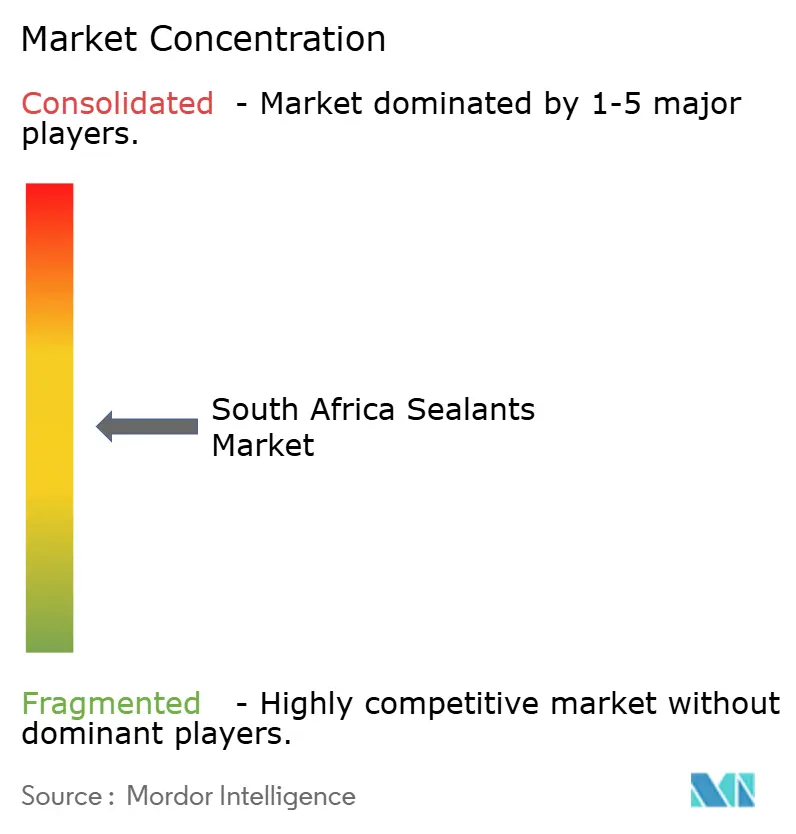
| Market Concentration | Medium |
Major Players *Disclaimer: Major Players sorted in no particular order Image © Mordor Intelligence. Reuse requires attribution under CC BY 4.0. | |
South Africa Sealants Market Analysis by Mordor Intelligence
The South Africa Sealants Market size is projected to expand from USD 57.92 million in 2025 and USD 60.44 million in 2026 to USD 75.85 million by 2031, registering a CAGR of 4.65% between 2026 and 2031. High-performance sealants are witnessing steady demand, bolstered by significant public-sector infrastructure investment, the South African Automotive Masterplan 2035, and ambitious renewable energy expansions. Upgrades to provincial transport corridors, water pipelines, and ports are increasingly turning to durable jointing and waterproofing systems, while electric-vehicle investments accelerate requirements for thermal interface and battery encapsulation products. Large solar projects in Northern and Western Cape provinces are boosting orders for ultraviolet-stable silicones, and volatile organic compound (VOC) regulations favor locally formulated water-based dispersions. Multinational suppliers that have expanded local capacity since 2025 are mitigating currency risk and improving just-in-time deliveries across Gauteng, KwaZulu-Natal, and Western Cape.
Key Report Takeaways
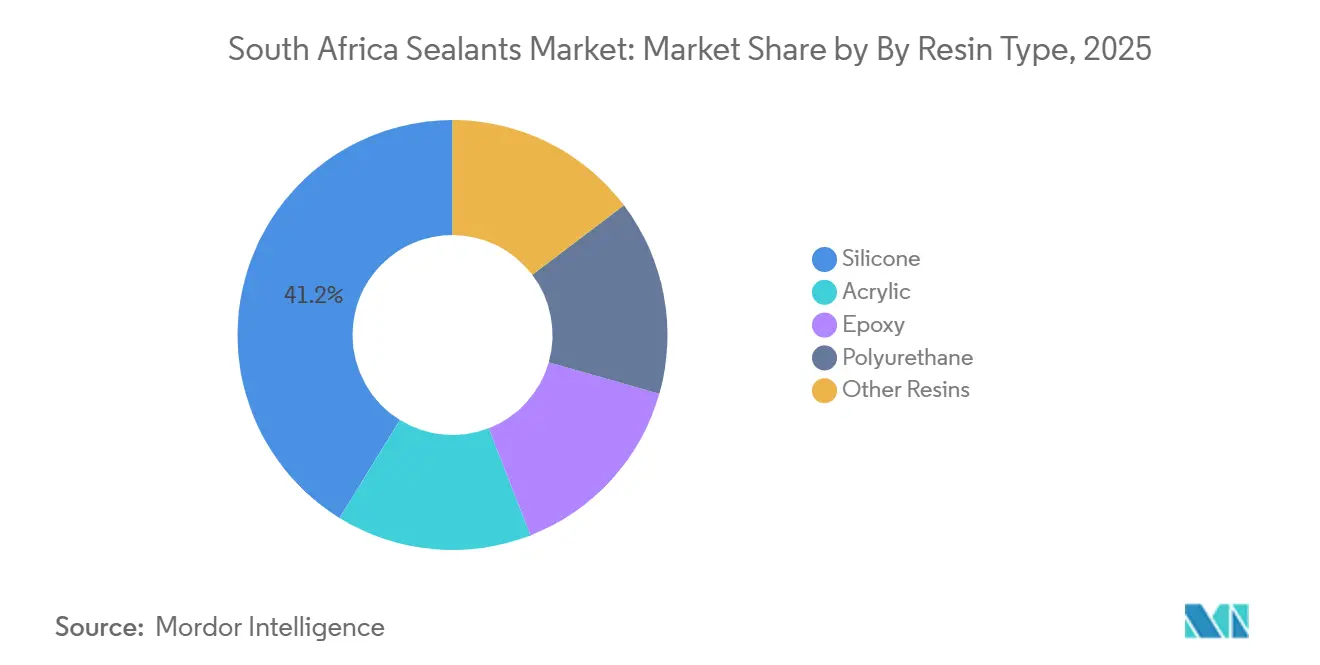
- By resin type, silicone captured 41.20% of the South Africa sealants market share in 2025 and maintained leadership across infrastructure and photovoltaic applications. Polyurethane is projected to record the fastest segment growth at a 6.34% CAGR from 2026 to 2031, supported by automotive body sealing and modular construction joints.
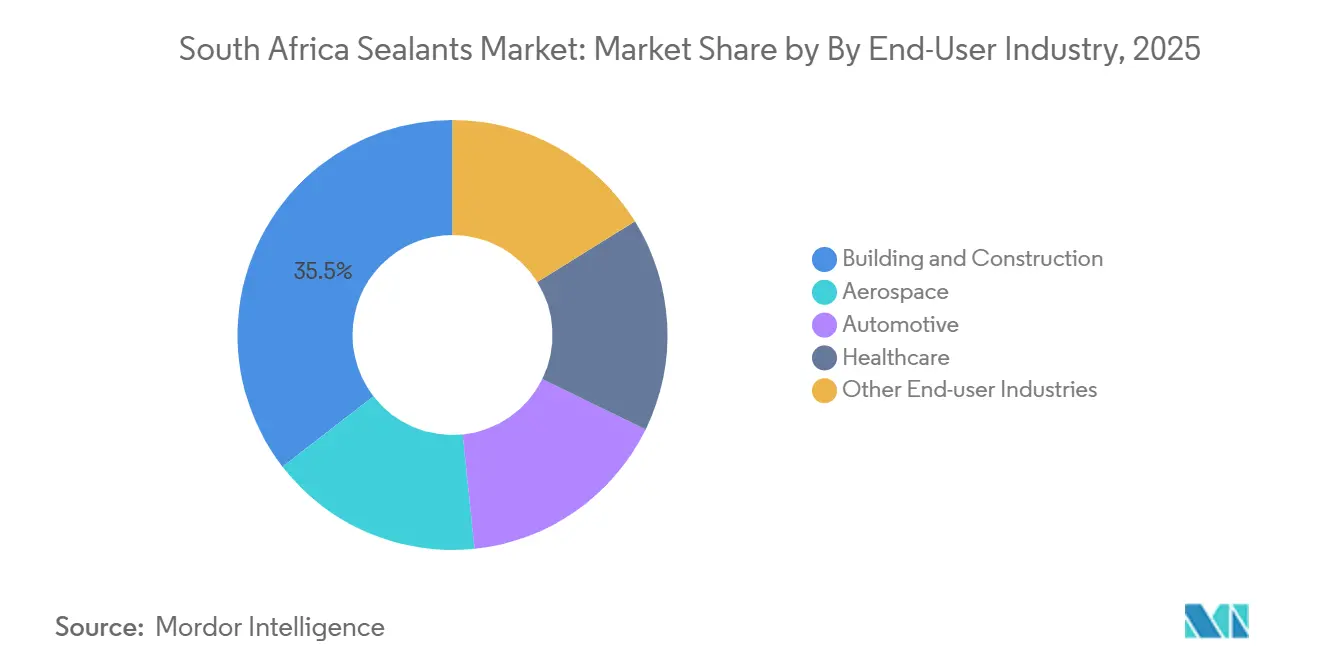
- By end-user industry, building and construction held 35.50% of the South Africa sealants market size in 2025, reflecting elevated public works allocations for transport, water, and social housing. Aerospace end-user demand is forecast to expand at a 5.56% CAGR between 2026 and 2031 on the back of maintenance, repair, and overhaul recovery across regional carriers.
Note: Market size and forecast figures in this report are generated using Mordor Intelligence’s proprietary estimation framework, updated with the latest available data and insights as of January 2026.
South Africa Sealants Market Trends and Insights
Drivers Impact Analysis*
| Driver | (~) % Impact on CAGR Forecast | Geographic Relevance | Impact Timeline |
|---|---|---|---|
| Surging public-sector infrastructure pipeline (2026-2031) | +1.80% | National, with concentration in Gauteng, Western Cape, KwaZulu-Natal transport and water corridors | Medium term (2-4 years) |
| South African Automotive Masterplan 2035 scaling local vehicle output | +1.20% | National, with primary impact in Gauteng (Tshwane, Rosslyn), Eastern Cape (Kariega, East London), KwaZulu-Natal (Durban) | Long term (≥ 4 years) |
| Shift to low-volatile organic compound and green-building compliant sealants | +0.70% | National, accelerated in Green Star-certified projects in major metros | Medium term (2-4 years) |
| Photovoltaic build-out requiring ultraviolet-stable silicone edge-sealing | +0.90% | National, with early gains in Northern Cape, Western Cape, Gauteng utility-scale and distributed rooftop installations | Short term (≤ 2 years) |
| Rise of high-temperature metals and minerals processing projects | +0.50% | Bushveld Complex (Limpopo, North West), Northern Cape rare-earth sites, ferrochrome belt | Long term (≥ 4 years) |
| Source: Mordor Intelligence | |||


Surging Public-Sector Infrastructure Pipeline Drives Sustained Demand Through 2031
Projects in transport, energy, water, and sanitation funded under a medium-term expenditure framework are creating multi-year procurement schedules. These schedules include items such as expansion joints, bridge bearings, port wharf sealing, and pipeline gaskets. Consolidation of the Infrastructure Fund within the Development Bank of Southern Africa streamlines tender processes, allowing contractors to negotiate bulk supply agreements for construction-grade silicones and polyurethanes. Transnet plans to modernize container terminals in Durban and Cape Town, which elevates marine-grade sealant requirements. Water projects such as Lesotho Highlands Phase 2 demand chemical-resistant joints for treatment works and reservoirs. Coupled with the National Infrastructure Plan 2050, these initiatives sustain core demand for civil-engineering sealants across the forecast horizon.
South African Automotive Masterplan 2035: Scaling Local Vehicle Output and Component Localization
Since 2023, BMW, Ford, Volkswagen, and Stellantis have committed substantial investments to upgrade assembly lines in Rosslyn, Silverton, Kariega, and Coega, with the goal of significantly increasing local content targets in the coming years. Battery-electric and plug-in hybrid launches require thermal interface materials, body-in-white sealing, and lightweight structural adhesives. The Auto Industry Transformation Fund channels grants to black-owned suppliers for sealant and adhesive components, further localizing value chains. New tax deductions for new-energy vehicles, effective 2026, widen investment incentives, lifting demand for two-component polyurethane foams, liquid gasketing, and potting compounds.
Shift to low-volatile organic compound (VOC) and green-building sealants Reshapes Product Mix
Green Building Council of South Africa's (GBCSA) restrictions on VOC levels for adhesives and sealants in Green Star projects compel designers to specify water-based dispersions and hybrid systems[1]Green Building Council South Africa, “Responsible Green Building Products,” gbsca.org.za. Eskom’s building guidelines add another requirement that 95% of products meet VOC caps in power-utility facilities. South African National Standard (SANS) 10400-XA mandates airtight construction embedding sealant use in every new roof-wall and floor-wall junction. BASF’s 2026 reactor and application lab in Durban lifts the domestic supply of acrylic and styrene-butadiene dispersions that enable compliant formulations. Owners increasingly prioritize life-cycle costs, favoring durable sealants that reduce future maintenance, so specifiers gravitate toward tested low-VOC products with third-party ecolabels.
Photovoltaic Build-Out Requiring Ultraviolet-Stable Silicone Edge-Sealing Accelerates Through 2030
In 2025, South Africa achieved Africa's largest annual solar capacity addition. The Integrated Resource Plan now aims for significant further expansion by 2030. Utility-scale parks dominate capacity, yet under-reported rooftop systems push additional growth, raising demand for edge-sealing, module mounting adhesives, and inverter gasket products. Imported modules require silicone edge seals to withstand ultraviolet radiation and thermal cycling in high-irradiance regions. Original Equipment Manufacturers (OEMs) such as Mercedes-Benz installed on-site photovoltaic arrays, which boost industrial roofing sealant volumes at assembly-plant locations.
Restraints Impact Analysis*
| Restraint | (~) % Impact on CAGR Forecast | Geographic Relevance | Impact Timeline |
|---|---|---|---|
| Volatile silicone-monomer and currency swings pressuring margins | -0.90% | National, with acute impact on import-dependent formulators and distributors | Short term (≤ 2 years) |
| Pending volatile organic compound emission caps raising reformulation costs | -0.40% | National, concentrated in Green Star and public-sector projects requiring compliance documentation | Medium term (2-4 years) |
| Shortage of certified applicators causing field-failure risks | -0.30% | National, with higher severity in rural and peri-urban construction zones lacking training infrastructure | Medium term (2-4 years) |
| Source: Mordor Intelligence | |||
Volatile Silicone-Monomer and Currency Swings Pressuring Margins
Chinese supply discipline kept global silicone prices near USD 1,971 per ton FOB China in January 2026, while the South African Rand traded between 16.91 and 17.07 against the United States dollar in March 2026. Import-dependent formulators pay in dollars, so currency weakness raises landed costs and compresses gross margins unless prices are hedged or passed through. Auto exports to the United States fell in 2025 after new United States tariffs, curbing resin demand and cash flow in the automotive supply chain. Rising bond yields also elevate working capital costs, limiting inventory buffers for raw materials.
Pending VOC Emission Caps Raising Reformulation Costs
South Africa lacks a national VOC regulation for construction sealants, yet alignment with international thresholds is expected within two years, forcing suppliers to switch from solvent-based products to water-based chemistries. Reformulation needs laboratory testing, new raw materials, and capital upgrades to dispersion lines. Smaller firms without research budgets may exit or merge, increasing reliance on multinational portfolios. BASF’s Durban expansion offers technical support, but widespread investment is still required to certify new products for Green Star projects.
*Our forecasts treat driver/restraint impacts as directional, not additive. The impact forecasts reflect baseline growth, mix effects, and variable interactions.
Segment Analysis
By Resin Type: Performance Demand Sustains Silicone Leadership
Silicone dominated with a 41.20% South Africa sealants market share in 2025 on the back of ultraviolet stability and thermal cycling resistance in solar arrays and coastal façades. The South Africa sealants market size for silicone products is projected to advance steadily as rooftop and utility-scale photovoltaic systems accelerate through 2030. Elkem’s February 2025 partnership with Silstar strengthened distribution and technical service, smoothing supply to Gauteng glazing fabricators and Western Cape contractors.
Polyurethane is on track to achieve the highest growth, expanding at 6.34% CAGR between 2026 and 2031, fueled by vehicle assembly line upgrades that require paintable seam sealers and body foams. Modular housing factories also prefer quick-cure polyurethanes compatible with off-site assembly. Investments by BMW Rosslyn and Ford Silverton raise local demand, growing the South Africa sealants market size for polyurethane systems in battery pack encapsulation.
Epoxy formulations occupy a niche in mining and mineral processing where chemical resistance surpasses polyurethane. Henkel’s Nordbak acquisition localized production near mining belts, improving availability for crusher lining repairs. Acrylic and hybrid sealants retain cost-competitive positions in social housing and interior finishing, benefiting from bulk procurement programs by municipalities.


By End-User Industry: Construction Dominates While Aerospace Gains Momentum
Building and Construction captured 35.50% South Africa sealants market share in 2025, bolstered by significant allocations for transport and water. Ongoing bridge expansion, rail station waterproofing, and modular housing rely on elastomeric joint sealants and low-volatile organic compound (VOC) façade products. Saint-Gobain’s fiber cement plant in Ekurhuleni began sourcing hybrid silicones for cladding panels in early 2026, adding local pull-through demand.
Automotive, holding a significant share, is benefiting from incentives that raise local content and from export-oriented assembly lines. Thermal interface materials, acoustic damping, and vehicle body sealants are integral to plug-in hybrid platforms scheduled for series production after 2026.
Aerospace, although a small base, is the fastest rising at 5.56% CAGR between 2026 and 2031 as regional carriers refurbish fleets and defense maintenance programs resume. Fuel-tank sealants, windshield bonding, and specialty polysulfides dominate spend. Healthcare renovations, including modular clinics with Internet of Things sensors, create additional demand for antimicrobial and fire-rated sealants.
Geography Analysis
Gauteng anchors the South Africa sealants market with its automotive clusters in Tshwane and Ekurhuleni contributing more than one-third of the national vehicle output, which consumes structural adhesives and seam sealers. The 2026 opening of Saint-Gobain's fibre cement plant is expected to add regional demand for façade caulks and weatherproofing products. Provincial mixed-use developments around Johannesburg International Airport also specify low-volatile organic compound (VOC) silicones for energy-efficient glazing.
Western Cape and KwaZulu-Natal follow due to port upgrades and renewable-energy installations. The Budget Facility for Infrastructure funded Cape Town Container Terminal and Durban Pier 2, lifting orders for marine-grade polysulfides and epoxy deck sealants[2]Government Technical Advisory Center, “South Africa R1 trillion infrastructure budget 2026,” gtac.gov.za. BASF’s Durban dispersion reactor now feeds low-VOC construction sealant formulators throughout coastal regions, buffering currency risks.
Northern Cape hosts large solar farms and rare-earth projects that demand ultraviolet-stable silicones and high-temperature sealants. The Frontier Rare Earth beneficiation plant will increase niche demand for chemical-resistant epoxies by the decade’s end. Limpopo and North West provinces house smelters recovering from electricity tariff relief; furnace rebuilds require refractory jointing compounds. Rural construction zones, especially in Mpumalanga and Free State, confront applicator shortages, slowing uptake of advanced products.
Competitive Landscape
The South Africa Sealants Market is moderately fragmented. Growth niches center on electric-vehicle battery packs, healthcare facilities, and mineral-processing plants. Players able to supply thermal interface silicones, sanitary and antimicrobial grades, or high-temperature polysulfides differentiate through certified data sheets and Building Information Modeling objects. Digital procurement platforms adopted by contractors favor suppliers that integrate real-time inventory, traceability, and logistics visibility.
South Africa Sealants Industry Leaders
Dow
Henkel AG & Co. KGaA
Sika AG
Arkema
Soudal Holding N.V.
- *Disclaimer: Major Players sorted in no particular order

Recent Industry Developments
- February 2026: Sika has agreed to acquire Akkim, one of the leading global adhesives and sealants manufacturers based in Turkey. This acquisition strengthens Sika's global market position, including in South Africa, while expanding its distribution channels and geographic reach.
- July 2025: Henkel AG & Co. KGaA acquired South Africa's Nordbak (Pty) Ltd, strengthening its position in the South Africa sealants market. The move expanded its Maintenance, Repair, and Overhaul (MRO) solutions for mining, infrastructure, and petrochemical sectors, enhancing supply, local production, and competition.


South Africa Sealants Market Report Scope
A sealant is a viscous or paste-like substance used to fill gaps, joints, or cracks between surfaces, creating a protective, watertight, and airtight barrier. It prevents the infiltration of moisture, air, dust, and pests, and is often flexible to accommodate movement between materials, common in construction and automotive industries.
The South Africa Sealants Market is segmented by resin type and end-user industry. By resin type, the market is segmented into acrylic, epoxy, polyurethane, silicone, and other resins. By end-user industry, the market is segmented into aerospace, automotive, building and construction, healthcare, and other end-user industries. For each segment, the market sizing and forecasts have been done on the basis of value (USD).
By Resin Type
| Acrylic |
| Epoxy |
| Polyurethane |
| Silicone |
| Other Resins |
By End-User Industry
| Aerospace |
| Automotive |
| Building and Construction |
| Healthcare |
| Other End-user Industries |
| By Resin Type | Acrylic |
| Epoxy | |
| Polyurethane | |
| Silicone | |
| Other Resins | |
| By End-User Industry | Aerospace |
| Automotive | |
| Building and Construction | |
| Healthcare | |
| Other End-user Industries |


Market Definition
- End-user Industry - Building & Construction, Automotive, Aerospace, Healthcare, and Others are the end-user industries considered under the sealants market.
- Product - All sealant products are considered in the market studied
- Resin - Under the scope of the study, resins like Polyurethane, Epoxy, Acrylic, Silicone, and Others are considered
- Technology - For the purpose of this study, One component and Two component sealant technologies are taken into consideration.
| Keyword | Definition |
|---|---|
| Hot-melt Adhesive | Hot melt adhesives are generally 100% solid formulations, based on thermoplastic polymers. They are solid at room temperature and are activated upon heating above their softening point, at which stage they are liquid, and hence, can be processed. |
| Reactive Adhesive | A reactive adhesive is made up of monomers that react in the adhesive curing process and do not evaporate from the film during use. Instead, these volatile components become chemically incorporated into the adhesive. |
| Solvent-borne Adhesive | Solvent-borne adhesives are mixtures of solvents and thermoplastic, or slightly cross-linked polymers, such as polychloroprene, polyurethane, acrylic, silicone, and natural and synthetic rubbers (elastomers). |
| Water-borne Adhesive | Water-borne adhesives use water as a carrier or diluting medium to disperse a resin. They are set by allowing the water to evaporate or be absorbed by the substrate. These adhesives are compounded with water as a diluent, rather than a volatile organic solvent. |
| UV Cured Adhesive | UV curing adhesives induce curing and create a permanent bond without heating by using ultraviolet (UV) light or other radiation sources. An aggregation of monomers and oligomers is cured or polymerized by ultraviolet (UV) or visible light in a UV adhesive. Because UV is a radiating energy source, UV adhesives are often referred to as radiation curing or rad-cure adhesives. |
| Heat-resistant Adhesive | Heat-resistant Adhesives refer to those that do not break down under high temperatures. One aspect of a complicated system of circumstances is the adhesive's capacity to withstand disintegration brought on by high temperatures. As the temperature rises, adhesives may liquefy. They can withstand stresses resulting from differing coefficients of expansion and contraction, which might be an additional advantage. |
| Reshoring | Reshoring is the practice of moving commodity production and manufacturing back to the nation where the business was founded. Onshoring, inshoring, and back shoring are further terms used. Offshoring, the practice of producing items abroad to lower labor and manufacturing costs, is the opposite of this. |
| Oleochemicals | Oleochemicals are compounds produced from biological oils or fats. They resemble petrochemicals, which are substances made from petroleum. The oleochemical business is built on the hydrolysis of oils or fats. |
| Nonporous Materials | Nonporous materials are substances that do not permit the passage of liquid or air. Nonporous materials are those that are not porous, such as glass, plastic, metal, and varnished wood. Since no air can get through, less airflow is required to raise these materials, negating the requirement for high airflow. |
| EU-Vietnam Free Trade Agreement | A trade agreement and an investment protection agreement were concluded between the European Union and Vietnam on June 30, 2019. |
| VOC content | Compounds with limited solubility in water and high vapor pressure are known as Volatile Organic Compounds (VOCs). Many VOCs are human-made chemicals that are used and produced in the manufacture of paints, pharmaceuticals, and refrigerants. |
| Emulsion Polymerization | Emulsion polymerization is a method of producing polymers or connected groups of smaller chemical chains known as monomers, in a water solution. The method is often used to make water-based paints, adhesives, and varnishes, in which the water stays with the polymer and is marketed as a liquid product. |
| 2025 National Packaging Targets | In 2018, the Australian Environment Ministry set the following 2025 National Packaging Targets: 100% of the packaging must be reusable, recyclable, or compostable by 2025, 70% of plastic packaging must be recycled or composted by 2025, 50% of average recycled content must be included in packaging by 2025, and problematic and unnecessary single-use plastic packaging must be phased out by 2025. |
| Russian Government’s Import Substitution Policy | The Western sanctions suspended the distribution of several high-tech items to Russia, including those required by the raw material export sectors and the military-industrial complex. In response, the government launched an "import substitution" scheme, appointing a special commission to oversee its implementation in early 2015. |
| Paper Substrate | Paper substrates are paper sheets, reels, or boards with a base weight of up to 400 g/m2 that has not been converted, printed or otherwise altered. |
| Insulation Material | A material that inhibits or blocks heat, sound, or electrical transmission is known as Insulation Material. The variety of insulation materials includes thick fibers like fiberglass, rock and slag wool, cellulose, and natural fibers as well as stiff foam boards and sleek foils. |
| Thermal Shock | A temperature change known as thermal shock generates stress in a material. It commonly results in material breakdown and is especially prevalent in brittle materials like ceramics. When there is a quick temperature change, either from hot to cold or vice versa, this process occurs abruptly. It occurs more frequently in materials with poor heat conductivity and insufficient structural integrity. |


Research Methodology
Mordor Intelligence follows a four-step methodology in all our reports.
- Step-1: Identify Key Variables: The quantifiable key variables (industry and extraneous) pertaining to the specific product segment and country are selected from a group of relevant variables & factors based on desk research & literature review; along with primary expert inputs. These variables are further confirmed through regression modeling (wherever required).
- Step-2: Build a Market Model: In order to build a robust forecasting methodology, the variables and factors identified in Step-1 are tested against available historical market numbers. Through an iterative process, the variables required for market forecast are set and the model is built on the basis of these variables.
- Step-3: Validate and Finalize: In this important step, all market numbers, variables and analyst calls are validated through an extensive network of primary research experts from the market studied. The respondents are selected across levels and functions to generate a holistic picture of the market studied.
- Step-4: Research Outputs: Syndicated Reports, Custom Consulting Assignments, Databases & Subscription Platforms


