Market Overview
| Study Period | 2021 - 2031 |
|---|---|
| Forecast Data Period | 2026 - 2031 |
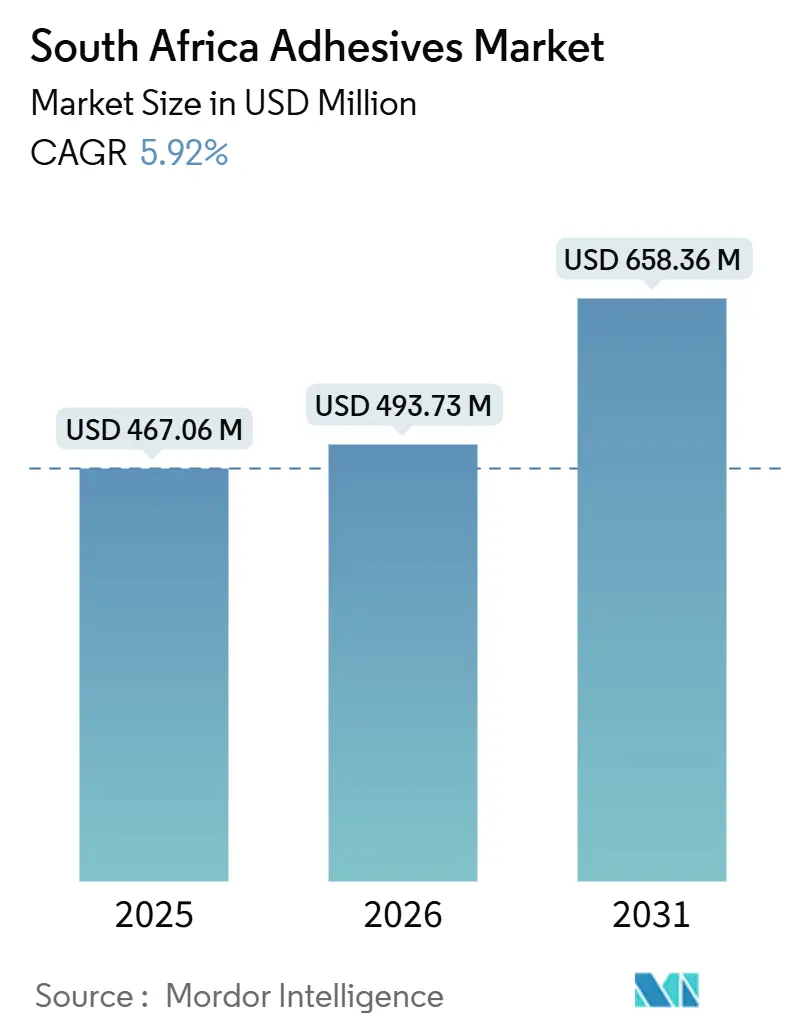
| Base Year Market Size (2025) | USD 467.06 Million |
| Market Size (2026) | USD 493.73 Million |
| Market Size (2031) | USD 658.36 Million |
| Growth Rate (2026 - 2031) | 5.92% CAGR |
| Market Concentration | Medium |
Major Players *Disclaimer: Major Players sorted in no particular order Image © Mordor Intelligence. Reuse requires attribution under CC BY 4.0. | |
South Africa Adhesives Market Analysis by Mordor Intelligence
The South Africa Adhesives Market size is projected to be USD 467.06 million in 2025, USD 493.73 million in 2026, and reach USD 658.36 million by 2031, growing at a CAGR of 5.92% from 2026 to 2031. Structural demand from e-commerce packaging, the R1.2 trillion public-sector infrastructure pipeline, and more than R1.9 billion in automotive original-equipment-manufacturer (OEM) investments during 2024-2025 underpin this expansion. Water-borne chemistries dominate due to stricter SABS SANS 1349 and 1348 volatile-organic-compound (VOC) limits that cap emissions at 65 g/L for Green Star building certification. Acrylic resins remain the largest resin family, yet polyurethane systems are scaling rapidly as OEMs pursue lightweighting and construction firms specify waterproofing solutions with superior joint-movement tolerance. Moderate-to-high competitive intensity, supply-chain volatility in petro-feedstocks, and a national skills gap in UV-LED and electron-beam curing technologies shape supplier strategies, capital allocation, and margin trajectories across the South Africa adhesives market.
Key Report Takeaways
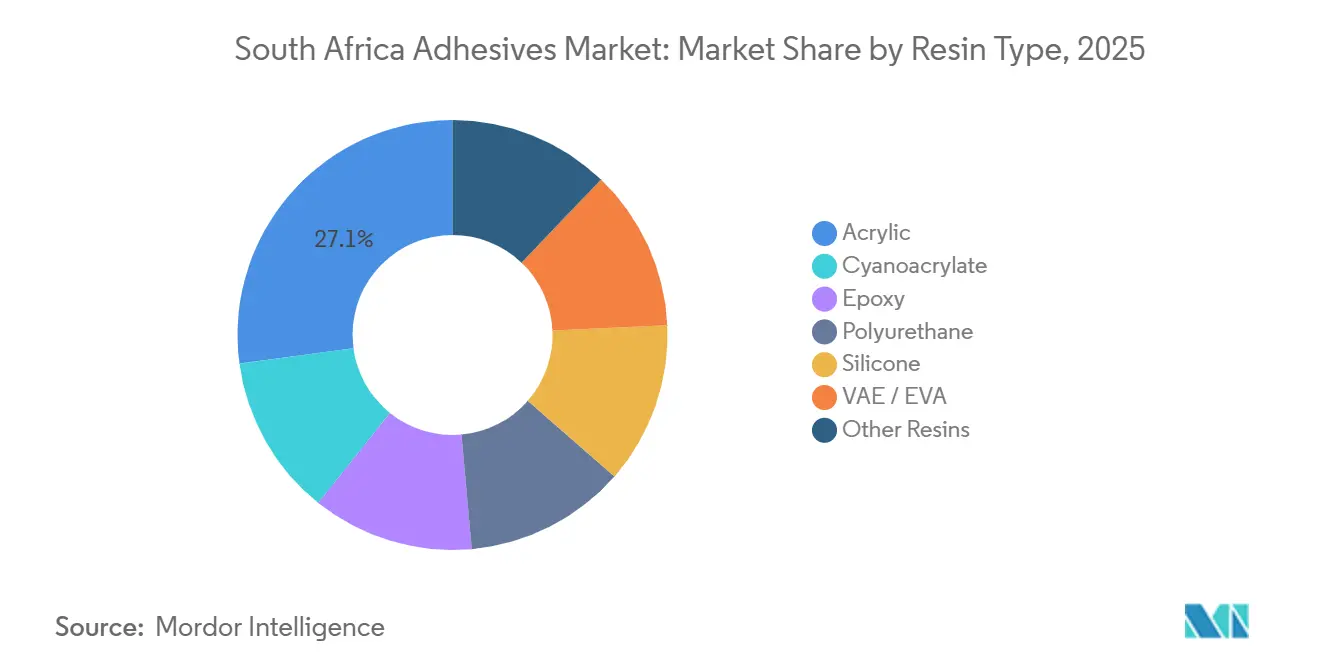
- By resin type, acrylics captured 27.12% share of the South Africa adhesives market in 2025. Polyurethane is anticipated to grow with 7.40% CAGR during 2026-2031, the fastest among all chemistries in the South Africa adhesives market size forecast.
- By technology, water-borne formulations accounted for 41.50% of South Africa adhesives market share in 2025. UV-Cured adhesives are anticipated to grow with the fastest CAGR of 7.98% during the forecast period.
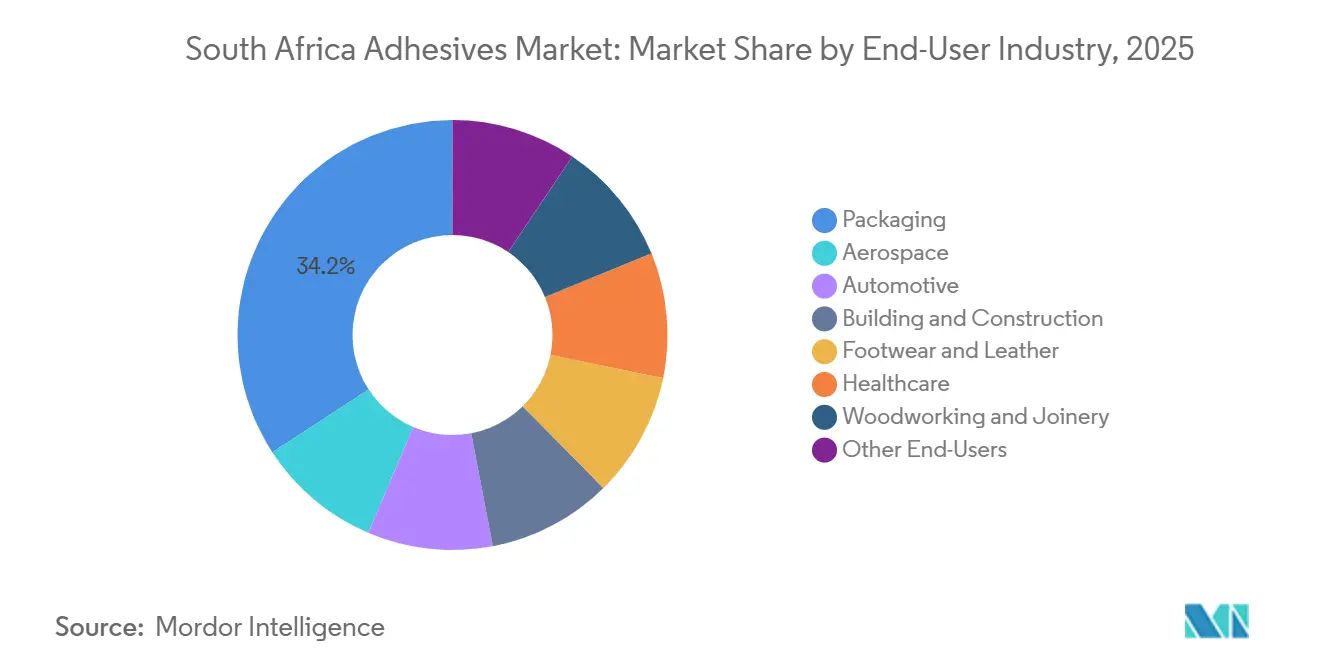
- By end-user, packaging accounted for 34.18% of 2025 demand, while healthcare is projected to expand at a 7.65% CAGR through 2031, outpacing the overall South Africa adhesives market.
Note: Market size and forecast figures in this report are generated using Mordor Intelligence’s proprietary estimation framework, updated with the latest available data and insights as of January 2026.
South Africa Adhesives Market Trends and Insights
Driver Impact Analysis*
| Drivers | (~) % Impact on CAGR Forecast | Geographic Relevance | Impact Timeline |
|---|---|---|---|
| Surge in e-commerce packaging demand | +1.2% | National, with concentration in Gauteng (Johannesburg, Pretoria) and Western Cape (Cape Town) | Short term (≤ 2 years) |
| Public-sector infrastructure pipeline | +1.0% | National, with emphasis on Eastern Cape (Coega SEZ), Gauteng (Gautrain extensions), KwaZulu-Natal (port upgrades) | Medium term (2-4 years) |
| Automotive OEM investment resurgence | +0.8% | Gauteng (Rosslyn, Silverton), Eastern Cape (Gqeberha/Port Elizabeth cluster) | Medium term (2-4 years) |
| Eastern-Cape furniture export cluster | +0.5% | Eastern Cape (Gqeberha, East London), spill-over to Western Cape | Long term (≥ 4 years) |
| Shift to bio-based low-VOC chemistries | +0.7% | National, regulatory influence strongest in Western Cape (GBCSA adoption), Gauteng (industrial compliance) | Medium term (2-4 years) |
| Source: Mordor Intelligence | |||
Surge in E-Commerce Packaging Demand
The protective-packaging sector reached USD 10.82 billion in 2024, and automated fulfillment lines increasingly specify water-borne acrylic emulsions that cure faster and tolerate higher humidity, replacing starch-based adhesives[1]“E-commerce Packaging Trends Report,” Packaging SA, packaging-sa.co.za . Logistics operators opened 15 new fulfillment centers across Gauteng and Western Cape during 2024-2025, doubling hot-melt adhesive usage per shipped carton as tamper-evidence becomes a brand differentiator[2]Terence Creamer, “Infrastructure Drive Gains Traction,” Engineering News, engineeringnews.co.za. Corrugated box producers now favor zero-VOC water-borne systems compliant with food regulations, while polyethylene-to-paper laminates employ flexible adhesives that maintain peel strength from −5 °C to 40 °C. E-commerce’s retail share rose from 3.4% in 2020 to 6.8% in 2025, magnifying adhesive consumption on a square-meter basis. These factors position packaging as the anchor of the South Africa adhesives market and sustain capital investment in high-speed coating and dispensing lines.
Public-Sector Infrastructure Pipeline
Government pledges totaling R1.2 trillion for water, energy, and transport assets stimulate long-horizon demand for epoxies, polyurethanes, and silicone sealants specified in bridge expansion joints, potable-water tanks, and photovoltaic mounting frames. The Coega Special Economic Zone attracted a €12 billion green-hydrogen project that will consume corrosion-resistant epoxy coatings qualified under SANS 10183. Contract awards typically translate into adhesive orders 12-18 months later, smoothing revenue visibility for suppliers with accredited civil-engineering product lines. Although construction GDP dipped 4% in 2025, project pipelines suggest a rebound averaging 3.8% annual growth from 2027-2029. As the pipeline skews toward renewable-energy and water-security assets, formulations with high weathering and chemical-resistance scores win specifications, reinforcing premium pricing in the South Africa adhesives market.
Automotive OEM Investment Resurgence
Light-commercial-vehicle and stamping investments exceeding R1.9 billion during 2024-2025 expand demand for structural polyurethane and epoxy adhesives that replace spot welding to meet sub-1,200 kg curb-weight incentives under the Automotive Production and Development Programme. Henkel, Sika, and Dow supply low-free-monomer polyurethane systems adopted by tier-one suppliers in Rosslyn and Silverton, aligning with new occupational-exposure thresholds below 0.1% diisocyanate content. Vehicle output climbed 7.6% year-on-year in H1 2025 before global component shortages triggered a 12% contraction in early 2026, highlighting the value of flexible batch production capacity. Battery-pack assembly adds demand for thermally conductive epoxies, while interior trim lines migrate to instant-cure UV-acrylate systems that cut takt time by 40%. These shifts collectively boost polyurethane’s 7.40% forecast CAGR within the South Africa adhesives market size during 2026-2031.
Eastern-Cape Furniture Export Cluster
The Furniture Industry Master Plan seeks a 20% export uplift by 2030, channeling grants toward CNC machining, edge-banding, and ambient-cure adhesive adoption in Gqeberha and East London facilities. Polyvinyl-acetate and moisture-curing polyurethane chemistries reduce energy consumption amid nationwide load-shedding, while mimosa-tannin bio-adhesives gain pilot-scale traction, delivering 40% lower VOC emissions than phenolic alternatives. EU buyers’ EN 204 D3/D4 durability requirements accelerate uptake of moisture-resistant PVA lines from Alcolin and Genkem, reinforcing compliance-led differentiation. Employment topped 18,000 in 2025, yet productivity hinges on bridging skills deficits in digital finishing operations. Together, these dynamics infuse long-term volume growth into the South Africa adhesives market.
Restraint Impact Analysis*
| Restraints | (~) % Impact on CAGR Forecast | Geographic Relevance | Impact Timeline |
|---|---|---|---|
| Petro-feedstock price volatility | -0.6% | National, with acute impact on Gauteng (chemical manufacturing hub) and import-dependent coastal provinces | Short term (≤ 2 years) |
| Tightening VOC regulations | -0.4% | National, with early enforcement in Western Cape (GBCSA Green Star projects) and Gauteng (industrial zones) | Medium term (2-4 years) |
| Skills gap in UV/EB-cure processing | -0.3% | National, most acute in Gauteng (packaging converters) and Western Cape (label printers) | Long term (≥ 4 years) |
| Source: Mordor Intelligence | |||
Petro-Feedstock Price Volatility
Import dependence for 70% of ethylene and propylene exposes producers to oil-price spikes and rand depreciation, slicing solvent-borne adhesive margins by up to 12 percentage points during the 2024-2025 freight-rate surge. Sasol supplies only 30% of local polymer demand, compelling converters to source costlier imports from the Gulf Cooperation Council and Asia. Currency moves from ZAR 18.5/USD to ZAR 19.8/USD further raised landed costs, pushing retail DIY adhesive prices beyond elasticity thresholds and dampening volume in price-sensitive segments. Water-borne acrylics enjoy partial insulation through lower polymer intensity, yet packaging producers still absorb double-digit cost inflation in paper and plastic substrates. This pricing turbulence curbs near-term expansion across the South Africa adhesives market.
Tightening VOC Regulations
Revised SANS 1349 and 1348 enforce full compliance by January 2027, mandating costly reformulation of solvent-borne wood and tile adhesives. Capital outlays of ZAR 2-8 million per product line outstrip the liquidity of small converters, prompting consolidation or strategic exits. Green Star tender specifications cascade VOC ceilings into private projects, making certification a prerequisite for premium real-estate developments. Solvent-borne waste, now classified as hazardous, commands disposal fees of ZAR 15-25 per kg, eroding price competitiveness versus the water-borne option. Although regulations foster long-term sustainability, the transition imposes short-run drag on the South Africa adhesives market.
*Our forecasts treat driver/restraint impacts as directional, not additive. The impact forecasts reflect baseline growth, mix effects, and variable interactions.
Segment Analysis
By Resin Type: Polyurethane Accelerates on Mobility and Infrastructure Demand
Acrylics retained 27.12% of the South Africa adhesives market in 2025, buoyed by pressure-sensitive label, tape, and flexible-packaging applications where clarity and UV resilience are critical. Polyurethane systems, however, are forecast to post 7.40% CAGR through 2031, the fastest among all chemistries, as automakers adopt body-in-white bonding to shed weld weight and construction contractors specify waterproofing membranes tolerant of 25% joint movement. Epoxies, though lower in volume, secure high-margin niches in corrosion-resistant infrastructure coatings; SANS 10183-approved Sikadur-31 DW exemplifies potable-water compliance needs. Cyanoacrylates dominate medical-device micro-bonding, while silicones infiltrate solar-panel and glazing assemblies for their −50 °C to +150 °C service window.
Silicone adoption faces cost headwinds, yet Dow’s DOWSIL 895 structural sealant, qualified under ETAG 002 standards, wins curtain-wall bids where service life exceeds 25 years. VAE/EVA resins retain price-sensitive furniture accounts in the Eastern Cape cluster thanks to fast tack and easy cleanup. Legacy phenolic and melamine-formaldehyde systems fade as bio-based mimosa-tannin variants meet performance criteria while trimming VOCs by 40%. Overall, resin diversification underpins product portfolios, yet polyurethane remains the growth accelerant within the broader South Africa adhesives market.


By Technology: Water-Borne Dominant, UV-Cured Poised for Rapid Upside
Water-borne chemistries secured 41.50% of 2025 revenue, reflecting early compliance with SABS SANS 1349 VOC caps and workplace-safety preferences in packaging and woodworking. The South Africa adhesives market share of UV-cured platforms is smaller today but is forecast to advance at 7.98% CAGR through 2031, the highest among technologies, driven by pharmaceutical blister-pack, electronics encapsulation, and automotive interior applications. Avery Dennison’s August 2025 launch of MPI 2906 Hi-Tack film illustrates UV-formulated pressure-sensitive laminates engineered for low-surface-energy plastics, boosting installation speed for fleet graphics.
Hot-melt usage expands alongside e-commerce corrugation, with polyolefin-based grades setting within two seconds, a necessity for 200-carton-per-minute lines. Reactive two-component epoxies and polyurethanes dominate high-strength infrastructure and maintenance bonds despite longer workable times. Solvent-borne options retreat under waste-disposal surcharges and VOC ceilings, reshaping capex toward water-borne reactors and UV-LED conveyors. Regionally, converters with strong balance sheets retrofit lines swiftly, while smaller firms navigate cash-flow strain. As a result, the technology mix tightens around low-VOC systems, reinforcing a structural shift in the South Africa adhesives market.
By End-User Industry: Healthcare Jumps Ahead While Packaging Anchors Demand
Packaging generated 34.18% of 2025 consumption, powered by corrugated, flexible, and label segments that now specify migration-compliant water-borne or hot-melt chemistries for food safety. Healthcare, though smaller, is on track for a 7.65% CAGR to 2031, the fastest among end-users, as the South African Health Products Regulatory Authority localizes medical-device assembly and pharmaceutical blister-pack capacity. Henkel’s biocompatible cyanoacrylates and silicone skin adhesives are already qualified by Electrospyres and Medical Plant Africa, signaling supply-chain diversification.
Building-and-construction adhesives pivot on the R1.2 trillion infrastructure backlog, with silicone and polyurethane joint sealants specified for solar plants and potable-water reservoirs. Automotive lines in Gauteng and Eastern Cape shift toward structural adhesives that replace 25-30 spot welds per vehicle, lifting polyurethane volume density across the South Africa adhesives market size. Footwear and leather, woodworking and joinery, aerospace, and DIY retail round out the matrix, each sensitive to sector-specific macroeconomic cycles, yet collectively ensuring diversified consumption patterns that hedge single-industry risk.
Geography Analysis
Gauteng province accounts for the largest share of the South Africa adhesives market in 2025, anchored by the Rosslyn automotive cluster, Johannesburg’s packaging corridor, and the province’s position as the nation’s logistics fulcrum. OEM assembly plants for BMW, Isuzu, and Nissan consume polyurethane and epoxy bonding agents in body-in-white and battery-pack lines, while converters in Midrand dispense water-borne acrylics for corrugated shippers feeding e-commerce distribution hubs. Growth moderates as greenfield industrial projects migrate to lower-cost provinces, yet recurring maintenance, aftermarket activity, and retail distribution keep baseline adhesive demand stable.
The Western Cape is outstripping national averages. Wine exports of 420 million liters in 2024 require moisture-resistant label adhesives that survive refrigerated logistics and dew-point cycling. Avery Dennison’s CleanFlake technology supports PET-bottle recycling compliance with the 2027 Extended Producer Responsibility rules. Furniture workshops in Cape Town’s industrial zones apply ambient-cure polyurethane and PVA formulations to navigate load-shedding schedules without thermal presses. Simultaneously, a pipeline of green-hydrogen installations in Saldanha Bay elevates demand for epoxy and silicone sealants rated for high-pressure electrolysis piping.
Eastern Cape, KwaZulu-Natal, and remaining provinces collectively contribute the balance. KwaZulu-Natal’s Durban port spurs marine-grade silicone uptake for container-repair yards and shipbuilders. Overall, Gauteng and Western Cape still account for more than 60% of the South Africa adhesives market, yet Eastern Cape’s infrastructure axis positions it as the emergent growth pole.
Competitive Landscape
The South Africa adhesives market is moderately consolidated. Regional players, including Unikem, Alcolin, and Glue Devil, compete on price, short lead times, and omni-channel distribution, particularly in DIY and small-batch industrial uses. Henkel’s July 2025 acquisition of Nordbak, a 105-employee maintenance-repair-operations specialist, deepens aftermarket reach and widens engineering-epoxy exposure as mining and paper mills overhaul aging assets. Sika’s February 2026 purchase of Akkim for CHF 220 million broadens polyurethane and silicone capacity, creating a sub-Saharan platform to capture infrastructure sealing contracts.
White-space lies in bio-based systems where mimosa-tannin and soy-protein chemistries offer up to 40% VOC cuts, yet lack scale. Digital-printing adhesive innovators exploit short-run label demand via low-minimum-order programs. Technical capability is a competitive lever: suppliers able to commission UV-LED equipment and train converters secure pharmaceutical and electric-vehicle interior work, while legacy solvent-borne players face eroding margins under escalating disposal fees. Compliance with SABS VOC norms increasingly dictates tender eligibility, bifurcating the South Africa adhesives market into premium, accredited suppliers and value-tier vendors.
South Africa Adhesives Industry Leaders
Henkel AG & Co. KGaA
Sika AG
Arkema
H.B. Fuller Company
Dow
- *Disclaimer: Major Players sorted in no particular order

Recent Industry Developments
- July 2025: Henkel acquired Nordbak, expanding into maintenance-repair-operation adhesives with a workforce of 105.
- May 2025: H.B. Fuller added pressure-sensitive and hot-melt capacity at its Cairo plant, cutting South African converter lead times to 2-4 weeks.


South Africa Adhesives Market Report Scope
Adhesives are materials designed to bond surfaces together effectively, ensuring durability and resistance to separation. Various industries, including building and construction, packaging, automotive, aerospace, woodworking and joinery, footwear, healthcare, and other end-user sectors, rely on specific types of adhesives tailored to their composition and functional requirements.
The South Africa adhesives market is segmented by resin type, technology, and end-user industry. By resin type, the market is segmented into acrylic, cyanoacrylate, epoxy, polyurethane, silicone, VAE/EVA, and other resins. By technology, the market is segmented into hot melt, reactive, solvent-borne, UV-cured, and water-borne. By end-user industry, the market is segmented into aerospace, automotive, building and construction, footwear and leather, healthcare, packaging, woodworking and joinery, and other end-user industries. For each segment, the market sizing and forecasts have been done based on revenue (USD).
By Resin Type
| Acrylic |
| Cyanoacrylate |
| Epoxy |
| Polyurethane |
| Silicone |
| VAE / EVA |
| Other Resins |
By Technology
| Hot-Melt |
| Reactive |
| Solvent-Borne |
| UV-Cured |
| Water-Borne |
By End-User Industry
| Aerospace |
| Automotive |
| Building and Construction |
| Footwear and Leather |
| Healthcare |
| Packaging |
| Woodworking and Joinery |
| Other End-Users |
| By Resin Type | Acrylic |
| Cyanoacrylate | |
| Epoxy | |
| Polyurethane | |
| Silicone | |
| VAE / EVA | |
| Other Resins | |
| By Technology | Hot-Melt |
| Reactive | |
| Solvent-Borne | |
| UV-Cured | |
| Water-Borne | |
| By End-User Industry | Aerospace |
| Automotive | |
| Building and Construction | |
| Footwear and Leather | |
| Healthcare | |
| Packaging | |
| Woodworking and Joinery | |
| Other End-Users |


Market Definition
- End-user Industry - Building & Construction, Packaging, Automotive, Aerospace, Woodworking & Joinery, Footwear & Leather, Healthcare, and Others are the end-user industries considered under the adhesives market.
- Product - All adhesive products are considered in the market studied
- Resin - Under the scope of the study, resins like Polyurethane, Epoxy, Acrylic, Cyanoacrylate, VAE/EVA, and Silicone are considered
- Technology - For the purpose of this study, Water-borne, Solvent-borne, Reactive, Hot Melt, and UV Cured adhesive technologies are taken into consideration.
| Keyword | Definition |
|---|---|
| Hot-melt Adhesive | Hot melt adhesives are generally 100% solid formulations, based on thermoplastic polymers. They are solid at room temperature and are activated upon heating above their softening point, at which stage they are liquid, and hence, can be processed. |
| Reactive Adhesive | A reactive adhesive is made up of monomers that react in the adhesive curing process and do not evaporate from the film during use. Instead, these volatile components become chemically incorporated into the adhesive. |
| Solvent-borne Adhesive | Solvent-borne adhesives are mixtures of solvents and thermoplastic, or slightly cross-linked polymers, such as polychloroprene, polyurethane, acrylic, silicone, and natural and synthetic rubbers (elastomers). |
| Water-borne Adhesive | Water-borne adhesives use water as a carrier or diluting medium to disperse a resin. They are set by allowing the water to evaporate or be absorbed by the substrate. These adhesives are compounded with water as a diluent, rather than a volatile organic solvent. |
| UV Cured Adhesive | UV curing adhesives induce curing and create a permanent bond without heating by using ultraviolet (UV) light or other radiation sources. An aggregation of monomers and oligomers is cured or polymerized by ultraviolet (UV) or visible light in a UV adhesive. Because UV is a radiating energy source, UV adhesives are often referred to as radiation curing or rad-cure adhesives. |
| Heat-resistant Adhesive | Heat-resistant Adhesives refer to those that do not break down under high temperatures. One aspect of a complicated system of circumstances is the adhesive's capacity to withstand disintegration brought on by high temperatures. As the temperature rises, adhesives may liquefy. They can withstand stresses resulting from differing coefficients of expansion and contraction, which might be an additional advantage. |
| Reshoring | Reshoring is the practice of moving commodity production and manufacturing back to the nation where the business was founded. Onshoring, inshoring, and back shoring are further terms used. Offshoring, the practice of producing items abroad to lower labor and manufacturing costs, is the opposite of this. |
| Oleochemicals | Oleochemicals are compounds produced from biological oils or fats. They resemble petrochemicals, which are substances made from petroleum. The oleochemical business is built on the hydrolysis of oils or fats. |
| Nonporous Materials | Nonporous materials are substances that do not permit the passage of liquid or air. Nonporous materials are those that are not porous, such as glass, plastic, metal, and varnished wood. Since no air can get through, less airflow is required to raise these materials, negating the requirement for high airflow. |
| EU-Vietnam Free Trade Agreement | A trade agreement and an investment protection agreement were concluded between the European Union and Vietnam on June 30, 2019. |
| VOC content | Compounds with limited solubility in water and high vapor pressure are known as Volatile Organic Compounds (VOCs). Many VOCs are human-made chemicals that are used and produced in the manufacture of paints, pharmaceuticals, and refrigerants. |
| Emulsion Polymerization | Emulsion polymerization is a method of producing polymers or connected groups of smaller chemical chains known as monomers, in a water solution. The method is often used to make water-based paints, adhesives, and varnishes, in which the water stays with the polymer and is marketed as a liquid product. |
| 2025 National Packaging Targets | In 2018, the Australian Environment Ministry set the following 2025 National Packaging Targets: 100% of the packaging must be reusable, recyclable, or compostable by 2025, 70% of plastic packaging must be recycled or composted by 2025, 50% of average recycled content must be included in packaging by 2025, and problematic and unnecessary single-use plastic packaging must be phased out by 2025. |
| Russian Government’s Import Substitution Policy | The Western sanctions suspended the distribution of several high-tech items to Russia, including those required by the raw material export sectors and the military-industrial complex. In response, the government launched an "import substitution" scheme, appointing a special commission to oversee its implementation in early 2015. |
| Paper Substrate | Paper substrates are paper sheets, reels, or boards with a base weight of up to 400 g/m2 that has not been converted, printed or otherwise altered. |
| Insulation Material | A material that inhibits or blocks heat, sound, or electrical transmission is known as Insulation Material. The variety of insulation materials includes thick fibers like fiberglass, rock and slag wool, cellulose, and natural fibers as well as stiff foam boards and sleek foils. |
| Thermal Shock | A temperature change known as thermal shock generates stress in a material. It commonly results in material breakdown and is especially prevalent in brittle materials like ceramics. When there is a quick temperature change, either from hot to cold or vice versa, this process occurs abruptly. It occurs more frequently in materials with poor heat conductivity and insufficient structural integrity. |


Research Methodology
Mordor Intelligence follows a four-step methodology in all our reports.
- Step-1: Identify Key Variables: The quantifiable key variables (industry and extraneous) pertaining to the specific product segment and country are selected from a group of relevant variables & factors based on desk research & literature review; along with primary expert inputs. These variables are further confirmed through regression modeling (wherever required).
- Step-2: Build a Market Model: In order to build a robust forecasting methodology, the variables and factors identified in Step-1 are tested against available historical market numbers. Through an iterative process, the variables required for market forecast are set and the model is built on the basis of these variables.
- Step-3: Validate and Finalize: In this important step, all market numbers, variables and analyst calls are validated through an extensive network of primary research experts from the market studied. The respondents are selected across levels and functions to generate a holistic picture of the market studied.
- Step-4: Research Outputs: Syndicated Reports, Custom Consulting Assignments, Databases & Subscription Platforms


