Smart Water Management Market Size and Share
Market Overview
| Study Period | 2020 - 2031 |
|---|---|
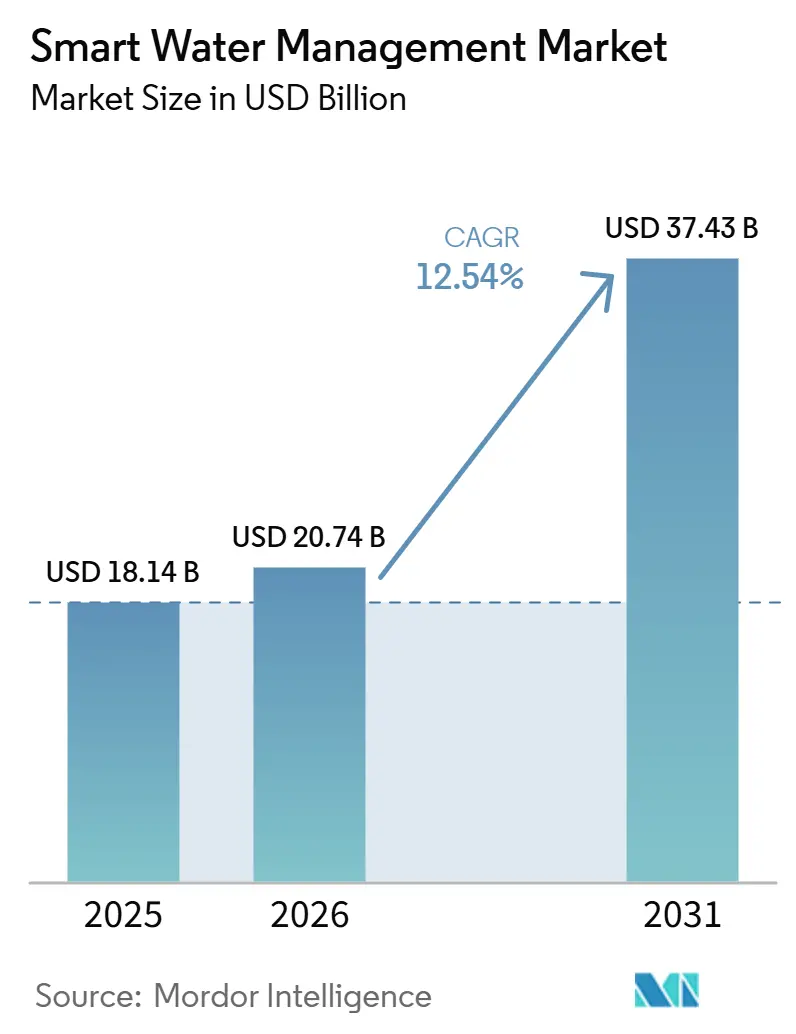
| Market Size (2026) | USD 20.74 Billion |
| Market Size (2031) | USD 37.43 Billion |
| Growth Rate (2026 - 2031) | 12.54% CAGR |
| Fastest Growing Market | Asia Pacific |
| Largest Market | North America |
| Market Concentration | Medium |
Major Players *Disclaimer: Major Players sorted in no particular order Image © Mordor Intelligence. Reuse requires attribution under CC BY 4.0. | |
Smart Water Management Market Analysis by Mordor Intelligence
The smart water management market size stands at USD 20.74 billion in 2026 and is projected to reach USD 37.43 billion in 2031, delivering a 12.54% CAGR through the forecast period. Utilities are moving away from reactive maintenance toward predictive asset stewardship, a shift reinforced by non-revenue water losses that erode 30-50% of supply in several emerging economies and by regulators tying tariff approvals to leak-reduction milestones. Residential demand for advanced metering infrastructure is now accelerating fastest, fueled by mandates for granular consumption data that support tiered tariffs and conservation goals. Services revenue, which covers managed operations and professional integration, is expanding more quickly than hardware sales as utilities outsource SCADA integration, meter-data management, and cybersecurity monitoring. Communication preferences remain fragmented - RF mesh networks still dominate installed bases, yet cellular NB-IoT and LoRaWAN connections are eroding share on the strength of longer battery life and lower connectivity fees. In geographical terms, North America remains the revenue leader, but Asia Pacific attracts a larger share of incremental capital, reflecting the steep efficiency gains sought in water-stressed growth markets.
Key Report Takeaways
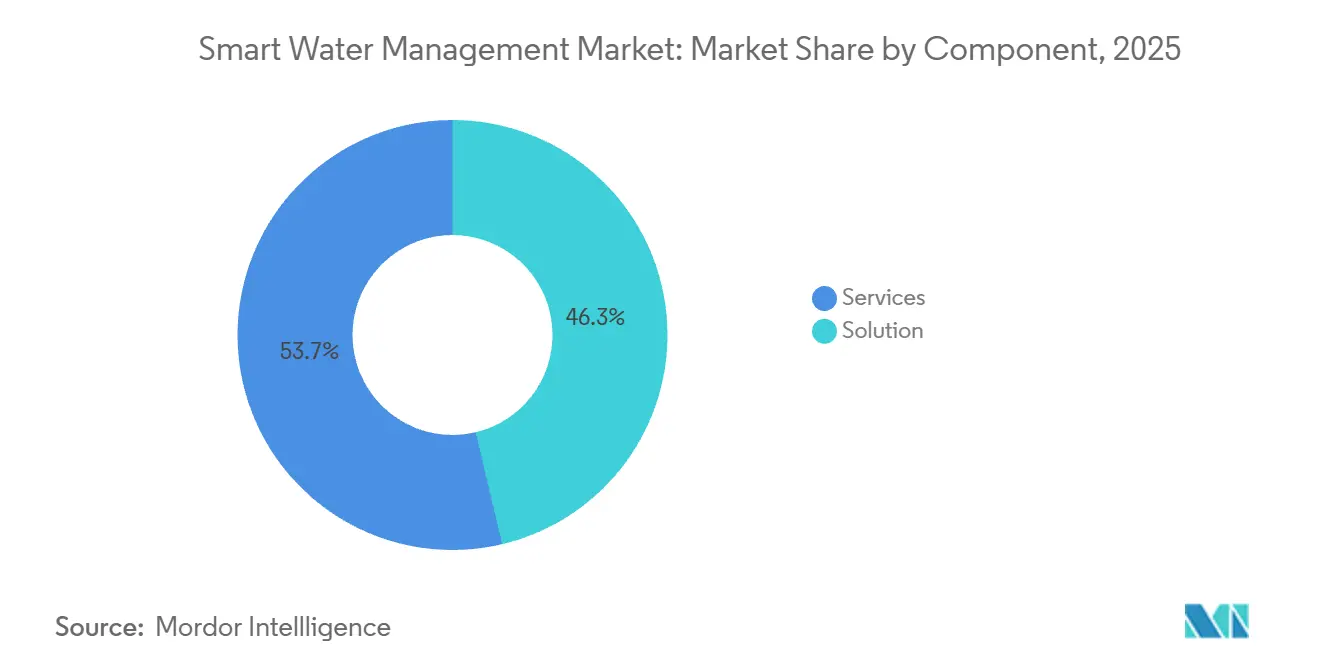
- By component, solution deployments held 46.28% of smart water management market share in 2025 while services are forecast to expand at a 14.81% CAGR through 2031.
- By end user, the public-sector segment captured 41.83% of the smart water management market size in 2025, whereas the residential segment is advancing at a 15.23% CAGR to 2031.
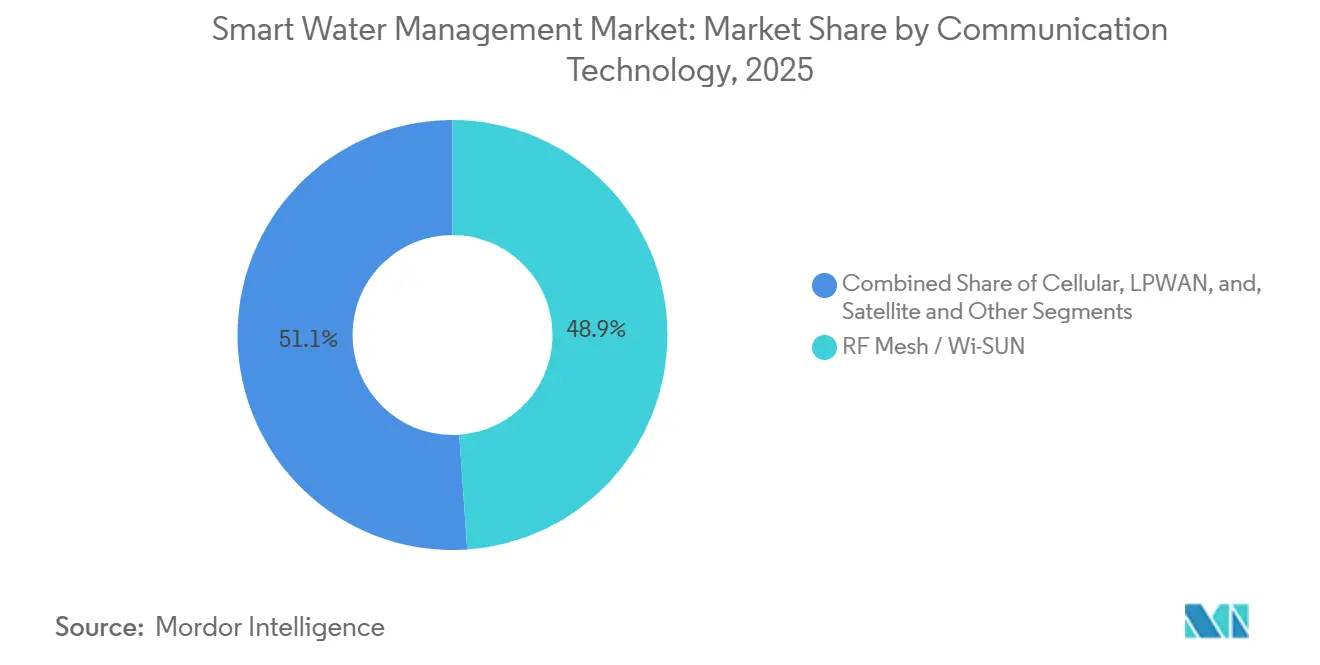
- By communication technology, RF mesh commanded 48.91% share of the smart water management market in 2025, yet LPWAN standards are projected to grow at a 13.67% CAGR over the same period.
- By application, water distribution management led with 38.17% revenue share in 2025; irrigation management is forecast to register the highest CAGR at 14.92% through 2031.
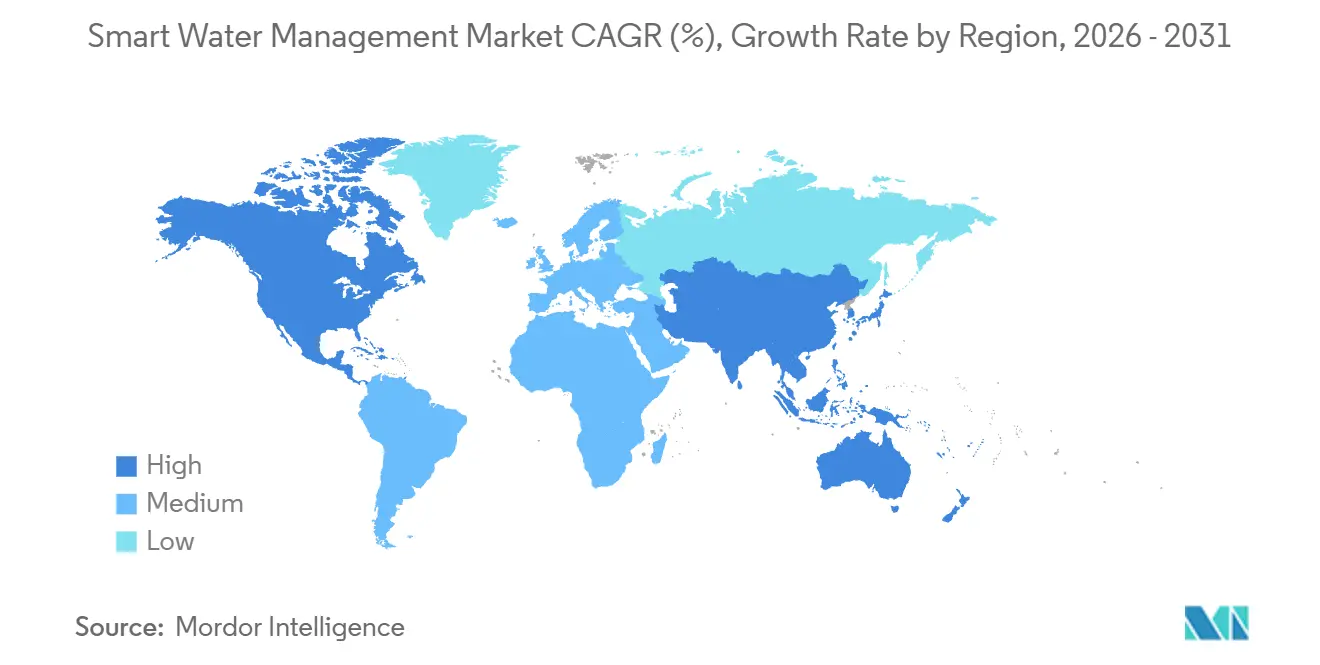
- By geography, North America secured 34.71% of smart water management market share in 2025, while Asia Pacific is set to post a 14.61% CAGR up to 2031.
Note: Market size and forecast figures in this report are generated using Mordor Intelligence’s proprietary estimation framework, updated with the latest available data and insights as of January 2026.
Global Smart Water Management Market Trends and Insights
Drivers Impact Analysis*
| Driver | (~) % Impact on CAGR Forecast | Geographic Relevance | Impact Timeline |
|---|---|---|---|
| Growing Need to Manage Rising Global Water Demand | +2.8% | Global, acute in Middle East, North Africa, South Asia | Long term (≥ 4 years) |
| Rising Pressure to Curb Non-Revenue Water Losses | +3.1% | Global, pronounced in Latin America, Sub-Saharan Africa, South Asia | Medium term (2-4 years) |
| Government Smart-City and Sustainability Mandates | +2.4% | North America, Europe, China, India, UAE, Saudi Arabia | Medium term (2-4 years) |
| Rapid Adoption of LPWAN Connectivity | +1.9% | Global, early penetration in Europe and Asia Pacific | Short term (≤ 2 years) |
| Digital-Twin Platforms for Predictive Modeling | +1.2% | North America, Western Europe, Australia | Medium term (2-4 years) |
| AI-Driven Adaptive Pressure Control | +1.0% | Global, pilot use in Europe, North America, Middle East | Long term (≥ 4 years) |
| Source: Mordor Intelligence | |||


Growing Need to Manage Rising Global Water Demand
Urban expansion and industrial development place mounting stress on finite freshwater reserves, prompting utilities to maximize existing infrastructure rather than invest in new supply. India’s Jal Jeevan Mission, which aims to provide piped water to 146 million rural households, relies on remote monitoring to maintain service-level targets for its dispersed assets.[1]Ministry of Jal Shakti, “Jal Jeevan Mission Targets,” jaljeevanmission.gov.in The United Arab Emirates mandates the use of smart meters to enforce quotas across agricultural and residential accounts as desalination dependence increases. Singapore’s NEWater program, which now meets 40% of the nation's demand, integrates real-time quality sensors and analytics to optimize blending ratios, illustrating how scarcity accelerates digital adoption. Drought episodes in the western United States and southern Europe further prompt regulators to become champions of consumption visibility, solidifying a long-term 2.8-percentage-point increase in the smart water management market.
Rising Pressure to Curb Non-Revenue Water Losses
Average non-revenue water rates run 30-50% in many developing regions, draining utility cash flow and wasting energy tied to pumping and treatment. Herning, Denmark trimmed losses from 8.5% to 6% within a year after installing 18,000 NB-IoT meters, highlighting the payoff from continuous acoustic monitoring. SUEZ saved 33 million m³ in 2024 enough for 660,000 people through a global fleet of 7 million connected meters. California’s regulator now ties allowed rate hikes to audited leak-reduction results, reinforcing investment urgency. The driver contributes a medium-term 3.1-percentage-point boost to growth.
Government Smart-City and Sustainability Mandates
Smart-city programs bundle water projects with broader digital infrastructure, creating procurement synergies that favor integrated platforms. China’s 14th Five-Year Plan channels capital into Sponge Cities that embed IoT permeable pavements and runoff sensors. India’s Smart Cities Mission funded pilots in Pune and Jaipur linking SCADA to real-time pressure balancing. Saudi Arabia is pursuing complete smart-meter coverage in major cities under Vision 2030, coupling water and electricity to spread network costs. Updated EU discharge limits also push continuous nutrient sensing. Collectively, mandates inject a 2.4-percentage-point lift to CAGR within a medium-term horizon.
Rapid Adoption of LPWAN Connectivity
Low-power wide-area networks cut connectivity fees to USD 1-3 annually while extending battery life to 10-15 years. SUEZ and Vodafone plan to deploy 2 million NB-IoT meters by 2030 across Europe and Africa. Kamstrup’s Connect service bundles hardware, data plans, and cloud analytics under a subscription model that flips capital outlays into predictable operating costs. Municipal LoRaWAN networks, such as Antwerp’s citywide grid, host multipurpose sensors at minimal incremental expense. The result is a short-term 1.9-percentage-point contribution to CAGR as carriers subsidize modules to lock in annuity connectivity revenue.
Restraints Impact Analysis*
| Restraint | (~) % Impact on CAGR Forecast | Geographic Relevance | Impact Timeline |
|---|---|---|---|
| Capital-Intensive Nature of Metering Upgrades | -2.3% | Global, acute in emerging markets with constrained budgets | Medium term (2-4 years) |
| Interoperability Gaps Across Legacy OT-IT Systems | -1.4% | North America and Europe with aging SCADA infrastructure | Short term (≤ 2 years) |
| Cyber-Security Vulnerabilities in OT Networks | -1.1% | Global, heightened in digitally advanced regions | Medium term (2-4 years) |
| Tariff-Driven Cost Inflation for IoT Components | -0.8% | Global, most pronounced in electronics supply chains tied to China | Short term (≤ 2 years) |
| Source: Mordor Intelligence | |||
Capital-Intensive Nature of Metering and Network Upgrades
Advanced metering infrastructure typically costs USD 200-400 per endpoint, stretching payback to 5-10 years. Many municipal utilities must first service debt or expand basic coverage, pushing digital projects into later budget cycles. Rate recovery often trails deployment, forcing up-front financing from retained earnings. Badger Meter noted that U.S. municipal budgets cluster orders late in fiscal years, underscoring episodic funding. While public-private contracts such as Landis+Gyr’s 15-year deal with Denmark’s TREFOR can shift risk to vendors, the restraint still subtracts 2.3 percentage points from CAGR during the medium term.
Interoperability Gaps Across Legacy OT-IT Systems
Utilities operate SCADA assets with 20-year life cycles built on proprietary protocols that resist cloud linkage. Middleware gateways and custom APIs add complexity, latency, and cyber risk. Schneider Electric’s 2025 move to embed SUEZ’s Aquadvanced into EcoStruxure shows vendor consolidation is one way forward, yet many utilities juggle multi-vendor estates that will take years to harmonize. The American Water Works Association’s updated M2M data schema is voluntary, leaving legacy data silos in place and shaving 1.4 percentage points from near-term growth.
*Our forecasts treat driver/restraint impacts as directional, not additive. The impact forecasts reflect baseline growth, mix effects, and variable interactions.
Segment Analysis
By Component: Services Accelerate as Utilities Outsource Complexity
Services revenue in the smart water management market rose briskly and is projected to maintain a 14.81% CAGR to 2031, eclipsing the slower expansion in perpetual-license solutions. Managed offerings, which combine network monitoring, cybersecurity, and cloud hosting, appeal to midsize utilities that prefer predictable fees to new head-count commitments. Professional services covering integration and regulatory compliance are likewise expanding as project scope widens. Vendors are packaging end-to-end bundles, illustrated by the March 2025 Itron-Schneider Electric collaboration that merges metering hardware with edge-computing software into a turnkey deliverable.
Solution deployments still represented 46.28% of 2025 revenue and retain importance where asset ownership and onsite control remain strategic. Distribution-network monitoring platforms pull in real-time pressure and flow data, while asset-management modules support utilities pursuing ISO 55000 certification.[2]International Organization for Standardization, “ISO 55000: Asset Management,” iso.org Analytics solutions are the fastest-growing slice within solutions, tying machine-learning insights to capital-planning decisions in systems facing trillion-dollar deferred maintenance backlogs across North America. As margins migrate from hardware to software, suppliers are recalibrating portfolios toward subscription analytics and outcome-based contracts, a trend likely to keep narrowing the share gap between services and solutions through 2031.

By End User: Residential Demand Sets the Pace Under Regulatory Pressure
Residential deployments are forecast to grow 15.23% annually, overtaking the historically dominant public-sector segment. California’s 2024 rules compel individual residential metering, accelerating retrofits of millions of unmetered connections.[3]California Department of Water Resources, “Water Loss Performance Standards,” water.ca.gov Tiered tariffs require hourly or daily reads, driving LPWAN adoption. Connected home dashboards and leak-alert mobile apps, once optional, are becoming standard as utilities adopt customer engagement models drawn from power retail.
Public-sector users, which include municipal utilities and government facilities, held 41.83% of smart water management market size in 2025 by virtue of capital access and policy mandates. Nevertheless, constrained municipal budgets can slow refresh cycles. Commercial and industrial customers occupy a middle ground; sub-metering helps property owners allocate costs, while factories seek process-water optimization to mitigate production risk. Itron’s 2025 move to buy Locusview underscores the appeal of pairing field-service management with network analytics for utility and industrial operators alike.
By Communication Technology: LPWAN Chips Away at Legacy Mesh Dominance
RF mesh systems retained a 48.91% share in 2025 thanks to sunk gateway investments and proprietary protocol lock-in. Even so, LPWAN alternatives, primarily NB-IoT and LoRaWAN, are expanding at a 13.67% CAGR as module prices decline and battery life extends beyond a decade. The SUEZ-Vodafone alliance aims to roll out 2 million NB-IoT meters by 2030, capturing this momentum. Carriers often subsidize modules to secure connectivity annuities, tilting the total cost of ownership against legacy mesh.
LoRaWAN offers unlicensed spectrum and municipal ownership of private networks, proven by Antwerp’s multipurpose deployment covering 100 km² at modest cost. Satellite and hybrid backhaul connections serve remote geographies but remain a niche market, with a share of less than 5%. As cyber threats intensify following the 2024 American Water Works breach, utilities are segmenting data flows and auditing firmware more rigorously, placing new security compliance burdens on both mesh and LPWAN vendors.

By Application: Irrigation Management Emerges as the Fastest-Growing Use Case
Water distribution management controlled 38.17% of 2025 revenue, anchored in leak detection and pressure optimization that yield immediate financial payback. Yet, irrigation management is advancing at a 14.92% CAGR because agriculture accounts for 70% of global freshwater withdrawals. Soil moisture probes, weather-based scheduling, and variable-rate drip emitters reduce consumption by 20-40% while boosting yields, attracting new investment in India’s sugarcane belts and California’s almond orchards. Municipal landscapes are following suit as cities adopt controllers that cease watering during rainfall.
Leak detection and consumption monitoring remain critical for residential, commercial, and industrial customers. Cloud-native analytics platforms such as TaKaDu apply pattern recognition across millions of endpoints to differentiate genuine leaks from meter drift. Wastewater use cases are growing, as highlighted by Badger Meter’s January 2025 acquisition of SmartCover, which extends sensing capabilities into sewers and manholes. Flood and stormwater management solutions that integrate permeable pavements and runoff sensors are gaining attention under China’s Sponge Cities initiative, although their current revenue contribution is smaller relative to distribution and irrigation.
Geography Analysis
North America retained 34.71% of the smart water management market share in 2025, sustained by robust U.S. regulatory frameworks that compel leak audits and cyber-hardening. Adoption is poised to continue, yet growth moderates as most tier-one utilities have already installed AMI networks. Federal infrastructure grants supplement local budgets, but incremental deployments increasingly focus on analytics overlays rather than meter rollouts.
Asia Pacific is on track for a 14.61% CAGR to 2031, reflecting large-scale digitization programs in China and India. China’s Sponge Cities and 14th Five-Year Plan funnel capital into real-time runoff management and water conservation. India’s Jal Jeevan Mission is deploying smart sensors throughout rural networks to maintain service levels across 146 million households. Southeast Asian nations, including Indonesia and Vietnam, are planning similar moves as urbanization accelerates and climate variability worsens.
Europe balances stringent environmental directives with aging infrastructure. Germany and France are upgrading meters to comply with the 2024 revision of the Water Framework Directive, while the United Kingdom’s regulator ties allowable returns to demonstrated efficiency gains, spurring analytics adoption. South America and Africa trail in absolute spending but represent long-run upside. Brazilian concessionaires are trimming non-revenue water to unlock tariff hikes, and Gulf Cooperation Council states bundle desalination and distribution projects with utility-wide smart-meter targets under ambitious national visions.

Competitive Landscape
The ten leading vendors account for roughly 45% of global revenue, indicating a moderately fragmented field. Conglomerates such as Xylem, Siemens, ABB, and Schneider Electric leverage SCADA footprints to cross-sell analytics, but margins are shifting from hardware toward cloud subscriptions. Xylem’s October 2025 plan to divest non-North American metering assets marks a shift to higher-margin digital services, following its 2024 acquisition of a majority stake in Idrica. Itron’s USD 525 million purchase of Locusview illustrates a trend toward bundling field-service management with metering data into an end-to-end visibility stack.
Software-native challengers, including TaKaDu, i2O Water, and Idrica, differentiate through cloud-based leak detection and pressure optimization algorithms that remain vendor-agnostic. Patents reveal an accelerating trend in R&D around edge analytics and hydraulic transient prediction. Cybersecurity has become a decisive battleground since the 2024 American Water Works breach, elevating demand for zero-trust architectures and managed security services that smaller vendors are racing to embed out of the box.[4]Cybersecurity and Infrastructure Security Agency, “Water Sector Advisory,” cisa.gov
Regional specialists are filling white spaces in irrigation management and in under-digitized geographies such as sub-Saharan Africa. Public-private partnership models, typified by Landis+Gyr’s 15-year managed-services contract with Denmark’s TREFOR, illustrate alternative financing routes that could reshape vendor-customer risk sharing. Overall, competitive intensity rests on securing long-term recurring revenue streams while balancing openness against lock-in for utilities that increasingly require multi-vendor interoperability.
Smart Water Management Industry Leaders
Xylem Inc. (incl. Sensus)
Itron Inc.
ABB Ltd.
Siemens AG
Schneider Electric SE (+AVEVA)
- *Disclaimer: Major Players sorted in no particular order

Recent Industry Developments
- November 2025: Itron agreed to acquire Locusview for USD 525 million, adding field-service optimization to its portfolio.
- October 2022: Xylem announced plans to divest metering assets outside North America to fund acquisitions in predictive analytics.
- May 2025: SUEZ and Schneider Electric deepened their collaboration to integrate AQUADVANCED into EcoStruxure across water and energy verticals.
- January 2025: Badger Meter closed its USD 185 million purchase of SmartCover Systems, expanding into sewer-level monitoring.


Research Methodology Framework and Report Scope
Market Definitions and Key Coverage
Our study defines the smart water management market as connected hardware, software, and managed services that collect, transmit, and analyze data from water networks so utilities, industries, and households can detect leaks, cut energy use, and optimize distribution in near-real time.
Scope Exclusions: Conventional treatment equipment that operates without digital sensing or two-way communication is kept outside the boundary.
Segmentation Overview
- By Component
- By Solution
- Enterprise Asset Management
- Distribution Network Monitoring
- Supervisory Control and Data Acquisition (SCADA)
- Meter Data Management
- Analytics
- Other Solutions
- By Services
- Professional Services
- Managed Services
- By Solution
- By End User
- Residential
- Commercial
- Industrial and Public Utilities
- By Communication Technology
- Cellular (2G/3G/4G/5G, NB-IoT)
- LPWAN (LoRaWAN, Sigfox)
- RF Mesh / Wi-SUN
- Satellite and Others
- By Application
- Water Pipeline Monitoring and Leak Detection
- Water Consumption and Distribution
- Irrigation Management
- Wastewater Monitoring
- Flood and Stormwater Management
- By Geography
- North America
- United States
- Canada
- Mexico
- South America
- Brazil
- Argentina
- Rest of South America
- Europe
- Germany
- United Kingdom
- France
- Italy
- Spain
- Russia
- Rest of Europe
- Asia Pacific
- China
- Japan
- South Korea
- India
- Australia
- New Zealand
- Rest of Asia Pacific
- Middle East
- United Arab Emirates
- Saudi Arabia
- Turkey
- Rest of Middle East
- Africa
- South Africa
- Nigeria
- Kenya
- Rest of Africa
- North America
Detailed Research Methodology and Data Validation
Primary Research
Analysts next interviewed distribution engineers at municipal utilities across North America, Europe, and Asia Pacific, plus solution integrators and metering OEMs. These conversations confirmed adoption rates, average sensor lifetimes, and service mark-ups that were only partially visible in secondary sources, letting us adjust key assumptions with field insight.
Desk Research
We began by mapping published data from leading open sources such as the United Nations FAO AQUASTAT, the International Water Association, Eurostat's water statistics, and US EPA Smart Utility reports. We then cross-checked infrastructure funding figures from World Bank project sheets. Company 10-Ks, investor decks, and utility tariff filings gave us cost curves and roll-out schedules. Subscriber tools inside D&B Hoovers and Dow Jones Factiva supplied revenue splits for listed meter makers and platform vendors. This list is illustrative; many other public repositories were tapped to fill smaller gaps.
Market-Sizing & Forecasting
A top-down build started with regional water utility spending and non-revenue-water loss values, which are then paired with smart meter penetration ratios, communication module attach rates, and typical annual service charges. Select bottom-up checks, supplier revenue roll-ups and sampled ASP × unit shipments, validated totals. Critical model drivers include leak incidence, utility digitization budgets, IoT module costs, regulatory grant disbursements, and residential billing reforms. Multivariate regression linked these drivers to historic spend, allowing five-year forecasts. Scenario analysis handled policy or climate shocks. Data voids in the bottom-up layer were bridged by calibrated ratios guided by expert interviews.
Data Validation & Update Cycle
Before sign-off, outputs pass anomaly tests and peer review inside Mordor. Material variances trigger re-contact with sources. Models refresh every twelve months, with interim tweaks if major funding, drought, or policy events shift the baseline.
Why Mordor's Smart Water Management Baseline Commands Reliability
Published estimates often differ because studies track unlike scopes, currencies, and refresh cadences. Mordor's disciplined boundary setting, annual refresh, and dual-path modeling keep our numbers dependable for planners.
Benchmark comparison
| Market Size | Anonymized source | Primary gap driver |
|---|---|---|
| USD 18.39 billion (2025) | Mordor Intelligence | - |
| USD 20.08 billion (2025) | Global Consultancy A | Emphasizes meter hardware, lighter on platform and service revenue, limited geographic weighting |
| USD 16.6 billion (2023) | Industry Association B | Older base year, linear escalation, excludes managed services |
| USD 17.53 billion (2025) | Regional Consultancy C | Utility-only scope, omits commercial estates and updates bi-annually |
In sum, Mordor Intelligence roots every figure in clearly stated scope choices, multi-source data, and repeatable checks, giving decision-makers a balanced, transparent baseline they can trace back to public metrics and on-ground voices.


Key Questions Answered in the Report
What is the current value of the smart water management market?
The market is valued at USD 20.74 billion in 2026 and is forecast to reach USD 37.43 billion by 2031.
Which segment of smart water management is expanding fastest?
Services, including managed and professional offerings, are projected to grow at a 14.81% CAGR through 2031.
Why is Asia Pacific considered the high-growth region?
Large-scale initiatives such as China’s Sponge Cities and India’s Jal Jeevan Mission drive a 14.61% regional CAGR by funding massive smart-meter and network-monitoring rollouts.
How are utilities reducing non-revenue water losses?
Utilities deploy smart meters, acoustic sensors, and analytics platforms that detect leaks early, cutting losses and improving billing accuracy.
What technologies are displacing legacy RF mesh networks?
Low-power wide-area networks, chiefly NB-IoT and LoRaWAN, offer lower connectivity fees and longer battery life, leading many utilities to shift future deployments.
What role does cybersecurity play in adoption decisions?
High-profile breaches have led utilities to invest in managed security services and zero-trust architectures, which are now critical criteria in vendor selection.
Page last updated on:


