Single-use Bioreactor Market Size and Share
Market Overview
| Study Period | 2020 - 2031 |
|---|---|
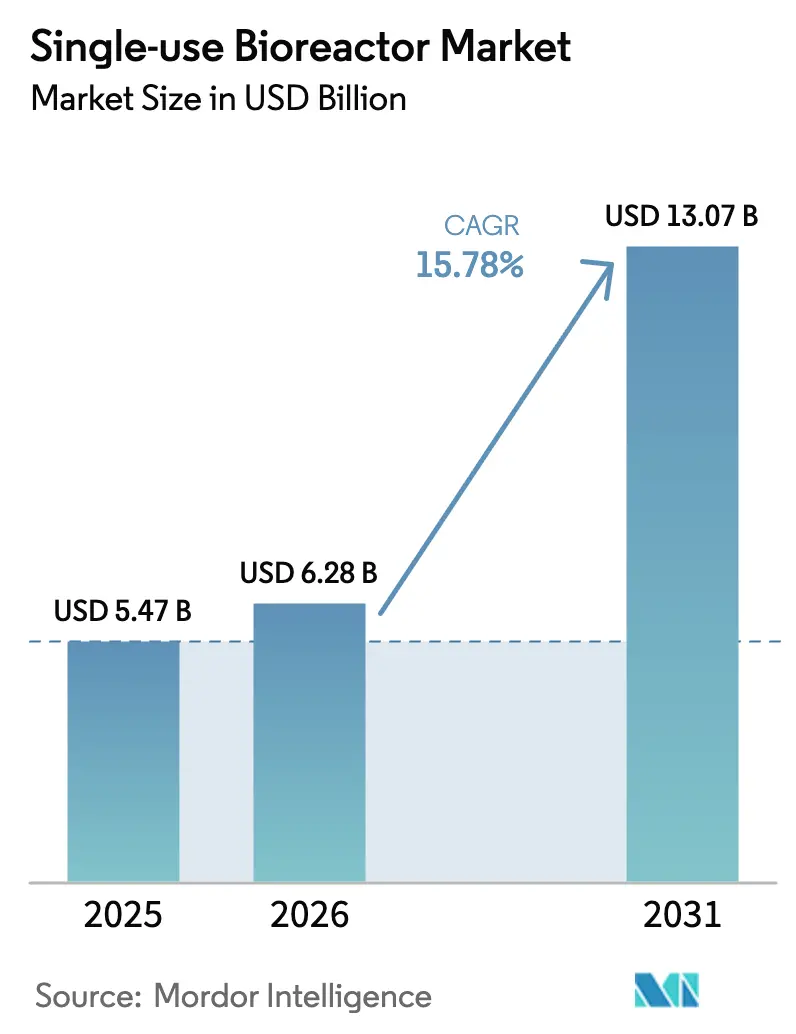
| Market Size (2026) | USD 6.28 Billion |
| Market Size (2031) | USD 13.07 Billion |
| Growth Rate (2026 - 2031) | 15.78% CAGR |
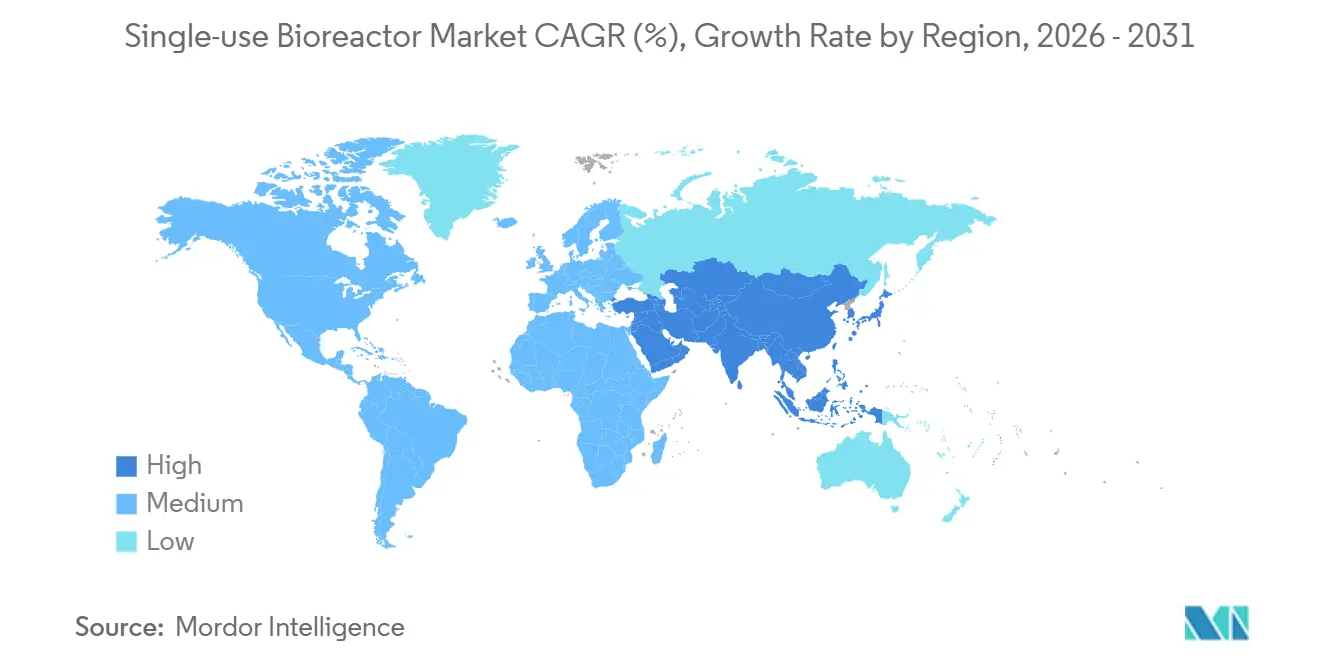
| Fastest Growing Market | Asia Pacific |
| Largest Market | North America |
| Market Concentration | Medium |
Major Players *Disclaimer: Major Players sorted in no particular order Image © Mordor Intelligence. Reuse requires attribution under CC BY 4.0. | |
Single-use Bioreactor Market Analysis by Mordor Intelligence
The Single-use Bioreactor Market size is projected to be USD 5.47 billion in 2025, USD 6.28 billion in 2026, and reach USD 13.07 billion by 2031, growing at a CAGR of 15.78% from 2026 to 2031.
Momentum rests on the shift from stainless-steel suites toward disposable platforms, the maturation of cell and gene therapies, and national vaccine-preparedness mandates. Mid-scale stirred-tank systems dominate installed capacity, yet rapid growth is visible in orbitally-shaken and wave-induced formats that support flexible, small-batch runs for autologous treatments.[1]Danaher Corporation, “2024 Annual Report,” Danaher Investor Relations, danaher.com Contract development and manufacturing organizations (CDMOs) are accelerating purchases as they lock in multi-year consumable revenue streams, while sovereign manufacturing initiatives in China, South Korea, and India favor modular, capital-light facilities. PFAS scrutiny and leachables compliance add cost and timeline risk, but expanded gamma-irradiation capacity and regulatory support for advanced manufacturing temper these headwinds.[2]U.S. Food and Drug Administration, “Advanced Manufacturing Technologies Designation Program,” U.S. Food and Drug Administration, fda.gov
Key Report Takeaways
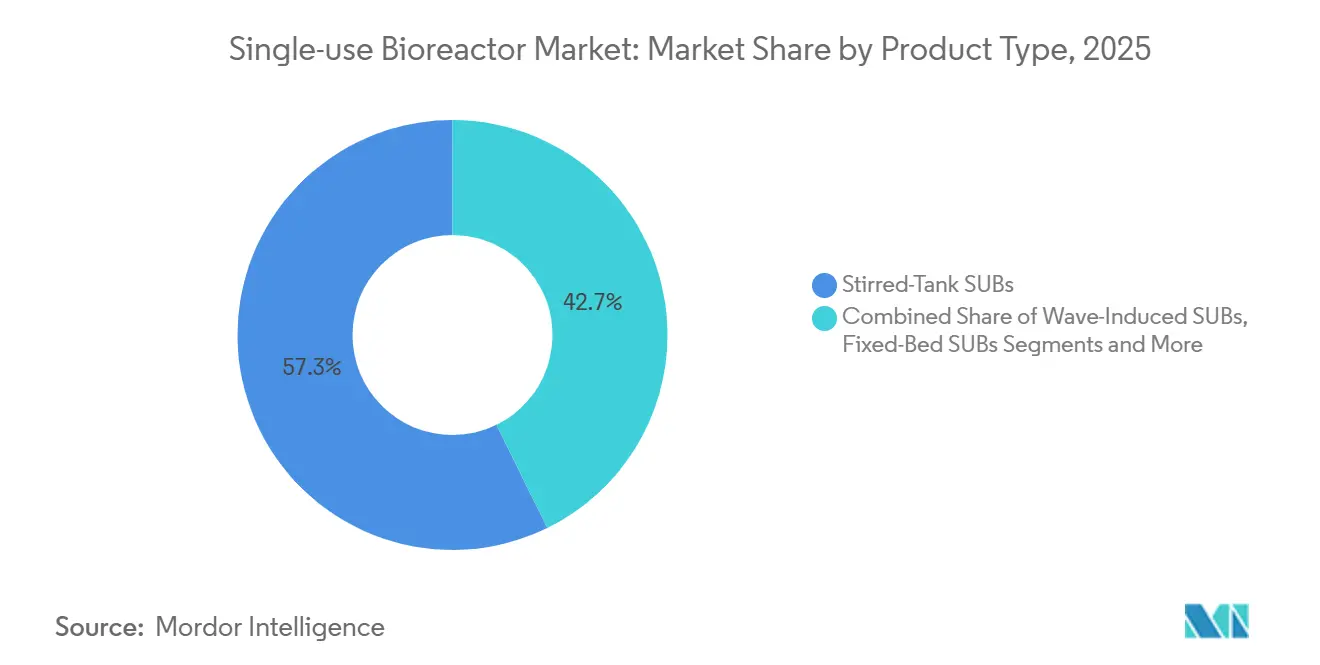
- By product type, stirred-tank systems held 57.26% of 2025 revenue, while orbitally-shaken and other niche formats are forecast to advance at an 18.68% CAGR through 2031.
- By volume range, 500–2,000 L vessels accounted for 43.72% of the single-use bioreactor market size in 2025, whereas sub-100 L units are projected to expand at a 19.42% CAGR over 2026-2031.
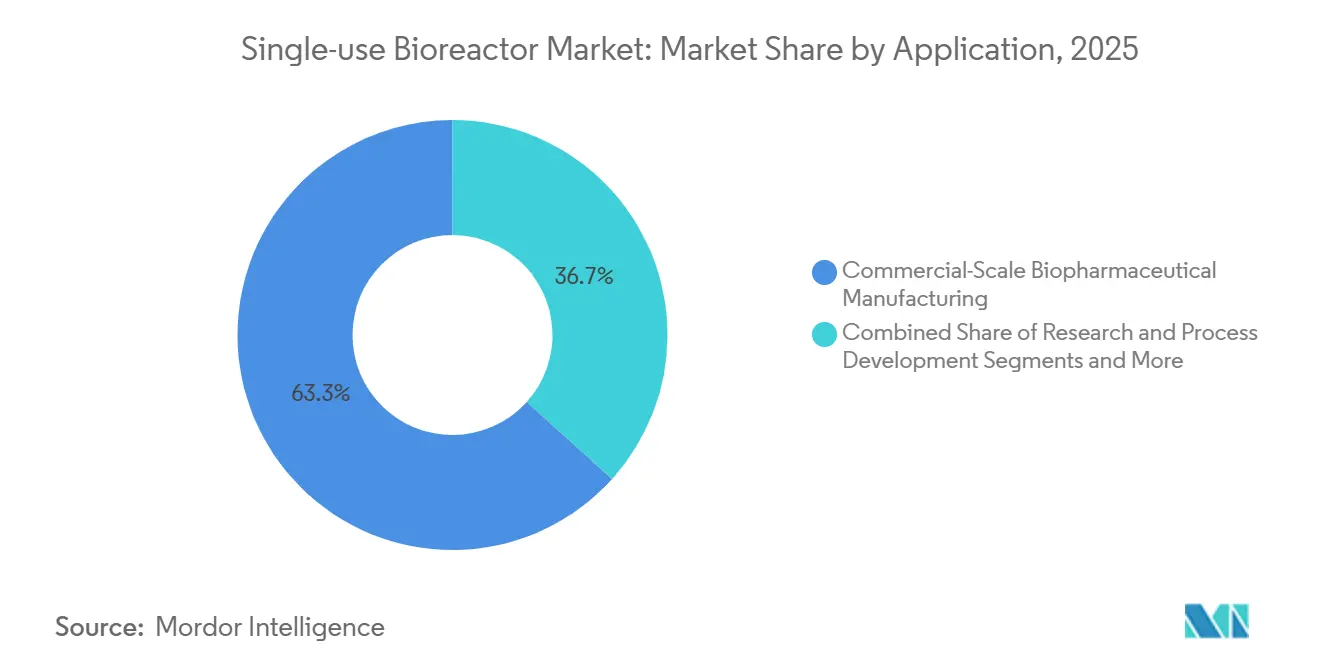
- By application, commercial-scale manufacturing commanded 63.33% of the 2025 total, while clinical-scale production is expected to post an 18.34% CAGR to 2031.
- By end-user, pharmaceutical and biopharmaceutical companies captured 69.21% of 2025 demand, whereas CDMOs/CMOs are anticipated to grow at a 17.53% CAGR during the forecast window.
- By geography, North America led with 36.11% revenue share in 2025, and Asia-Pacific is projected to register the fastest growth at a 17.02% CAGR through 2031.
Note: Market size and forecast figures in this report are generated using Mordor Intelligence’s proprietary estimation framework, updated with the latest available data and insights as of January 2026.
Global Single-use Bioreactor Market Trends and Insights
Drivers Impact Analysis*
| Driver | (~) % Impact on CAGR Forecast | Geographic Relevance | Impact Timeline |
|---|---|---|---|
| Shift from stainless-steel to disposable bioprocessing | +2.5% | North America, Europe, Global | Long term (≥ 4 years) |
| Rapid growth of cell & gene therapies | +3.2% | North America, Europe, Asia-Pacific | Medium term (2–4 years) |
| Cost-saving potential in early-stage clinical production | +1.8% | Global | Short term (≤ 2 years) |
| Accelerated vaccine programs post-COVID-19 | +2.1% | Global | Medium term (2–4 years) |
| Decentralized micro-facility models in emerging markets | +1.5% | Asia-Pacific, Middle East & Africa, South America | Long term (≥ 4 years) |
| Expanded γ-irradiation capacity | +1.2% | North America, Europe | Short term (≤ 2 years) |
| Source: Mordor Intelligence | |||
Intensifying Shift From Stainless-Steel to Disposable Bioprocessing Systems
Pharmaceutical manufacturers are retiring legacy stainless trains in favor of single-use platforms that remove cleaning validation, lower water use by up to 80%, and cut turnaround cycles from weeks to days. Danaher’s Cytiva division reported resurgent disposable-consumable sales in late 2024, underscoring dependence on bag assemblies and sensors. Sartorius indicated 75% of Bioprocess Solutions revenue stems from consumables, highlighting customer lock-in once validation is complete. Labor costs for steaming and documentation also tilt economics toward pre-sterilized bags in Western markets, although Indian and Chinese biosimilar firms still favor hybrid plants because import tariffs inflate consumable costs.
Rapid Growth of Cell & Gene Therapies Elevating Demand for Flexible Small-Batch Manufacturing
Autologous CAR-T treatments require 50 mL-10 L runs, volumes incompatible with 500 L stainless reactors. Bristol Myers Squibb reserved USD 380 million in capacity with Cellares in 2024 for its automated Cell Shuttle platform that pairs single-use bioreactors with closed cell-processing hardware.[3] Bristol Myers Squibb, “Capacity Reservation Agreement With Cellares,” Bristol Myers Squibb, bms.com FDA approvals for multiple CAR-T constructs in 2024-2025 and the agency’s Advanced Manufacturing Technologies pathway spur decentralized manufacturing near oncology centers. Univercells’ 50 L NevoLine system can be shipped in a container to remote clinics, reinforcing modular deployments.
Cost-Saving Potential in Early-Stage Clinical Production
Phase I/II campaigns often need 10-50 kg of drug substance. A single-use line eliminates the USD 5-15 million capex for stainless equipment and shortens build times by up to 60%. Thermo Fisher’s 5 L DynaDrive SUB, launched in 2025, lets universities deploy GMP-ready reactors without hiring cleaning-validation staff. Utility savings compound in Europe where wastewater rules add treatment costs, yet at ≥200 annual batches stainless steel regains a cost edge, explaining ongoing hybrid adoption.
Accelerated Vaccine Programs Post-COVID-19
Governments now require domestic capacity able to deliver 100 million doses within 100 days of pathogen sequencing. WHO technology-transfer hubs in South Africa, Argentina, and Bangladesh use modular single-use trains that pivot between strains within weeks. Merck KGaA’s 50-200 L Mobius ADC reactor supports potent payloads while addressing vaccine and oncology overlap.
Restraints Impact Analysis*
| Restraint | (~) % Impact on CAGR Forecast | Geographic Relevance | Impact Timeline |
|---|---|---|---|
| Leachables & extractables compliance uncertainty | -1.5% | Global | Medium term (2–4 years) |
| High recurring consumable costs | -2.0% | Global | Long term (≥ 4 years) |
| PFAS regulatory scrutiny on single-use plastics | -0.8% | North America, Europe | Medium term (2–4 years) |
| Limited scalability beyond 6,000 L | -1.3% | Global | Long term (≥ 4 years) |
| Source: Mordor Intelligence | |||
Leachables & Extractables Compliance Uncertainty
Multilayer polyethylene films may leach plasticizers that delay approvals. FDA and EMA require up to 18 months of studies costing USD 0.5-1 million per assembly. High-potency products heighten risk, prompting some Japanese sponsors to retain stainless tanks for commercial lots.
High Recurring Consumable Costs
A 2,000 L bag costs USD 3,000-8,000. Facilities running 50 batches spend USD 150,000-400,000 yearly before downstream consumables. Biosimilar makers in India, China, and Brazil struggle to protect margins when ex-factory prices undercut USD 100/g.
*Our forecasts treat driver/restraint impacts as directional, not additive. The impact forecasts reflect baseline growth, mix effects, and variable interactions.
Segment Analysis
By Product Type: Stirred-Tank Dominance Meets Niche Innovation
Stirred-tank systems commanded 57.26% of 2025 revenue, reinforcing their role as the workhorse for mammalian cell culture. The single-use bioreactor market size for stirred-tank units is sustained by antibody titers exceeding 5 g/L. Orbitally-shaken vessels are expanding at 18.68% annually on adoption by academic labs, while wave-induced designs serve seed-train and viral-vector work. PBS Biotech’s vertical-wheel approach improves oxygen transfer with lower shear. Thermo Fisher’s sensor-embedded DynaDrive extends digital monitoring into benchtop volumes.
Adoption patterns reflect validation stringency. Commercial antibody makers value historical data from stirred tanks, but early-stage gene therapy teams favor orbitals that fit inside biosafety cabinets. Fixed-bed reactors fill perfusion niches, while the single-use bioreactor industry continues to test hybrid perfusion/fed-batch models that reduce media use.


By Volume Range: Mid-Scale Anchors, Micro-Scale Surges
The 500-2,000 L band represented 43.72% of 2025 revenue and remains the core of CDMO offerings. The single-use bioreactor market share for this range aligns with Phase III batch sizes that yield 5-10 kg per run. Danaher’s 500 L and 2,000 L X-platform models shorten installation to eight weeks, accelerating client onboarding.
Sub-100 L systems are forecast to grow at 19.42% as CAR-T makers and universities deploy benchtop tools. Conversely, designs above 2,000 L face engineering limits; experimental 4,000 L bags remain scarce and expensive, capping growth despite demand for large-scale biosimilars.
By Application: Commercial Manufacturing Anchors, Clinical Scale Accelerates
Commercial-scale manufacturing captured 63.33% of 2025 usage, fueled by marketed monoclonal antibodies. The single-use bioreactor market size for clinical production, however, is rising quickly as sponsors race through Phase I/II studies using disposable lines that eliminate cleaning downtime. Research and process-development labs now migrate from shake flasks to 5-50 L reactors with cloud-linked analytics, compressing tech-transfer timelines.
Clinical programs in cell and gene therapy drive flexible footprints. Univercells’ containerized 50 L units deliver GMP capacity to remote sites, echoing a broader pivot toward decentralized trials. Commercial antibody makers still lean on hybrid fleets because consumable costs climb when annual production rises above 300 kg.
By End-User: Pharma Giants Lead, CDMOs Surge
Pharma and biopharma firms held 69.21% of demand in 2025, leveraging global networks exceeding 100,000 L of single-use capacity. CDMOs, expanding at 17.53%, win contracts as sponsors outsource to conserve cash. Bristol Myers Squibb’s USD 380 million pact with Cellares typifies long-term capacity reservations that anchor the single-use bioreactor market. Academic institutes remain small yet influential early adopters of 5-10 L systems that support translational research.
Large pharma negotiates volume discounts and co-develops sensors, deepening supplier lock-in. CDMOs face heavier cross-contamination oversight because they run multiproduct facilities, but ISO 13408 and FDA guidelines provide a maturing framework.
Geography Analysis
North America accounted for 36.11% of 2025 revenue, buoyed by U.S. headquarters and an FDA program that expedites advanced manufacturing reviews. Growth is plateauing as capacity saturates, prompting suppliers to pivot to Asia-Pacific, projected to grow at 17.02% through 2031. Thermo Fisher’s 2025 design centers in Singapore and Shanghai reflect this tilt.
Europe ranks second, led by Germany, Switzerland, and the UK, where water-usage rules encourage disposable systems. Merck KGaA’s EUR 300 million Darmstadt hub and Sartorius’ consumable-centric model illustrate the focus on high-margin supplies. Post-Brexit dual approvals add modest complexity, yet mutual recognition eases trade.
Asia-Pacific governments pursue sovereign production. South Korea’s Samsung Biologics signed USD 3.3 billion in contracts in 2024, and China’s Suzhou cluster scales single-use suites for domestic biosimilars. India’s Serum Institute uses disposable lines to meet WHO prequalification for African supply.
Middle East & Africa and South America nurture containerized facilities. WHO hubs in South Africa and Argentina rely on modular reactors, and Brazil’s Farmanguinhos uses single-use equipment to localize vaccine output. The United Arab Emirates’ biotech free-zones mirror these moves, signaling continued diffusion.

Regulatory Landscape
Global adoption of single-use bioreactors is shaped by GMP expectations for contamination control and documentation of product-contact materials, with alignment across major agencies such as the FDA and EMA. In the United States, FDA programs that support advanced manufacturing, including the Advanced Manufacturing Technologies Designation Program, reinforce modernized platforms where sponsors can support submissions with comparability and process-control packages.
Materials and leachables and extractables (E&L) compliance is tightening for disposable flow paths and bioreactor bags. A key inflection point is the USP General Chapter 665, which became official on May 1, 2026, establishing standardized protocols for plastic components and systems used in biomanufacturing; it is commonly paired with the informational chapter 1665 for risk-based application. In parallel, EU GMP Annex 1 keeps contamination control strategies central to aseptic operations, which is pushing sponsors and CDMOs to integrate single-use validation, supplier change-control, and E&L evidence directly into regulatory submissions.
Value Chain Analysis
The value chain runs from upstream materials and subassemblies to bioreactor hardware and services. Key inputs include multilayer polymer films for bioreactor bags, platinum-cured silicone tubing, connectors and welded port assemblies, and embedded single-use sensors, which are then converted into gamma-irradiated, pre-sterilized assemblies. After validation, these units are typically bundled with controllers and automation. The vendor ecosystem is closely linked to qualification documentation, including E&L packages, which makes approved consumable supply continuity a gating factor for end users once a process is validated.
Distribution routes generally connect original equipment manufacturers and qualified integrators to biopharma manufacturers and CDMOs/CMOs, with service layers spanning validation support, spare parts, and operator training. Bottlenecks tend to concentrate around single-source components, such as specific port configurations and biosensor elements, and around change-control cycles that can slow substitutions. Recent capacity build-outs at CDMOs highlight downstream pull for pre-qualified single-use trains, including June 2026 commissioning activity at new GMP facilities in China (Chime Biologics) and India (Aragen Life Sciences), as well as equipment network decisions such as AGC Biologics selecting 5,000 L Thermo Scientific DynaDrive single-use bioreactors for Yokohama (announced April 2025).
Competitive Landscape
The single-use bioreactor market is moderately to highly concentrated. Danaher’s Xcellerex expansion in 2025 delivers pre-validated 500 L and 2,000 L units that cut qualification from a year to two months. Thermo Fisher’s acquisition of Solventum filtration and the 5 L DynaDrive launch combine geographic and product diversification. Sartorius’ 75% consumables revenue underscores sticky customer relationships.
Niche innovators attack white-space. PBS Biotech’s vertical-wheel design reduces shear and energy use, useful in perfusion research. Univercells’ NevoLine enables shipping-container factories adopted in WHO hubs, meeting emerging-market self-sufficiency goals. Cellares weaves robotics and AI into closed CAR-T workflows, securing major pharma contracts.
Regulatory incentives matter: FDA’s Advanced Manufacturing Technologies pathway offers speed for perfusion and continuous models, potentially accelerating uptake of disruptive configurations.
Single-use Bioreactor Industry Leaders
Sartorius AG
Thermo Fisher Scientific, Inc.
Danaher (Cytiva & Pall)
Merck KGaA
Eppendorf SE
- *Disclaimer: Major Players sorted in no particular order

Market Opportunities and Future Outlook
Standardized E&L qualification and contamination-control documentation is increasingly treated as a product requirement for single-use systems, creating opportunity for suppliers that package bioreactor bags, sensors, and automation with ready-to-submit validation content. The formalization of USP 665 in May 2026 raises demand for harmonized materials datasets and risk-based E&L strategies, particularly for multiproduct CDMOs that need repeatable change-control across clients and sites.
Beyond early clinical use, commercial-scale deployments are broadening the addressable whitespace for 2,000 L to 5,000 L single-use lines and the associated consumables, especially where CDMOs are adding modular suites. WuXi Biologics provides a concrete example, completing a commercial PPQ campaign using three 5,000 L single-use bioreactors at its Hangzhou site (April 2025) and completing first GMP production at its MFG17 drug substance facility with 9,000 L single-use capacity (June 2026). CDMO investments also point to continued regional capacity building, such as AGC Biologics announcing a USD 350 million new Yokohama site featuring two 5,000 L and four 2,000 L single-use mammalian cell culture bioreactors (April 2026), and Bora Biologics reporting expansion of US single-use drug substance capacity across FDA-registered facilities (July 2026).
Recent Industry Developments
- July 2026: Bora Biologics expanded its US single-use drug substance capacity to 20,000 L across two FDA-registered facilities in Rockville, Maryland and San Diego, California. The expansion broadens domestic capacity options for sponsors that want flexible, modular manufacturing footprints using disposable trains.
- November 2025: Sartorius Stedim Biotech and ABER Instruments introduced the BioPAT Viamass single-use biomass sensor for integration with Ambr 250 high-throughput bioreactors. Adding single-use biomass monitoring supports data density in scale-down and process development workflows that feed into validated single-use scale-up.
- September 2024: Merck KGaA launched the Mobius ADC Reactor, a single-use reactor designed to support antibody-drug conjugate manufacturing using its film technology. The launch reflects continued product specialization within single-use bioreactors for high-value modalities that require tighter control of materials and contamination risk.


Research Methodology Framework and Report Scope
Market Definition and Coverage
This market covers revenues generated from single-use bioreactor systems used for cell culture or fermentation in biopharma research, clinical manufacturing, and commercial production, including the disposable vessel and the dedicated control hardware needed to run the system.
Scope exclusions: We do not count conventional glass or stainless-steel multi-use reactors, and we also exclude general single-use fluid-handling bags that are not configured as bioreactor vessels.
Segmentation Overview
- By Product Type
- Stirred-Tank SUBs
- Wave-Induced SUBs
- Fixed-Bed SUBs
- Orbitally-Shaken & Other SUBs
- By Volume Range
- Less than 100 L
- 100 – 500 L
- 500 – 2 000 L
- More than 2,000 L
- By Application
- Research & Process Development
- Clinical-Scale Production
- Commercial-Scale Biopharmaceutical Manufacturing
- By End-User
- Pharmaceutical & Biopharmaceutical Companies
- Contract Development & Manufacturing Organisations (CDMOs/CMOs)
- Academic & Research Institutes
- By Geography
- North America
- United States
- Canada
- Mexico
- Europe
- Germany
- France
- United Kingdom
- Italy
- Spain
- Rest of Europe
- Asia-Pacific
- China
- Japan
- India
- South Korea
- Australia
- Rest of Asia-Pacific
- Middle East & Africa
- GCC
- South Africa
- Rest of Middle East & Africa
- South America
- Brazil
- Argentina
- Rest of South America
- North America
Data Sources, Market Sizing, and Validation
Desk Research
Desk research started with public references that help set the demand context and reality-check the installed manufacturing base. Sources used included US FDA databases and guidance pages for biologics and manufacturing changes, NIH and PubMed articles on upstream bioprocess trends, USITC and UN Comtrade trade statistics for relevant bioprocess equipment categories, and OECD or World Bank macro indicators that help normalize spending capacity by region.
We then combined those signals with company filings, investor presentations, and reputable press coverage to understand capacity expansions, outsourcing patterns, and typical buying cycles for upstream equipment. Where it improved consistency across countries, we also used paid subscriptions for company financials and intelligence and patent databases to track technology direction and commercialization focus. These examples are not exhaustive, and many other public sources were reviewed to collect, validate, and clarify data points.
Primary Interviews and Surveys
Primary work was used to test the sizing assumptions with people who sell, specify, or operate single-use bioreactor systems, including equipment suppliers, contract manufacturers, and bioprocess engineering teams in biologics and vaccine facilities. We also checked regional adoption differences across the Americas, EMEA, and APAC so the model does not over-apply one region's purchasing pattern to another.
Distribution of primary research fieldwork respondents
| Company type | Respondent position | Region |
|---|---|---|
| Top tier: 28% | CXOs: 17% | APAC: 51% |
| Mid tier: 53% | Functional/Unit leaders: 28% | EMEA: 31% |
| Smaller Players: 19% | Managers: 55% | Americas: 18% |
Market-Sizing & Forecasting
The core sizing logic uses a top-down build that reconstructs the demand pool from biopharma manufacturing activity and the rate at which single-use reactors are adopted across development and production lines, and then value is derived using typical system pricing by working volume. To keep the totals realistic, we corroborated outputs with selective bottom-up approximations, including supplier and channel checks, sampled average selling price progression, and sanity checks against plausible unit shipments by scale.
Inputs that mattered most included the number of new or expanded biologics lines, the typical bioreactor working-volume mix (process development versus commercial), single-use penetration by facility type, replacement and consumables attachment behavior tied to run rates, and regional differences in outsourcing intensity. When gaps showed up in smaller geographies, we used proxy indicators (like biologics pipeline intensity and manufacturing investment news) and then adjusted the implied volumes after validation calls.
For forecasting, scenario analysis was applied around capacity additions and adoption speed, and then the year-by-year curve was smoothed using expert-confirmed assumptions on price changes and mix shift toward larger working volumes. This helped the forecast stay traceable to real build plans and operating behavior, instead of only extending a historic growth rate.
Data Validation & Update Cycle
Estimates are cross-checked using more than one angle, so the final number is not driven by a single assumption. We compare the model output against independent signals such as biologics manufacturing expansion announcements, procurement lead-time commentary, and the implied units-per-facility that operators consider realistic.
If a region or scale band shows a sharp jump that cannot be explained by capacity or adoption, the drivers are reworked and the team re-contacts sources to confirm the logic. Before sign-off, the model and key assumptions go through multi-step analyst review, including variance checks across regions and time series. Reports are refreshed annually, and interim updates are made when material events change demand or pricing, followed by a final pre-delivery pass to ensure the latest inputs are reflected.
Mordor Intelligence's Single Use Bioreactor Market Estimate Compared With Other Published Estimates
Published market sizes can look far apart even when everyone is discussing single-use bioreactors, because the counted products and the timing of the base year are not always aligned. Differences in what is treated as a bioreactor system versus adjacent single-use assemblies, plus how pricing is carried forward, usually explains most of the spread.
Some published figures roll in broader single-use upstream assemblies like media bags and filtration-related items as part of the same market value. In this Mordor Intelligence estimate, the sizing is limited to disposable, pre-sterilized bioreactor vessels (up to 6,000 L) and the dedicated control hardware used to run cell-culture or fermentation processes, and it excludes general fluid-handling bags and traditional multi-use reactors.
Benchmark comparison
| Source | Market Size | Gaps in Research Methodology |
|---|---|---|
| Mordor Intelligence | USD 6.28 B (2026) | |
| Global Consultancy A | USD 4.58 B (2024) | Uses a 2024 base year and a broader segmentation lens that can shift the counted mix by application and end use, and the earlier year reduces the carried-forward pricing and volume effects seen in later-year baselines. |
| Industry Publisher B | USD 4.81 B (2025) | Includes product buckets beyond core bioreactor systems, such as media bags and filtration assemblies, which lifts the scope compared with a system-focused count and can change the implied average selling price path. |
The comparison shows that year alignment and scope discipline are the two biggest drivers of different market values. When the definition is kept to the reactor vessel plus its control hardware, and the year is clearly stated, the total becomes easier to reconcile with capacity activity, adoption rates, and realistic unit economics.


Key Questions Answered in the Report
What is the projected value of the c in 2031?
It is forecast to reach USD 13.07 billion by 2031.
Which volume range currently leads sales?
Vessels sized 500-2,000 L captured 43.72% of 2025 revenue.
Why are CDMOs investing heavily in disposable equipment?
Multi-year capacity-reservation deals lock in recurring consumable revenue while sparing sponsors from large capex.
What regulatory program supports advanced manufacturing adoption in the United States?
FDA’s Advanced Manufacturing Technologies Designation Program expedites reviews for qualified innovations.
Which region will grow fastest through 2031?
Asia-Pacific is projected to expand at a 17.02% CAGR on the back of national biomanufacturing mandates.
What main factor restrains commercial-scale uptake?
High recurring consumable costs push sponsors toward stainless-steel once annual batches exceed 200-300.
Page last updated on:


