
Market Overview
| Study Period | 2021 - 2031 |
|---|---|
| Forecast Data Period | 2026 - 2031 |
| Base Year Market Size (2025) | 1.68 gigawatt |
| Market Volume (2026) | 1.93 gigawatt |
| Market Volume (2031) | 3.86 gigawatt |
| Growth Rate (2026 - 2031) | 14.86 % |
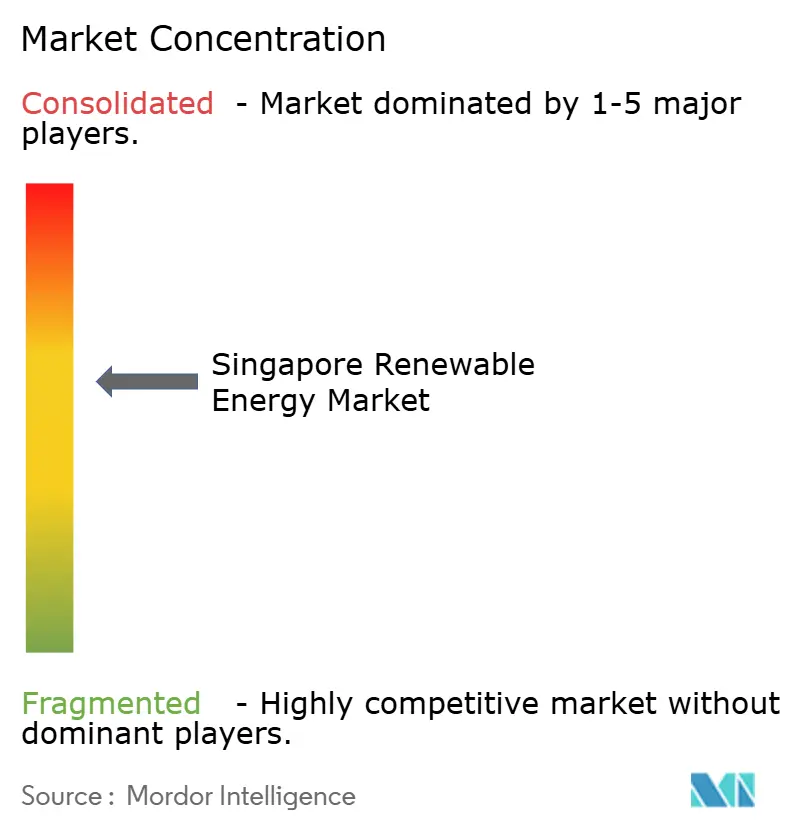
| Market Concentration | Medium |
Major Players *Disclaimer: Major Players sorted in no particular order Image © Mordor Intelligence. Reuse requires attribution under CC BY 4.0. | |
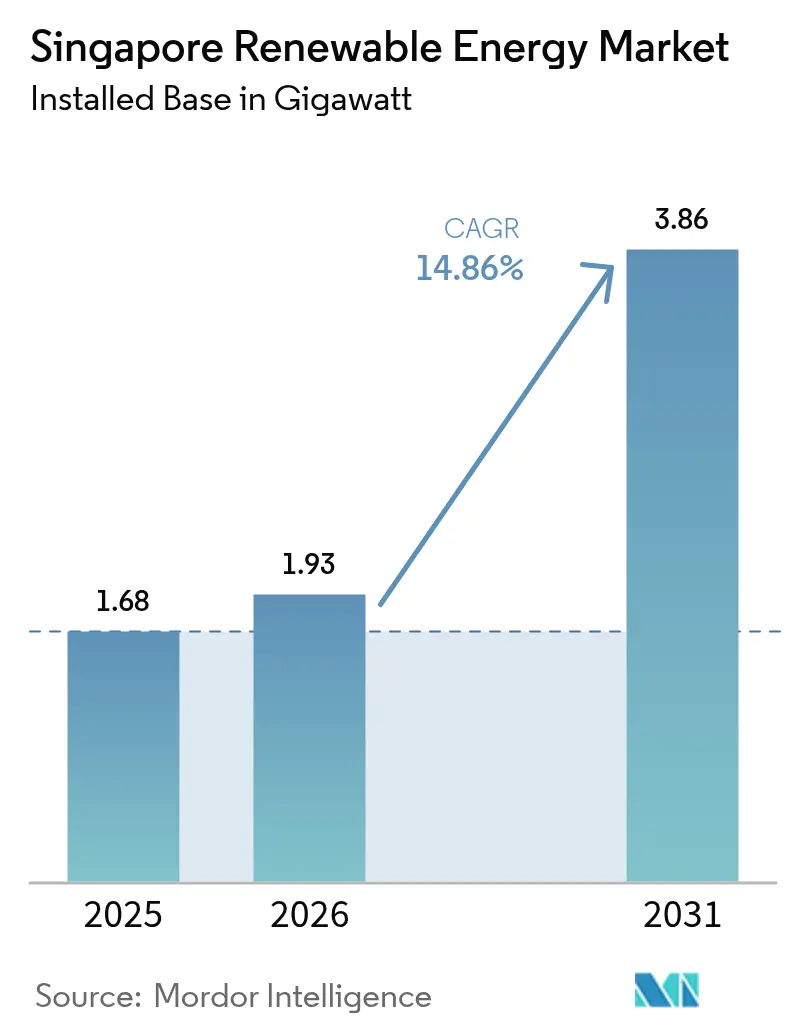
Singapore Renewable Energy Market Analysis by Mordor Intelligence
Singapore Renewable Energy Market size in 2026 is estimated at 1.93 gigawatt, growing from 2025 value of 1.68 gigawatt with 2031 projections showing 3.86 gigawatt, growing at 14.86% CAGR over 2026-2031.
Rising corporate demand for clean electricity, stringent net-zero rules, and region-wide power import plans are accelerating investment. Solar keeps its dominant role because rooftop, floating, and near-shore deployments are the most space-efficient options in a city-state with only 728 sq km of land. The roll-out of Southeast Asia’s largest 285 MWh battery system, together with a solar forecasting model funded by SGD 6.2 million in R&D grants, shows how grid operators are tackling intermittency. Regional import targets of 6 GW by 2035 add supply diversity while anchoring Singapore’s position as a cross-border clean-power hub. Intensifying sustainability mandates in the fast-growing data-center cluster further lifts long-term electricity offtake certainty for project developers.
Key Report Takeaways
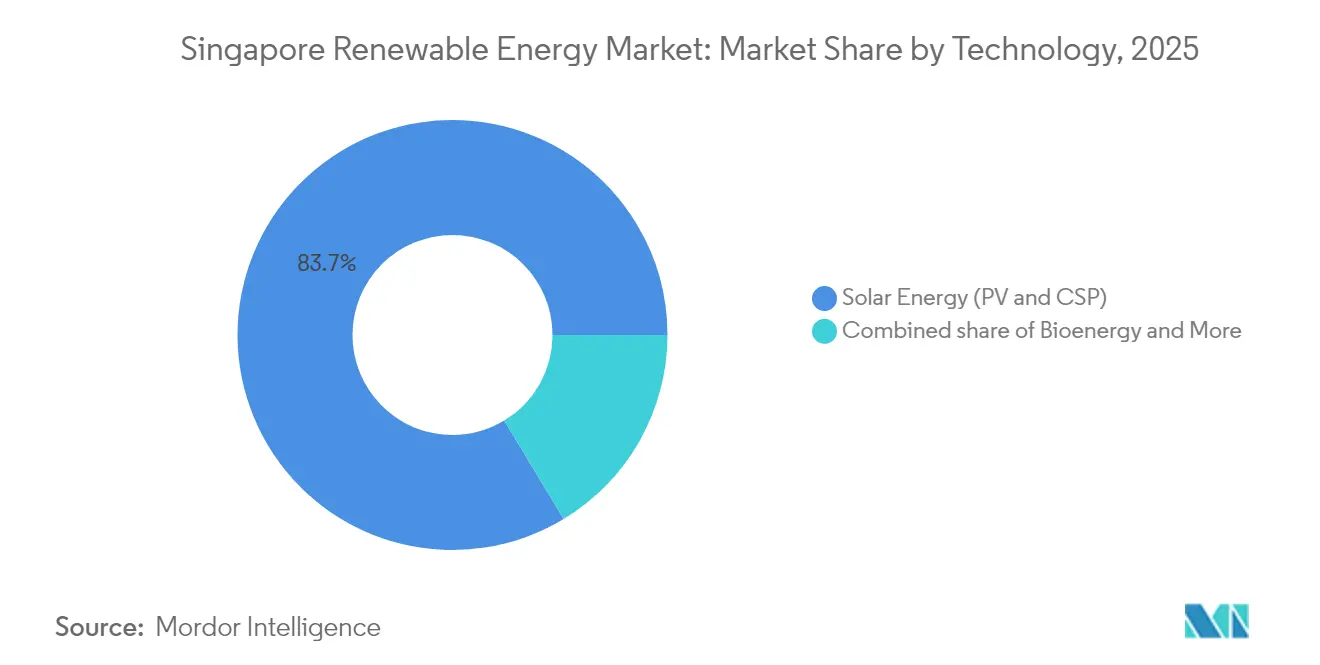
- By technology, solar captured 83.65% of the Singapore renewable energy market share in 2025, while registering the fastest forecast CAGR at 15.38% through 2031.
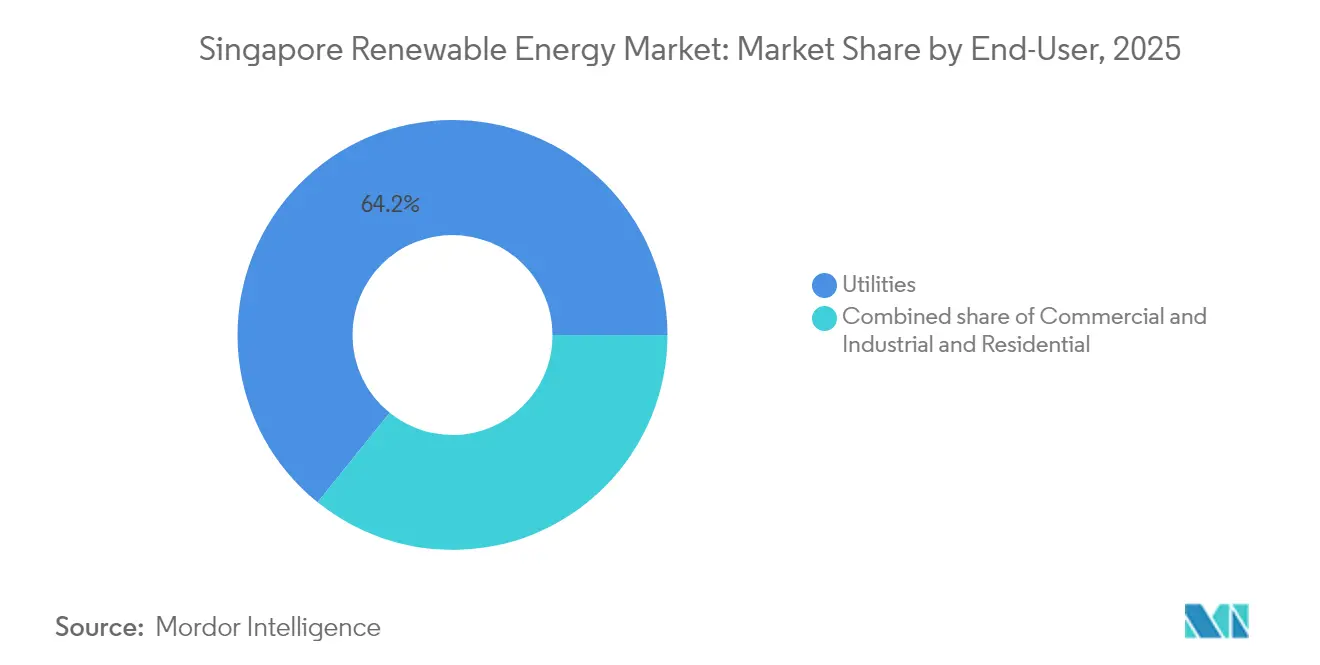
- By end-user, utilities held 64.20% of the Singapore renewable energy market size in 2025; C&I demand is expanding at a 16.65% CAGR to 2031.
Note: Market size and forecast figures in this report are generated using Mordor Intelligence’s proprietary estimation framework, updated with the latest available data and insights as of 2026.
Singapore Renewable Energy Market Trends and Insights
Drivers Impact Analysis*
| Driver | (~) % Impact on CAGR Forecast | Geographic Relevance | Impact Timeline |
|---|---|---|---|
| Net-zero 2050 & Green Plan 2030 targets intensifying renewable build-out | +4.20% | National, with concentration in central and western reservoir zones | Long term (≥ 4 years) |
| Declining solar-PV CAPEX amid high rooftop irradiance | +3.80% | National, particularly industrial estates and public housing clusters | Medium term (2-4 years) |
| Corporate sustainability pledges pushing onsite solar PPAs | +3.10% | National, with early adoption in central business district and Jurong industrial zone | Short term (≤ 2 years) |
| Rapid roll-out of floating PV on inland reservoirs | +2.60% | Tengeh, Bedok, Pandan, Lower Seletar reservoir catchments | Medium term (2-4 years) |
| Agrivoltaic pilots unlocking dual-use of scarce land | +0.50% | Limited to Kranji and Lim Chu Kang agricultural zones | Long term (≥ 4 years) |
| Surge in REC demand from hyperscale data-centre boom | +2.90% | National, concentrated in data-center clusters | Short term (≤ 2 years) |
| Source: Mordor Intelligence | |||
Net-zero 2050 & Green Plan 2030 targets intensifying renewable build-out
Singapore’s legally binding net-zero target for 2050 and its updated goal of 45-50 million tCO₂e by 2035 create an unambiguous demand signal. A USD 1 billion hydrogen-ready power plant with carbon-capture features reached final investment decision right after the February 2025 policy update.[1]Carbon Herald, “Singapore Bets USD 1B on Hydrogen-Ready Plant,” carbonherald.com New generation units must now be at least 30% hydrogen-ready, forcing technology upgrades that favor renewable hybrids. The Energy Market Authority (EMA) has embedded emissions-based bidding criteria into its electricity market, tightening the cost of carbon-intensive output. Clear accountability mechanisms from the National Climate Change Secretariat have moved renewables from an optional efficiency gain to a compliance necessity. Long lead-time assets, such as floating solar or utility-scale storage, therefore secure faster permitting and cheaper green financing in the Singapore renewable energy market.
Declining solar-PV CAPEX amid high rooftop irradiance
Capital costs for Tier-1 modules fell another 7% between 2024 and 2025, intersecting with Singapore’s steady 1,700 kWh/m² annual irradiance to sharpen project economics.[2]Energy Market Authority, “Singapore Energy Statistics 2025,” ema.gov.sg The government refrains from feed-in tariffs; instead, simplified credit schemes let owners sell excess power without bureaucratic delay. Private sector players delivered 63.5% of new capacity in 2024, proving that pure cost competitiveness now drives uptake. Solar forecasting linked to advanced weather analytics has trimmed balancing charges, lifting internal rates of return. With rooftop leases structured around 15- to 20-year payback horizons, commercial landlords increasingly treat photovoltaics as a core infrastructure upgrade rather than an ESG add-on in the Singapore renewable energy market.
Corporate sustainability pledges pushing onsite solar PPAs
Hyperscale data-center operators, multinationals, and local conglomerates have moved beyond certificates toward physical PPAs. STT GDC sourced 52% of its 2024 electricity from renewables and secured SGD 2.5 billion in green financing facilities. Sembcorp’s 18-year deal to supply 75 MW of solar generation to Equinix illustrates appetite for tenor-matched contracts that hedge utility bills and reputational risk. Backup-generator fleets are shifting to renewable diesel blends, lowering Scope 1 emissions without altering mission-critical uptime. Corporates are keen on visible rooftop arrays because they double as brand statements in the dense Singapore skyline. The PPA boom adds predictable offtake that underpins debt service for new capacity, reinforcing the growth trajectory of the Singapore renewable energy market.
Rapid roll-out of floating PV on inland reservoirs
The 60 MWp Tengeh Reservoir array occupies 45 ha yet powers five water-treatment plants, showcasing dual-use land optimisation. Evaporative cooling lifts panel efficiency by around 11%, offsetting tropical temperature losses.[3]ABB, “Cooling Effect Boosts Floating PV Yield,” new.abb.com Public Utilities Board (PUB) plans further arrays across Kranji and Pandan reservoirs to help meet the 2 GWp solar target by 2030. EDP Renewables’ 5 MWp system in the Straits of Johor indicates viable near-shore extensions. Singapore’s memorandum with Indonesia for a 2 GW floating-solar-plus-battery complex in Batam will funnel surplus output back through subsea cables, demonstrating regional scalability for the Singapore renewable energy market.
Restraints Impact Analysis*
| Restraint | (~) % Impact on CAGR Forecast | Geographic Relevance | Impact Timeline |
|---|---|---|---|
| Severe land scarcity for utility-scale assets | -2.80% | National, acute in eastern and northern land-use zones | Long term (≥ 4 years) |
| Intermittency & grid-stability challenges in a dense network | -1.90% | National, concentrated stress in central grid nodes | Medium term (2-4 years) |
| Competition from low-carbon power imports under LTMS-P | -1.60% | National, with import terminals in western Tuas and Jurong zones | Medium term (2-4 years) |
| Limited biomass feedstock after waste-to-energy prioritisation | -0.40% | National, constrained by incineration plant capacity | Long term (≥ 4 years) |
| Source: Mordor Intelligence | |||
Severe land scarcity for utility-scale assets
Only 23% of Singapore’s surface is zoned for industrial or infrastructure use, constraining ground-mount projects. Developers request longer land-lease tenures to match 25-year asset lives, but state agencies often grant parcels for 15 years or less. The UNFCCC label of “alternative-energy-disadvantaged” underscores structural limits. Innovations such as vertical bifacial arrays on building façades and car-park canopy systems squeeze power into overlooked surfaces, yet aggregate contribution remains modest. Therefore, policy pivots to regional imports and floating solar maintains growth momentum in the Singapore renewable energy market.
Intermittency & grid-stability challenges in a dense network
Solar ramps of ±100 MW within minutes stress a tightly meshed 230 kV grid serving 5.9 million residents. EMA’s forecasting tool, co-developed with the National University of Singapore, narrows the mean-absolute-error to 6%, aiding dispatch planning. A 285 MWh lithium-iron-phosphate system offers two-hour buffering, but system studies suggest at least 1 GWh will be required by 2030 as variable renewables climb. Smart-grid pilots in Punggol District employ real-time load curtailment across IoT-connected buildings to smooth peaks. Scaling these solutions remains capital-intensive and may temper growth in the Singapore renewable energy market.
*Our forecasts treat driver/restraint impacts as directional, not additive. The impact forecasts reflect baseline growth, mix effects, and variable interactions.
Segment Analysis
By Technology: Solar Dominance Amid Niche Alternatives
Solar supplied 83.65% of 2025 capacity and is tracking a 15.38% CAGR to 2031, cementing its role as the backbone of the Singapore renewable energy market. Floating arrays on Tengeh, Bedok, and Pandan reservoirs alone unlock more than 200 MW that would otherwise require 150-200 ha of scarce land. Roof-mounted systems dominate industrial estates, leveraging 1,580 kWh/m² irradiance and bifacial modules to deliver sub-grid pricing to factories and data centers. Wind remains marginal given 2-3 m/s average speeds and crowded coastal waters, while domestic hydropower is nonexistent due to flat topography. Waste-to-energy plants add 150 MW of bioenergy, capturing 3 M t of municipal waste and reducing landfill reliance. Geothermal and ocean energy sit in the research phase, hindered by low thermal gradients and minimal tidal ranges.
The Singapore renewable energy market share outside solar is therefore shaped by necessity rather than optional diversification. Hydropower imports from Laos supply 100 MW under a 25-year PPA; future links could arrive from Cambodia and Vietnam via the Low-Carbon Energy Imports Scheme. Building-integrated photovoltaics are gaining traction in marquee developments such as Marina Bay Sands, where façade-mounted systems meet Green Mark mandates. Collectively, non-solar technologies will retain a sub-20% share of installed capacity through 2031.



By End-User: Utilities Lead, C&I Accelerates
Utilities owned 64.20% of installed capacity in 2025, anchored by Sembcorp's 250+ MW solar-plus-waste-to-energy fleet and Keppel's reservoir projects. These incumbents sign 20-25-year utility-scale PPAs with SP Group or sell directly into the National Electricity Market, securing the bulk of Singapore's renewable energy market for at least the next five years. However, the 16.65% CAGR expected in the C&I space indicates structural change. Data-center operators must procure RECs for 100% of consumption by 2030, catalyzing rooftop PPAs across Jurong and Tuas. Pharmaceutical, semiconductor, and logistics tenants now view solar as a hedge against rising carbon taxes, which step up from SGD 45/tCO₂e in 2026-27 to SGD 50-80 by 2030.
Residential uptake is slower because split incentives dilute payback, although SolarNova aggregates demand for 1,075 public-housing blocks under Phase 8. REIT-led portfolios are flipping this equation by embedding solar into lease contracts, giving landlords a new revenue stream and tenants immediate savings. As licensing timelines have fallen to roughly three months for sub-1 MWp rooftop systems, smaller C&I buyers can now enter the Singapore renewable energy market with limited administrative friction.
Geography Analysis
Singapore’s compact 728 sq km footprint forces a dual-track strategy of maximising every domestic surface while importing renewable electrons. Floating arrays on reservoirs, vertical façades, and car-park canopies are mapped through a national geospatial solar calculator maintained by EMA. The tool prioritises installations near substations to cut cabling costs, boosting overall project economics within the Singapore renewable energy market.
High solar irradiance throughout the equatorial belt, stable diurnal profiles, and minimal seasonal swings simplify generation forecasting. Coupled with aggressive energy-efficiency codes for buildings, this climate advantage lets peak-hour solar offset midday air-conditioning demand. Dense data-centre clusters in Tai Seng and Jurong see tailored PPA packages that blend rooftop supply with imported power to meet stringent uptime rules. These localised demand nodal points shape grid-reinforcement budgets and guide storage placement.
Regionally, the island functions as a clean-energy node under ASEAN’s LTMS-P framework. Indonesia will deliver 2 GW of solar-plus-battery power via subsea cables by 2030, Cambodia 1 GW of hydro-backed solar, and Vietnam 1.2 GW from offshore wind-solar hybrids. Imports equal roughly 30% of the projected 2035 load, mitigating domestic land scarcity. Interconnector capacity upgrades at the Senoko and Jurong terminals are scheduled to dovetail with new synchronous condensers, preserving stability as the Singapore renewable energy market integrates variable regional supply.
Regulatory Landscape
Singapore’s renewable energy regulation is anchored by the Energy Market Authority (EMA) under the Electricity Act and the Energy Market Authority of Singapore Act. Market rules govern generation licensing, grid connection, and participation in the National Electricity Market of Singapore. A key 2024 milestone was the Energy Transition Measures and Other Amendments Act 2024, which expanded oversight to cover renewable energy and low-carbon fuels and established the Future Energy Fund. It also reinforces the policy direction aligned with net-zero by 2050 and interim emissions goals.
On market access and permitting, licensing thresholds differentiate smaller embedded generation from utility-scale assets. Wholesaler (generation) licensing applies from 1 MWac to under 10 MWac, while a full generation licence applies from 10 MWac and above. For distributed solar, Urban Redevelopment Authority guidance effective 1 July 2026 exempts Building Integrated Photovoltaics (BIPV) and Building Applied Photovoltaics (BAPV) from planning permission requirements, supporting higher-density deployment in a land-constrained city-state. On supply diversification, EMA formalized submission requirements for electricity import proposals as part of the Low-Carbon Electricity Imports Scheme, and it continues to work toward the national import target of 6 GW by 2035. This approach shapes project bankability through a conditional approval and licensing pathway and related compliance requirements.
Competitive Landscape
Competition is moderate, with the top five players holding around 55% of installed capacity. Sembcorp posted SGD 183 million in renewable earnings during 2024 after diversifying into regional solar farms and urban micro-grids.[4]Asian Power, “Sembcorp FY24 Results,” asian-power.com Keppel Infrastructure Trust broadened its base through a 45% stake in European solar assets while advancing a local hydrogen-ready plant, signalling an integrated generation-to-trading model. EDP Renewables commands more than 30% of installed solar, leveraging floating expertise for moat creation in the Singapore renewable energy market.
Strategic alliances shape market entry. Keppel teamed with Huawei on solar-plus-battery projects targeting ASEAN grids, marrying digital optimisation with asset ownership. Vena Energy secured conditional approval to export 400 MW from Riau Islands, banking on cross-border competency. Sembcorp and TotalEnergies are exploring green-hydrogen logistics, aiming to blend molecules into Jurong Island’s petrochemical cluster.
Innovation remains a key differentiator. VFlowTech closed USD 20.5 million to expand flow-battery output, promising 12-hour storage useful for capturing off-peak import surpluses. Shell’s divestment of its Energy and Chemicals Park introduces room for new renewable retrofits. SP Group’s takeover of Thai solar portfolios signals outbound ambitions. As more regional players eye Singapore, technology, financing, agility, and proven execution will decide share gains in the Singapore renewable energy market.
Singapore Renewable Energy Industry Leaders
EDPR Sunseap
Sembcorp Industries
Keppel Renewable Energy
Vena Energy
ENGIE Southeast Asia
- *Disclaimer: Major Players sorted in no particular order

Market Opportunities and Future Outlook
The clearest capacity-addition opportunity is still concentrated in space-efficient solar formats and grid-enabling assets. Budget 2026 raised Singapore’s solar deployment target to 3 GWp by 2030, creating more headroom for rooftop, reservoir-based floating PV, and building-integrated solar. This is supported by the 1 July 2026 exemption from planning permission for BIPV and BAPV installations. On the system side, intermittency management is already a procurement theme, reinforced by utility-scale battery deployments (including the 285 MWh system highlighted in the market context) and ongoing efforts to improve solar forecasting accuracy. Together, these measures widen the bankable operating envelope as solar penetration rises.
Cross-border low-carbon electricity imports are the second major opportunity lane, with government-to-government and regulator-led processes feeding a larger pipeline of projects. EMA has issued conditional approvals for 11 import projects totaling 8.35 GW, while the national target remains approximately 6 GW of imports by 2035. That positions interconnector developers, import aggregators, and firming solutions (BESS and dispatchable low-carbon capacity) as direct beneficiaries. The July 2026 bilateral agreements between Singapore and Indonesia on low-carbon electricity export cooperation provide fresh institutional backing for Indonesia-linked supply chains. Commercialization work, including pricing and technical readiness, will still determine which conditional projects move into licensed imports and contracted offtake in Singapore.
Recent Industry Developments
- July 2026: Singapore raised its national solar deployment target to 3 GWp by 2030 and set out measures to accelerate domestic solar rollout. The policy shift enlarges the near-term project pipeline for rooftop, floating, and building-integrated PV while increasing the need for grid flexibility solutions such as storage and improved forecasting.
- December 2025: Vena Energy signed a framework supply agreement with CATL to procure up to 4 GWh of EnerX battery energy storage systems for its Indonesia-Singapore renewable energy export initiative. Securing an equipment pathway for multi-gigawatt-hour storage supports the firming strategy behind cross-border power delivery and improves bankability for intermittent renewable imports.
- November 2024: SP Group acquired solar photovoltaic assets in Thailand with total capacity of 13 MWp. The acquisition broadened SP Group’s regional renewables footprint and added operating assets and experience that can be leveraged alongside Singapore’s domestic decarbonization and low-carbon electricity import agenda.


Research Methodology Framework and Report Scope
Market Definition and Coverage
This market is sized as Singapore renewable energy installed capacity, counted in gigawatts, based on grid connected and operational renewable generation assets within the country during the study period.
Scope exclusions: We exclude fossil based generation, nuclear, and general power trading revenues, and we also do not count capacity that is announced but not yet commissioned.
Segmentation Overview
- By Technology
- Solar Energy (PV and CSP)
- Wind Energy (Onshore and Offshore)
- Hydropower (Small, Large, PSH)
- Bioenergy
- Geothermal
- Ocean Energy (Tidal and Wave)
- By End-User
- Utilities
- Commercial and Industrial
- Residential
Data Sources, Market Sizing, and Validation
Desk Research
Desk research was used to map the policy and project pipeline context before the model was built, since Singapore renewables are heavily shaped by national targets, land constraints, and grid integration rules. We mainly relied on public releases and statistics such as the Energy Market Authority (EMA) datasets and market updates, the Economic Development Board (EDB) publications on energy transition, and Singapore government procurement and tender portals where relevant.
To anchor technology assumptions, sources such as IRENA statistics, IEA renewables and power sector indicators, and peer reviewed journal articles on PV performance and tropical degradation rates were reviewed. We also screened annual reports, investor presentations, and press releases of asset owners and developers to validate commissioning timelines and reported capacity additions. Where needed, we used paid subscriptions for company financials and intelligence, plus patent databases to understand technology direction, and then kept those signals as checks rather than direct inputs to totals. The desk sources listed here are illustrative only, and many additional public documents were consulted for data collection, cross checks, and clarification.
Primary Interviews and Surveys
Primary work focused on interviews and short surveys with developers, EPC and O&M participants, equipment distributors, power market advisors, and large commercial buyers that procure onsite systems. We also spoke with experts who track grid access and permitting so assumptions on realization rates, utilization, and commissioning slippage could be tightened, and then used follow up calls when the desk signals did not align with what was seen on the ground.
Distribution of primary research fieldwork respondents
| Company type | Respondent position |
|---|---|
| Top tier: 27% | CXOs: 13% |
| Mid tier: 58% | Functional/Unit leaders: 31% |
| Smaller Players: 15% | Managers: 56% |
Market-Sizing & Forecasting
The core sizing logic used a top-down build where national renewable capacity additions were reconstructed from commissioned project lists, regulator reporting, and grid connected capacity trackers, and then aligned to technology splits that match Singapore conditions. Once that view was set, we corroborated it with selective bottom-up approximations, mainly sampled project level capacity rollups, channel checks on module and inverter shipment direction, and typical system sizing for commercial rooftops to see if totals stayed realistic.
Key inputs that shaped the model included annual installed capacity additions, commissioning schedules versus planned dates, technology mix (especially solar PV share), average capacity factors in the local climate, and constraints such as land availability and rooftop addressable area. We also tracked policy markers like renewable targets, grid interconnection requirements, and incentive changes because these shift adoption timing more than pure equipment cost trends.
For forecasting, scenario analysis was used so adoption can be flexed under different build out speeds, grid readiness, and pipeline conversion rates, which were then calibrated with expert consensus from primary discussions. When bottom-up signals were missing for smaller rooftop systems, gaps were handled through conservative penetration assumptions tied to building stock and typical system sizes, and then rechecked against overall annual capacity additions.
Data Validation & Update Cycle
Outputs were validated through multiple passes where totals were compared against independent indicators such as known commissioning announcements, regulator statistics trends, and technology specific capacity growth patterns. If a yearly step change looked too sharp, assumptions were revisited and the relevant experts were re-contacted so the reason for the shift could be confirmed.
Before sign-off, variance checks were run across technology totals, year to year additions, and implied utilization so the model remains internally consistent. The report is refreshed annually, and interim updates are made when a material policy change, large project award, or grid rule change can reasonably move the forecast path. Right before delivery, we do a final review pass to ensure the most recent public releases are reflected.
Mordor Intelligence's Singapore Renewable Energy Market Estimate Compared With Other Published Estimates
Published market sizes for Singapore renewables often do not match because the same market label is used for different measurement bases, and then different pricing or inclusion rules get applied. In practice, some sources size renewable energy as revenue in USD, while others treat it as installed capacity, which makes the numbers look far apart even if the underlying activity is similar.
Key gap drivers here are unit choice (capacity in GW versus value in USD), what gets counted as renewable (generation assets only versus also adding storage and services), and timing (commissioned capacity versus planned pipeline). By tracking commissioning status and capacity additions, and then keeping the unit as GW throughout, Mordor Intelligence avoids mixing equipment sales or service revenues into a capacity number, which is a common reason the market total is overstated or understated.
Benchmark comparison
| Source | Market Size | Gaps in Research Methodology |
|---|---|---|
| Mordor Intelligence | USD 1.68 B (2025) | |
| Industry Publisher A | USD 0.31 B (2024) | This estimate is stated as market value in USD, which typically reflects revenue for renewable related sales and services, and it can also bundle energy storage, thereby not aligning with an installed capacity based definition. |
| Industry Publisher B | USD 0.31 B (2024) | The figure is reported as a revenue market size and is anchored to a different base year, so currency assumptions, included categories like storage, and the use of price based scaling can drive a lower, slower growth curve than a capacity build out model. |
The spread mainly comes from mixing value based market sizing with capacity based sizing, plus differences in what adjacent categories are included. When the scope is kept to commissioned renewable generation capacity and checked against project level signals, the resulting market total is easier to reproduce and to update as new capacity comes online.


Key Questions Answered in the Report
How fast is capacity expected to grow by 2031?
Total capacity is forecast to hit 3.86 GW by 2031, growing from 1.93 GW in 2026, equal to a 14.86% CAGR over 2026-2031.
Why does solar dominate Singapore’s clean-power mix?
High rooftop irradiance, floating reservoir projects, and supportive rooftop mandates make solar the most economical and scalable option.
What role will imported electricity play?
EMA targets 6 GW of low-carbon imports by 2035 to complement limited domestic resources and enhance grid reliability.
How are corporate buyers participating?
Multinationals and REITs sign 15-20-year onsite PPAs, securing electricity below grid rates and accruing renewable energy certificates.
Which technologies help manage solar intermittency?
Fast-frequency reserves, machine-learning solar forecasting, and utility-scale battery storage smooth output and maintain grid stability.
Page last updated on:





