Simulator Market Size and Share
Market Overview
| Study Period | 2019 - 2031 |
|---|---|
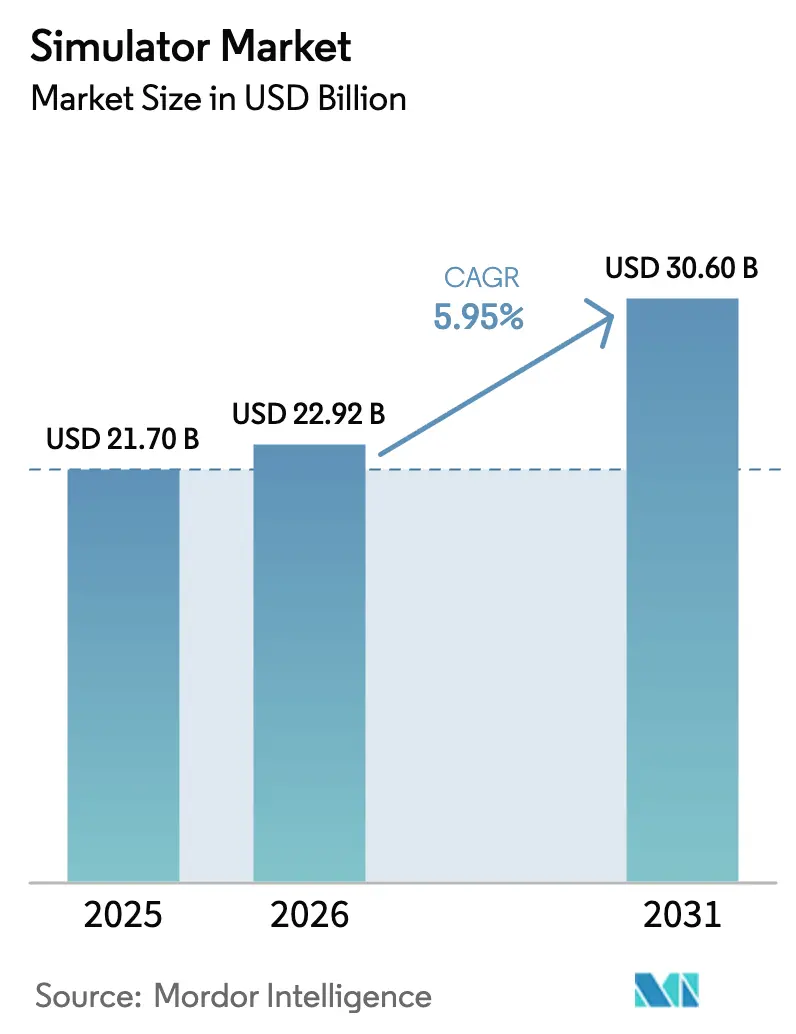
| Market Size (2026) | USD 22.92 Billion |
| Market Size (2031) | USD 30.60 Billion |
| Growth Rate (2026 - 2031) | 5.95% CAGR |
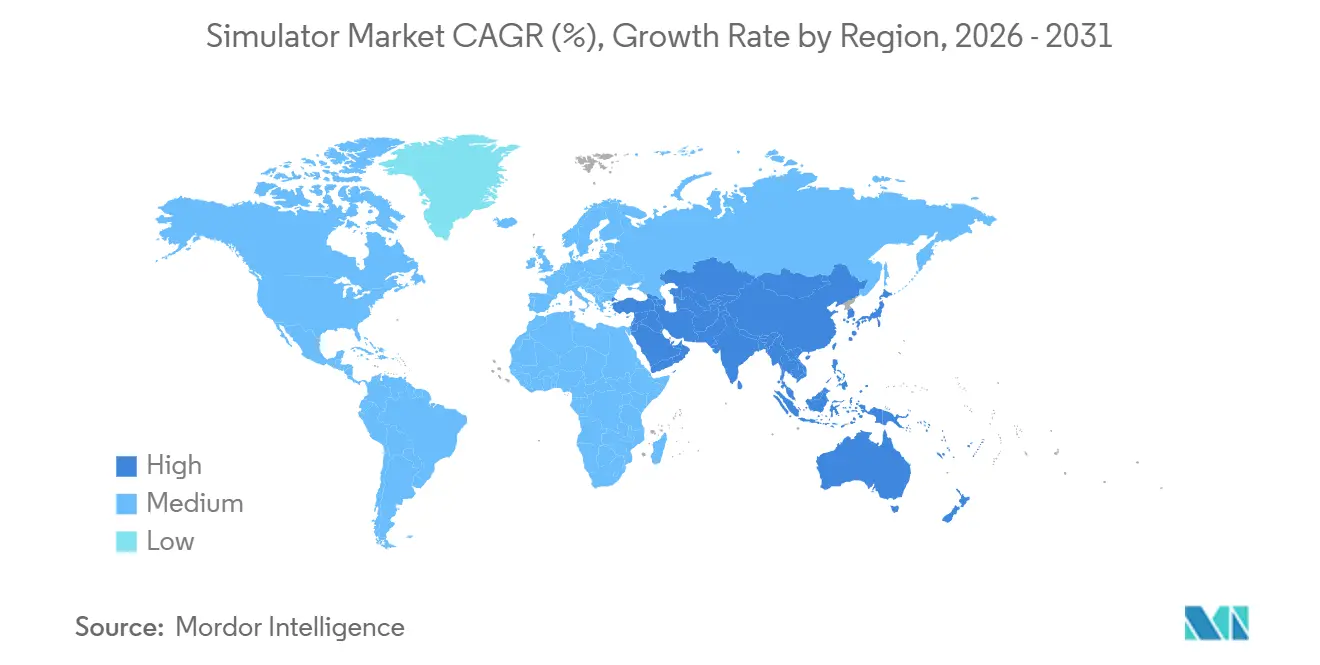
| Fastest Growing Market | Asia Pacific |
| Largest Market | North America |
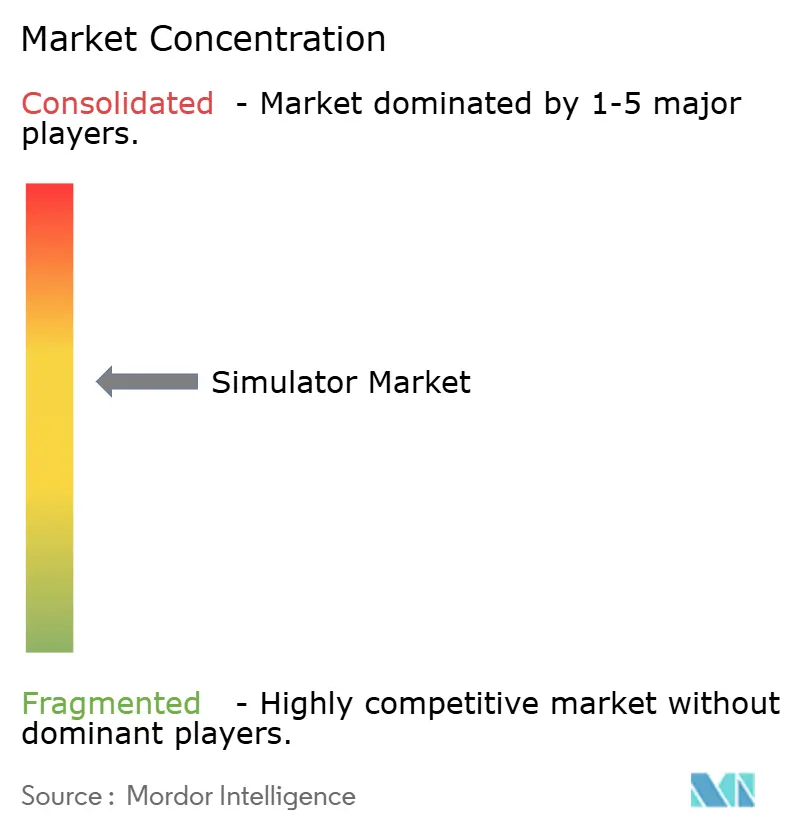
| Market Concentration | Medium |
Major Players *Disclaimer: Major Players sorted in no particular order Image © Mordor Intelligence. Reuse requires attribution under CC BY 4.0. | |
Simulator Market Analysis by Mordor Intelligence
The simulator market size is expected to grow from USD 21.70 billion in 2025 to USD 22.92 billion in 2026 and is forecasted to reach USD 30.60 billion by 2031 at a 5.95% CAGR over 2026-2031. A clear cost logic underpins current growth. Networked synthetic environments now reproduce complex, multi-domain scenarios at a fraction of the fuel, ammunition, and maintenance costs associated with live exercises. Allied defense forces are accelerating the implementation of Live, Virtual, and Constructive (LVC) mandates under NATO STANAG 4603. The US Department of Defense has earmarked USD 147.8 million in FY 2025 for its Combatant Commander Exercise Engagement and Training Transformation account, redirecting funds from physical maneuvers to data-rich simulators. At the same time, the European Union Aviation Safety Agency and the Federal Aviation Administration formalized Evidence-Based Training (EBT) in 2024, requiring airlines to schedule extra Level-D sessions before pilots transition to a new aircraft type. Across the Asia-Pacific region, commercial fleet expansion, as illustrated by Air India’s 500-jet order and Cebu Pacific’s 152-aircraft backlog, keeps airborne simulator bays near full utilization. Suppliers also note a structural pivot from ownership toward pay-per-use models; CAE and FlightSafety International now bundle hardware, instructors, and software in multi-year service contracts that shift capital expenditure off airline balance sheets.
Key Report Takeaways
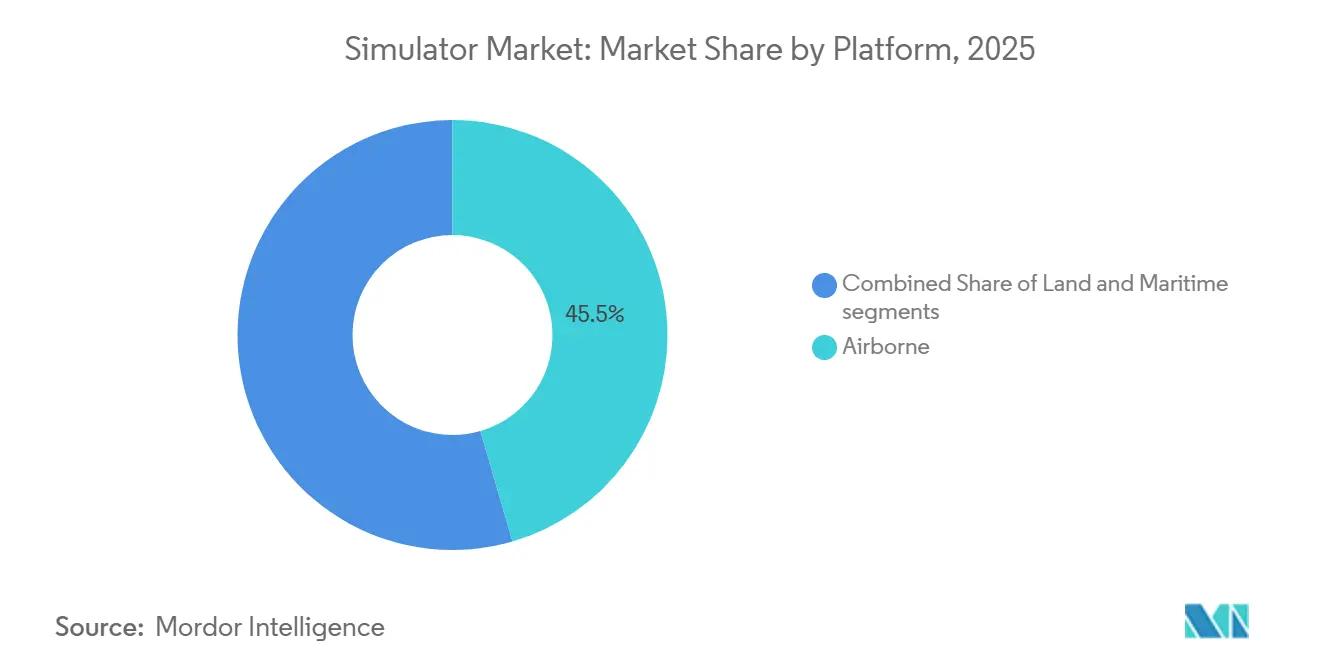
- By platform, airborne simulators accounted for 45.50% of the simulator market share in 2025. At the same time, maritime simulators are forecasted to expand at a 7.13% CAGR through 2031.
- By technique, LVC simulators held 37.25% revenue share in 2025, while gaming and serious-games simulators are advancing at an 8.10% CAGR to 2031.
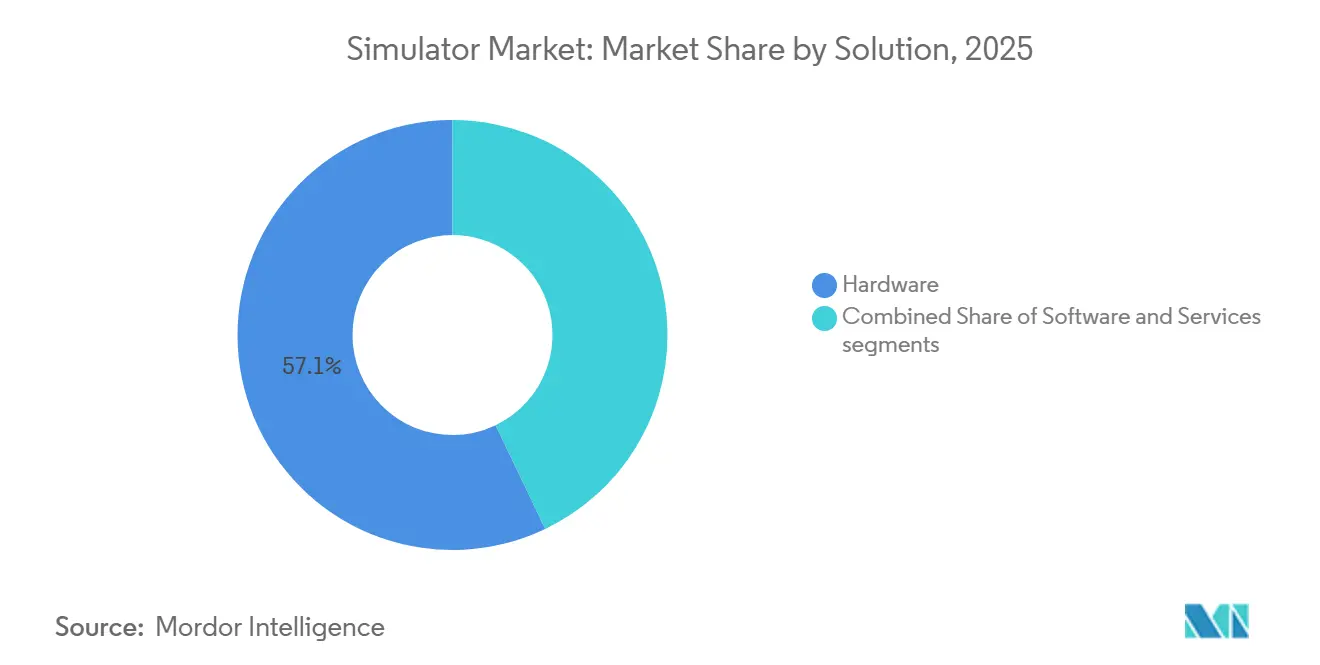
- By solution, hardware accounted for 57.10% of the simulator market in 2025; however, services are expected to grow at a 7.65% CAGR through 2031.
- By application, military and defense training led with a 47.95% share in 2025; research and testing/R&D is projected to rise at a 9.55% CAGR over the forecast period.
- By end user, the military segment accounted for 54.65% of revenue in 2025, whereas the commercial segment is forecasted to grow at a 7.65% CAGR through 2031.
- By geography, North America accounted for 39.60% of the revenue in 2025; the Asia-Pacific region is expected to record a 6.78% CAGR from 2026 to 2031.
Note: Market size and forecast figures in this report are generated using Mordor Intelligence’s proprietary estimation framework, updated with the latest available data and insights as of January 2026.
Global Simulator Market Trends and Insights
Drivers Impact Analysis*
| Driver | (~) % Impact on CAGR Forecast | Geographic Relevance | Impact Timeline |
|---|---|---|---|
| NATO and Indo-Pacific modernization programs mandate LVC networking | +1.2% | North America, Europe, Asia-Pacific | Medium term (2-4 years) |
| EASA/FAA Evidence-Based Training rules require more Level-D simulator hours | +1.0% | Global with North America and Europe focus | Short term (≤ 2 years) |
| Asia’s UAV-logistics boom lifts demand for drone-pilot simulators | +0.8% | Asia-Pacific, spill-over to Middle East | Medium term (2-4 years) |
| Global defense ministries target 25% cost reduction in live training | +1.1% | Global | Long term (≥ 4 years) |
| Digital-twin and AI debrief tools penetrate operator-training simulators | +0.9% | North America, Europe, Asia-Pacific | Medium term (2-4 years) |
| Emerging-market airlines adopt wet-lease sim-as-a-service models | +0.7% | Asia-Pacific, Africa, South America | Short term (≤ 2 years) |
| Source: Mordor Intelligence | |||
NATO and Indo-Pacific Modernization Programs Mandate LVC Networking
Allied militaries embed LVC architectures into daily readiness routines to replicate multi-domain operations without deploying large formations. STANAG 4603 now obliges member states to federate simulators. At the same time, the US Indo-Pacific Command allocated USD 9.9 billion under the Pacific Deterrence Initiative to link F-35 cockpits in Japan with Aegis destroyer trainers in Guam. The UK Ministry of Defence invested approximately GBP 85 million (USD 107 million) in 2025 to upgrade Typhoon simulators with synthetic threat libraries that reflect emerging radar signatures of the J-20 and Su-57. Australia’s Defence Strategic Review pledged AUD 1.2 billion (USD 800 million) through 2027 for a National Synthetic Training Centre that unifies Army, Navy, and Air Force simulators under a fresh High-Level Architecture federation. [3]Source: Australian Department of Defence, “Defence Strategic Review,” defence.gov.au Such programs accelerate the purchase of interoperable devices; however, the need to certify both IEEE 1516-2010 and the HLA 4 standards inflates integration costs for smaller vendors.
EASA/FAA Evidence-Based Training Rules Require More Level-D Simulator Hours
Regulators now require that upset-recovery and manual-handling drills be conducted only inside Level-D simulators equipped with 6-axis motion and panoramic visuals. Air India’s 2024 training expansion in Gurugram added six CAE A320neo and 787 devices to support 500 new pilots annually. Malaysia Aviation Group has opened a 12-bay Sepang center, utilizing Collins Aerospace Pro Line Fusion avionics for recurrent checks. Fiji Airways and Kenya Airways lease hours from FlightSafety International and L3Harris, proving that wet-lease contracts reduce entry cost for emerging-market carriers. Mandatory EBT inflates annual simulator utilization by roughly 15%; build-outs across Asia and the Middle East aim to absorb this load.
Asia’s UAV-Logistics Boom Lifts Demand for Low-Cost Drone-Pilot Simulators
Regulators in Asia have greenlighted beyond-visual-line-of-sight flights for logistics and crop-spraying drones, leading to the introduction of new training protocols. Malaysia's Civil Aviation Authority has set a requirement of 40 simulator hours for each remote pilot managing AirAsia's Teleport drones. In Singapore, Garuda Robotics trains 500 operators annually using desktop systems, which cost under USD 5,000 and replicate the functionalities of DJI and Autel quadcopters. India's DGCA has announced that starting in 2025, all Remote Pilot Certificates will necessitate simulator time. This move has prompted companies like IdeaForge and Zen Technologies to develop and roll out domestic products. By 2028, the Asia-Pacific region is expected to see annual sales of 10,000 to 15,000 simulators, potentially disrupting the traditional flight training supply chain.
Global Defense Ministries Target 25% Cost Reduction in Live Training
Budget pressure and sustainability goals prompt the armed forces to switch from live munitions to digital rounds. The US Air Force reduced F-16 and A-10 flying hours by 8% in FY2025 and redirected USD 320 million to the Advanced Battle Management System wargaming grid. Germany’s Bundeswehr sank EUR 120 million (USD 130 million) into Rheinmetall’s BattleLab to run battalion-level maneuvers without shipping vehicles to Grafenwöhr. France approved EUR 95 million (USD 103 million) for Thales to deliver Rafale F4 synthetic mission rehearsal integrating Meteor missile models. Data from these initiatives show simulators achieve 70-80% of live training outcomes at one-quarter of lifecycle cost, locking in future procurements.
Restraints Impact Analysis*
| Restraint | (~) % Impact on CAGR Forecast | Geographic Relevance | Impact Timeline |
|---|---|---|---|
| Interoperability gaps among NATO DIS, HLA, and Asia-Pacific FOM architectures | -0.7% | Global, acute in joint exercises | Medium term (2-4 years) |
| Precision servomotor and UHD projector shortages inflate lead times | -0.5% | Global manufacturing hubs | Short term (≤ 2 years) |
| Conflict-zone governments reallocate funds to live munitions | -0.6% | Eastern Europe, Middle East | Short term (≤ 2 years) |
| High capital cost inhibits small flight schools in South America and Africa | -0.4% | South America, Africa | Long term (≥ 4 years) |
| Source: Mordor Intelligence | |||
Interoperability Gaps Between NATO DIS, HLA, and Asia-Pacific FOM Architectures
Combined exercises keep exposing protocol mismatches. BALTOPS 2024 saw 18 navies spend six extra months building middleware so South Korean and Japanese simulators could exchange tracks with US Aegis systems. IEEE released HLA 4 in 2024, breaking backward compatibility and compelling vendors to support parallel codebases. Australia’s DSTG estimated in 2025 that unifying Five Eyes simulation networks would cost AUD 200 million (USD 133 million) in software work. Until reference implementations emerge, federations will rely on latency-inducing gateways that limit complexity.
Precision Servomotor and UHD-Projector Shortages Inflate Hardware Lead Times
Moog electro-hydraulic actuators and Texas Instruments' DLP473TE chipsets power full-flight simulators. In 2025, heightened demand from cinema and automotive HUDs extended projector lead times to 24 weeks. Despite Moog's USD 45 million investment to expand its New York factory, the company reported an 18% increase in backlog for FY 2025. Due to projector shortages, CAE postponed three commercial deliveries to the next quarter. To mitigate scheduling risks, integrators are now dual-sourcing components and pre-purchasing long-lead items to ensure a stable supply chain.
*Our forecasts treat driver/restraint impacts as directional, not additive. The impact forecasts reflect baseline growth, mix effects, and variable interactions.
Segment Analysis
By Platform: Maritime Simulators Gain Speed on Geopolitical Tensions
The airborne sub-segment held the largest 45.50% share of the simulator market in 2025, a position cemented by the ever-expanding global civil fleet and the fighter-aircraft readiness cycles that dominate defense budgets. Airlines in the Asia-Pacific region alone ordered more than 650 new jets between 2024 and 2025, resulting in a surge of ab-initio and type-rating sessions that keep Level-D bays occupied around the clock. Air forces also rotate pilots through high-fidelity cockpits to practice radar intercepts, refueling rendezvous, and electronic-warfare countermeasures that cannot be safely rehearsed in congested airspace. Consequently, airborne simulators underwrite predictable upgrade demand despite slower growth prospects.
Maritime simulators record the fastest trajectory, projected to expand at a 7.13% CAGR through 2031 as shipbuilders design synthetic-training loops directly into combat systems. Every Type 26 frigate, Arafura-class patrol vessel, and forthcoming DDG(X) destroyer leaves the yard with embedded bridge, radar, and weapons consoles that can plug into shore hubs for distributed drills. Rising tensions in the South China Sea, the Arctic, and the Red Sea are elevating demand for anti-submarine, mine-countermeasure, and electronic warfare training in virtual settings. These capability demands, coupled with navies’ carbon-reduction mandates, keep maritime growth comfortably ahead of airborne and land platforms.


By Technique: Gaming and Serious-Games Engines Lead CAGR Tables
LVC networks captured the largest 37.25% revenue block of the simulator market in 2025 because NATO’s STANAG 4603 obliges member states to federate air, land, and sea trainers into a single synthetic battlespace. North American and European spending lines fund upgrades that stream F-35 sensor data, Challenger 3 armor analytics, and Aegis combat system data into a standard operational view. These multi-domain grids enable commanders to rehearse composite air operations or carrier-strike protection without burning jet fuel or mobilizing ships, resulting in both budget savings and readiness gains. Sustained modernization budgets ensure LVC’s revenue leadership, even though its growth rate lags behind those of faster techniques.
Gaming and serious-games simulation is enjoying the fastest climb, posting an 8.10% CAGR as commercial game engines mature into military-grade rehearsal tools. The US Army’s Synthetic Training Environment licensed VBS4 and Unity to deliver photorealistic urban blocks, jungles, and high-rise interiors that soldiers can access from laptop PCs costing under USD 2,000, thereby slashing per-seat costs compared to legacy constructive workstations. Police academies, disaster-response agencies, and civil-aviation schools use the same engines to model hostage crises, wildfire spread, or cockpit malfunctions on shared cloud servers. This cross-sector pull, combined with continuous content updates, solidifies gaming techniques as the market’s fastest-growing lane.
By Solution: Services Convert CAPEX to OPEX for Airlines
Hardware remained the simulator market’s most significant revenue pillar, accounting for 57.10% in 2025, as full-flight devices rely on motion systems, high-definition projectors, and replica cockpit shells machined to millimeter tolerances. Each Level-D unit integrates six-axis electric actuators, 4K 120-hertz visual domes, and modular avionics suites, pushing delivered prices beyond USD 15 million and lead times past 18 months when component shortages bite. Defense simulators add classified threat libraries, further inflating bill-of-material costs. These complexity layers give hardware integrators pricing power while exposing them to semiconductor and servomotor bottlenecks, compelling customers to balance outright purchases with emerging service or leasing alternatives.
Services comprise the simulator market’s fastest-growing solution line, advancing at a 7.65% CAGR as operators convert capital expenditures into predictable operating spending. Under pay-per-use contracts, vendors supply instructors, software updates, spare parts, and compliance documentation, while users pay a block-hour fee without assuming residual value risk. CAE now operates 70 global training centers using this model, and FlightSafety International manages fleets for carriers in South America, indexing monthly invoices to flight-hour consumption. The structure shields airlines and smaller militaries from rapid avionics obsolescence and projector shortages, while providing integrators with multi-year annuity streams that smooth quarterly revenue volatility and financing exposure.
By Application: military dominance with R&D innovation
Military and defense training accounted for the largest 47.95% share of the simulator market in 2025, as allied forces rely on synthetic ranges to rehearse complex, multi-domain scenarios that would strain budgets and treaties if conducted live. NATO air wings practice electronic-attack tactics against virtual S-400 batteries, tank crews drill top-attack avoidance inside motion-cued hulls, and naval officers run anti-ship missile salvos in simulated fleets stitched together across continents. These mission types require constant threat-library refreshes and classification controls, ensuring steady hardware upgrades and software license renewals that anchor supplier revenue, even when civil aviation cycles soften materially.
Research and Testing/R&D is expected to grow at a 9.55% CAGR, driven by digital twin workflows that significantly reduce time-to-certification for autonomous vehicles, spacecraft, and advanced airframes. Waymo logged 20 billion simulated miles in 2024 to stress-test new perception algorithms before the public-road rollout, while NASA's Artemis program validated the lunar-lander flight code in immersive domes months before the hardware freeze. Automotive OEMs feed full-vehicle physics into driver-in-loop rigs, allowing engineers to tweak traction-control logic during coffee breaks instead of waiting for proving-ground time. These productivity gains, along with the regulatory credit agencies' virtual evidence, cement R&D's ranking as the fastest-growing application segment in the simulator market through 2031.
By End-User: Commercial Airlines Close the Gap
The military end-user segment retained 54.65% of 2025 revenue because defense ministries lock multi-year budgets around readiness metrics that prioritize simulator access even during austerity cycles. Fighter wings, armored brigades, and submarine crews face mandatory synthetic-time quotas that regulators audit annually, giving vendors visibility that civil customers rarely match. Long-lived platforms, such as B-52 bombers or T-90 tanks, also require training for decades after production, sustaining upgrade pathways for visual systems, avionics, replicas, and classified threat databases. Such structural advantages enable the military line to absorb currency swings and fuel-price shocks without slashing recurrent training allocations, thereby anchoring supplier order books worldwide and meeting demand.
Commercial operators deliver the simulator market’s liveliest end-user growth, advancing at a 7.65% CAGR through 2031 as Asia-Pacific carriers triple fleet sizes and regulators tighten Evidence-Based Training rules. Air India, Malaysia Aviation Group, and Cebu Pacific collectively need more than 8,000 new pilots by 2030, driving continuous Level-D utilization in Gurugram, Sepang, and Manila. Wet-lease contracts allow Fiji Airways and Kenya Airways to bypass USD 15 million in capital checks, paying only for booked hours while vendors assume the maintenance risk. Rising pilot salaries and tight slot availability further incentivize high-throughput synthetic paths, locking commercial demand into a durable upswing for airlines.
Geography Analysis
North America accounted for 39.60% of the 2025 revenue. The US DoD allocated USD 199.4 million to Test and Evaluation Science and Technology in FY 2026. CAE operates its global headquarters in Canada, with 70 centers worldwide. FAA Advisory Circular 120-EBT, issued in 2024, became the template for global competency-based pilot checks. Mexico’s Volaris has ordered two A320neo simulators for delivery in 2026 to support its narrow-body expansion. The US Army’s gaming-engine investments cement the region’s technical lead.
Asia-Pacific is the fastest-growing region, advancing at a 6.78% CAGR. Air India’s 500-jet order, Cebu Pacific’s backlog, and Malaysia’s Sepang training hub spotlight civil drivers. India’s HTT-40 trainer and Japan’s Mitsubishi F-X programs incorporate simulators into their base designs. China’s 2024 defense white paper allocated USD 2.3 billion to constructive simulation for joint ops. South Korea’s KF-21 program features a USD 120 million simulator suite reproducing radar and missile envelopes.
Europe ranks second in revenue. The UK’s Typhoon upgrades, Germany’s Rheinmetall BattleLab, and France’s Rafale F4 rehearsal systems all channeled more than USD 100 million each into synthetic training between 2024 and 2025. The Middle East builds capacity to match indigenous fighter and naval programs; Turkey’s TAI Hürjet includes a USD 45 million simulator suite. Africa and South America trail due to CAPEX barriers and regulatory gaps, though wet-lease centers are emerging in Lomé and Panama City.

Competitive Landscape
The simulator market remains moderately concentrated, with key players such as CAE, Collins Aerospace, and L3Harris leveraging their certification expertise and multi-domain portfolios to maintain their positions in large defense frameworks. CAE operates a network of 70 training centers and secures long-term service agreements with airlines. Collins Aerospace integrates proprietary avionics into its offerings, while Thales incorporates Nautis 3 combat-management software into naval simulators, creating challenges for customers to switch providers. Meanwhile, new entrants such as Bohemia Interactive, Unity, and Improbable are disrupting the market by offering simulator seats priced under USD 5,000. These companies have secured USD 435 million in contracts from the US Army for the 2024-2025 period.
Technological advancements in AI analytics and digital twins are driving market competition. CAE’s Rise AI reduces training hours by 12%, while Lockheed Martin’s digital twins enhance damage-control response by 30%. Thales filed 14 HLA interoperability patents in 2024, demonstrating its commitment to innovation. However, supply chain vulnerabilities persist, with reliance on Moog actuators and Texas Instruments DLP chips causing 4- to 6-month delivery delays in 2025, highlighting a critical concern for the industry.
High barriers to entry remain a defining characteristic of the simulator market. Platform-level buyers demand regulatory certifications and multi-year service commitments, making it challenging for new players to establish themselves. Established companies leverage their technological capabilities and long-term agreements to maintain market dominance. Despite these challenges, emerging competitors are gaining traction by offering cost-effective solutions based on commercial game engines, signaling a shift in market dynamics. The interplay of innovation, supply chain dependencies, and entry barriers continues to shape the competitive landscape.
Simulator Industry Leaders
CAE, Inc.
Collins Aerospace (RTX Corporation)
FlightSafety International Inc.
L3Harris Technologies, Inc.
Thales Group
- *Disclaimer: Major Players sorted in no particular order

Recent Industry Developments
- September 2025: Aboa Mare, a Finnish maritime training academy, bolstered its naval training prowess by procuring a K-Sim Engine Full Mission and Desktop Simulator system from Kongsberg Maritime. Scheduled for delivery in the first quarter of 2026, the system boasts cutting-edge simulator models. These encompass a range of propulsion technologies, from conventional to next-gen options, including hybrid, battery, dual-fuel, LNG, and methanol engines.
- April 2025: Pan Am Flight Academy acquired a Boeing 767-300ER Level “D” full-flight simulator, representing a strategic move to expand its wide-body aircraft training portfolio. Operational by July 2025 at the Axis Park Campus in Miami, this addition enhanced the Academy’s capacity to meet increasing global demand for advanced pilot training. By integrating upgraded simulation technologies, including RSI XT6 Image Generator and UPRT capabilities, Pan Am strengthened its position as a key training provider for Boeing aircraft. This development reflected broader industry trends emphasizing investment in high-quality training solutions to support international carrier operations.
- February 2025: Embraer inked a deal with Rheinmetall to provide C-390 flight simulators for the Royal Netherlands Air Force. As per the contract, Rheinmetall will supply a Full Flight and Mission Simulator and a Cargo Handling Station Trainer by the end of 2026.


Research Methodology Framework and Report Scope
Market Definitions and Key Coverage
Our study defines the simulator market as the sale of purpose-built hardware, software, and support services that replicate real-world air, land, or maritime conditions to train crews, validate designs, and conduct mission rehearsal. Systems range from full-motion flight decks and naval bridges to fixed-base driving and VR/LVC labs that share a common goal, reducing live-training cost and risk.
Scope exclusion: stand-alone consumer gaming rigs that never meet accredited training or research standards are outside our numbers.
Segmentation Overview
- By Platform
- Airborne
- Land
- Maritime
- By Technique
- Live, Virtual, and Constructive (LVC) Simulation
- Synthetic Environment Simulation
- Gaming/Serious-Games Simulation
- By Solution
- Hardware
- Software
- Services
- By Application
- Commercial Pilot and Crew Training
- Military and Defense Training
- Research and Testing/R&D
- By End-User
- Commercial
- Military
- By Geography
- North America
- United States
- Canada
- Mexico
- Europe
- United Kingdom
- France
- Germany
- Rest of Europe
- Asia-Pacific
- China
- Japan
- South Korea
- India
- Rest of Asia-Pacific
- South America
- Brazil
- Rest of South America
- Middle East and Africa
- Middle East
- Saudi Arabia
- United Arab Emirates
- Turkey
- Rest of Middle East
- Africa
- South Africa
- Rest of Africa
- Middle East
- North America
Detailed Research Methodology and Data Validation
Primary Research
Mordor analysts interviewed training-center directors, defense procurement officers, commercial airline fleet-planning leads, and VR optical-engine suppliers across North America, Europe, and Asia-Pacific. These conversations clarified utilization hours, hardware lead times, and the pace at which VR headsets are displacing dome projectors, letting us refine base-year volumes and realistic cost curves.
Desk Research
We began by mapping certified device fleets, learner throughput, and platform backlogs using open sources such as FAA and EASA training requirements, ICAO pilot-demand outlooks, NATO and Indo-Pacific defense budgets, IMO crewing guidelines, UN Comtrade customs codes for HS-8805/9023, and trade-association white papers from IATA and SAE. Company 10-Ks, OEM investor decks, and patent families (via Questel) revealed average selling prices and replacement cycles, while Dow Jones Factiva and D&B Hoovers helped size aftermarket services. These sources anchor historical shipments and price corridors before any modeling begins. The list above is illustrative; many additional public and paid references informed data checks and gap fills.
Market-Sizing & Forecasting
We first built a top-down demand pool by linking mandated simulator hours per pilot, soldier, or deck officer to the active aircraft, vehicle, and vessel fleets in 26 focus countries. Results are then stress tested with selective bottom-up roll-ups, sampled OEM shipments, channel checks on motion-platform orders, and median ASP × volume snapshots to reconcile any variance. Key variables include global passenger-jet deliveries, defense LVC spending lines, commercial pilot license issuances, VR headset ASP declines, and typical 12-year motion-system refurbish cycles. A multivariate regression model projects revenue through 2030, with sensitivity bands for fuel-price shocks and currency shifts. Data voids, when encountered, are bridged by regional proxy ratios validated with expert feedback.
Data Validation & Update Cycle
Every estimate passes a three-layer review: automated anomaly scans, peer analyst audits, and final sign-off. We re-benchmark the model annually, and sooner if material events (e.g., a large defense contract cancellation) move the needle, so clients always receive an up-to-date baseline.
Why Mordor's Simulator Baseline Stands Firm
Published market values often diverge because firms pick different scope lines, pricing ladders, and refresh cadences.
Key gap drivers include: some publishers drop services revenue, others count only flight devices, while a few still rely on 2019 ASPs or lock exchange rates at prior-year averages. Mordor's disciplined inclusion of land and maritime platforms, current-year ASP sampling, and annual refresh eliminates those blind spots.
Benchmark comparison
| Market Size | Anonymized source | Primary gap driver |
|---|---|---|
| USD 21.70 B (2025) | Mordor Intelligence | - |
| USD 12.80 B (2024) | Global Consultancy A | Excludes services and land systems; conservative replacement rate |
| USD 19.67 B (2024) | Industry Publisher B | Aviation-only scope; biennial updates |
| USD 13.03 B (2024) | Trade Journal C | Uses 2019 ASPs; omits Asia-Pacific defense rollouts |
In summary, Mordor Intelligence pairs transparent scope with live variables and frequent updates, giving decision-makers a balanced, verifiable baseline they can rely on for budgeting, procurement, and strategic planning.


Key Questions Answered in the Report
What is the projected size of the Simulator market by 2031?
The simulator market is forecast to reach USD 30.60 billion by 2031 while expanding at a 5.95% CAGR.
Which platform segment is growing the fastest?
Maritime simulators are expected to deliver the highest growth, posting a 7.13% CAGR through 2031.
Why are airlines shifting toward wet-lease simulator models?
Wet-lease contracts convert large capital purchases into predictable operating costs, making recurrent training affordable for carriers in emerging regions.
How do Evidence-Based Training rules affect simulator demand?
EBT mandates require more Level-D hours for upset-recovery and manual-handling drills, boosting annual utilization by around 15% and driving new center build-outs.
Which technology trend is reshaping operator debriefing?
AI-powered analytics and digital-twin integration now parse simulator telemetry to create personalized feedback that cuts time-to-proficiency.
What is the key supply-chain risk facing simulator manufacturers?
Shortages of precision servomotors and UHD projection chipsets have doubled lead times, forcing integrators to dual-source and pre-buy critical components.
Page last updated on:


