United Arab Emirates Data Center Market Size and Share
Market Overview
| Study Period | 2020 - 2031 |
|---|---|
| Forecast Data Period | 2026 - 2031 |
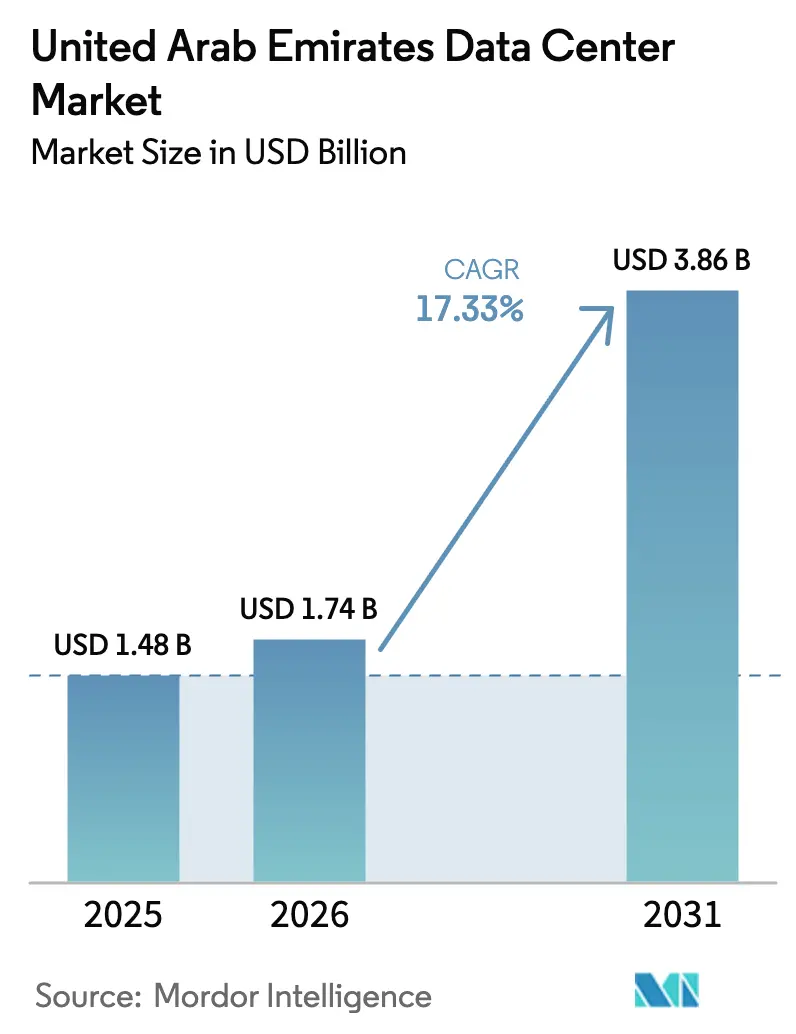
| Base Year Market Size (2025) | USD 1.48 Billion |
| Market Size (2026) | USD 1.74 Billion |
| Market Size (2031) | USD 3.86 Billion |
| Growth Rate (2026 - 2031) | 17.33% CAGR |
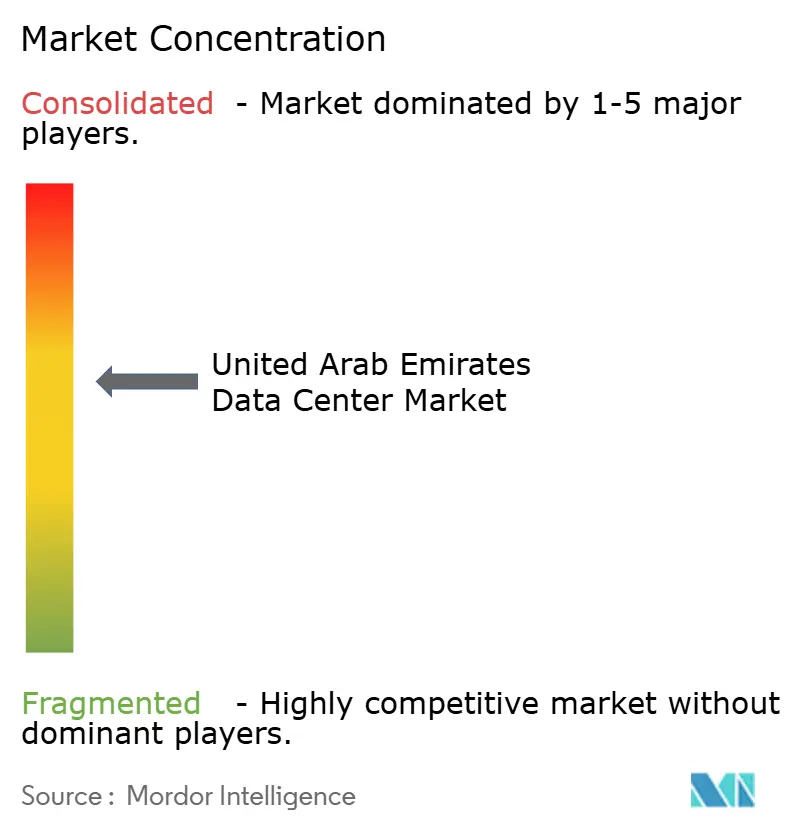
| Market Concentration | Medium |
Major Players*Disclaimer: Major Players sorted in no particular order Image © Mordor Intelligence. Reuse requires attribution under CC BY 4.0. | |
United Arab Emirates Data Center Market Analysis by Mordor Intelligence
United Arab Emirates Data Center market size in 2026 is estimated at USD 1.74 billion, growing from 2025 value of USD 1.48 billion with 2031 projections showing USD 3.86 billion, growing at 17.33% CAGR over 2026-2031. In terms of IT load capacity, the market is expected to grow from 507.70 megawatts in 2025 to 675.80 megawatts by 2030, at a CAGR of 5.89% during the forecast period (2025-2030). The market segment shares and estimates are calculated and reported in terms of MW. Sovereign-backed AI programs, mandatory data-residency rules, and hyperscale cloud expansions are rewriting demand curves as enterprises prioritize local, GPU-dense capacity over retrofits. Government capital commitments topping USD 50 billion, including the 5 GW Stargate complex, reinforce the UAE’s position as the Middle East’s digital infrastructure hub and tilt investment toward liquid-immersion cooling, on-site renewables, and nuclear-sourced baseload power. Localization mandates from the Central Bank of the UAE and the Telecommunications and Digital Government Regulatory Authority further tighten the link between regulatory compliance and domestic compute footprints, while 5G roll-outs and autonomous mobility accelerate the shift toward edge nodes. Market concentration has intensified after Khazna’s capacity leap from 28 MW in 2020 to more than 500 MW in 2025, prompting enterprise buyers to weigh pricing power against the operational resilience promised by sovereign-aligned operators.
Key Report Takeaways
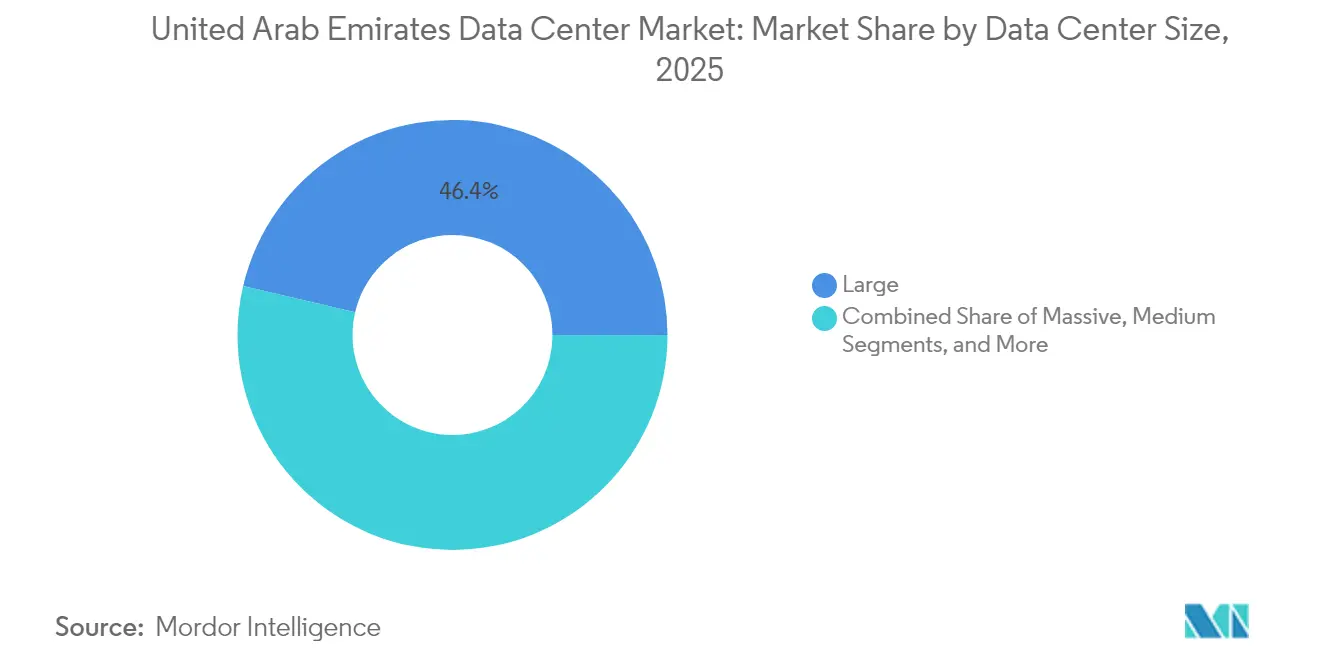
- By data-center size, large facilities led with 46.35% revenue share in 2025 in the United Arab Emirates data center market, while the massive category is forecast to expand at a 7.78% CAGR to 2031.
- By tier standard, Tier 3 infrastructure accounted for 76.60% of the United Arab Emirates data center market share in 2025; Tier 4 is projected to record the fastest 7.28% CAGR through 2031.
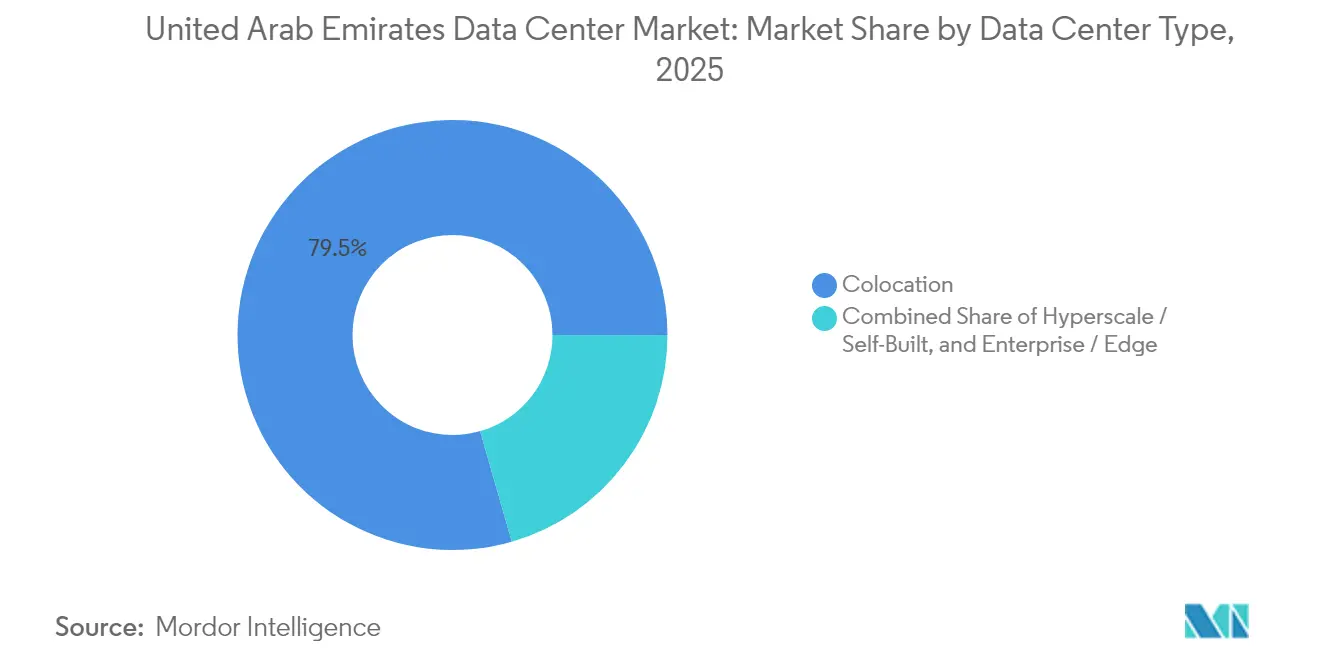
- By data-center type, colocation services captured 79.45% share of the United Arab Emirates data center market size in 2025 and edge computing is advancing at a 7.76% CAGR to 2031.
- By end user industry, IT and telecom held 65.10% share of the United Arab Emirates data center market size in 2025, whereas BFSI exhibits the highest 8.04% CAGR to 2031.
- By hotspot, Dubai commanded 56.75% of the United Arab Emirates data center market share in 2025; Abu Dhabi is growing the quickest at 8.16% CAGR through 2031.
Note: Market size and forecast figures in this report are generated using Mordor Intelligence’s proprietary estimation framework, updated with the latest available data and insights as of 2026.
United Arab Emirates Data Center Market Trends and Insights
Drivers Impact Analysis*
| Driver | (~) % Impact on CAGR Forecast | Geographic Relevance | Impact Timeline |
|---|---|---|---|
| Robust government digital-first agenda and Smart Dubai / UAE 2031 visions | +1.2% | UAE-wide, concentrated in Dubai and Abu Dhabi | Medium term (2-4 years) |
| Accelerated hyperscale cloud region roll-outs by AWS, Microsoft and Google | +0.8% | Dubai and Abu Dhabi primary, spillover to Northern Emirates | Short term (≤ 2 years) |
| Rapid adoption of sovereign AI models (e.g., G42 "Jais") driving GPU-dense builds | +0.9% | Abu Dhabi core, expanding to Dubai | Medium term (2-4 years) |
| Mandatory in-country data-residency for regulated sectors (CBUAE, TDRA) | +0.7% | UAE-wide with DIFC and ADGM concentration | Long term (≥ 4 years) |
| Surging green-hydrogen pilot projects spurring interest in on-site renewable PPA | +0.5% | Abu Dhabi and Dubai with solar integration focus | Long term (≥ 4 years) |
| Emergence of "Desert-cooled" liquid-immersion designs cutting PUE below 1.2 | +0.4% | UAE-wide, particularly high-density AI facilities | Medium term (2-4 years) |
| Source: Mordor Intelligence | |||


Government digital transformation accelerates infrastructure demand
Smart Dubai’s 2024 cloud-first directive and the Digital Government Strategy 2025 push 90% of public services onto digital channels, increasing the call for sovereign cloud footprints that meet strict residency rules.[1]Telecommunications and Digital Government Regulatory Authority, “FedNet Compliance Circular,” tdra.gov.ae MGX’s USD 100 billion technology fund, backed by Mubadala and G42, funnels patient capital into data-center builds that anchor wider AI initiatives. Abu Dhabi’s USD 25 billion energy partnership with Energy Capital Partners underwrites dedicated generation assets, derisking long-term power procurement for hyperscale tenants. Regulatory agencies now require disaster-recovery zones inside national borders, enlarging demand for multi-availability-zone designs. Across ministries, procurement guidelines specify Uptime Institute Tier 3 or higher, advancing the quality baseline of new facilities.
Hyperscale localization drives capacity expansion
Microsoft’s AED 2 billion development agreement with du signals the most aggressive single tranche of foreign hyperscale capital committed to the UAE, immediately locking in power and land allotments ahead of forecasted grid constraints. AWS and Google Cloud follow with region expansions that bundle cybersecurity offsets and workforce-training pledges, accelerating time-to-market for enterprise workloads. Each cloud launch compels colocation operators to pre-provision dark fiber routes and sign renewable-energy power purchase agreements. Secondary effects include a spike in wholesale-rack absorption by managed-service providers that resell cloud interconnects, tightening space in premium facilities. Localization also compresses pricing differences between Dubai and Abu Dhabi as hyperscalers negotiate multi-gigawatt procurement on a national basis.
Sovereign AI models reshape infrastructure requirements
G42’s Jais multilingual LLM family runs on Condor Galaxy systems that demand water-side cooling paired with 100 kW-per-rack densities, steering new builds toward liquid-immersion tanks and high-amp busways.[2]G42, “Jais Model Technical White Paper,” g42.ai The Stargate AI campus allocates 5 GW of dedicated capacity and access to 500,000 Nvidia GPUs every year, positioning the UAE as the region’s AI inference exchange. Microsoft’s Cloud for Sovereignty integration through Core42 allows public-sector workloads to remain in-country while tapping Azure for global redundancy. Together, these deployments prompt supply-chain contracts for next-generation optics and high-bandwidth memory, elevating the component profile above standard enterprise refreshes. Designers now factor nuclear-origin electricity and on-site hydrogen storage into power architecture to meet both reliability and sustainability mandates.
Data residency mandates create localization imperative
The Central Bank of the UAE’s enhanced data-governance rules obligate licensed banks to host primary and secondary systems within the federation, ending the practice of mirroring core banking platforms abroad.[3]Central Bank of the UAE, “Technology Risk Management Standards,” centralbank.ae The TDRA extends similar requirements to telecom operators through FedNet, forcing data-center footprints into every emirate. DIFC’s 2023 data-protection update embeds AI system audits, curbing cross-border transfers unless adequacy benchmarks are met. Multinationals must therefore architect hybrid landscapes that pin personally identifiable information in local pods while maintaining global analytics hubs. Compliance capital expenditures now appear as line-item drivers in facility expansion business cases.
Restraints Impact Analysis*
| Restraint | (~) % Impact on CAGR Forecast | Geographic Relevance | Impact Timeline |
|---|---|---|---|
| Limited domestic semiconductor supply chain for replacement parts | -0.6% | UAE-wide with greater impact on remote facilities | Medium term (2-4 years) |
| Scarcity of Tier-1 construction labour inflating EPC costs | -0.8% | Dubai and Abu Dhabi construction zones | Short term (≤ 2 years) |
| Intensifying cross-border cable-landing competition from Saudi and Oman | -0.4% | UAE coastal regions, particularly Dubai and Fujairah | Medium term (2-4 years) |
| High water-stress leading to stricter Dubai and Abu Dhabi cooling regulations | -0.5% | Dubai and Abu Dhabi metropolitan areas | Long term (≥ 4 years) |
| Source: Mordor Intelligence | |||
Semiconductor supply-chain vulnerabilities constrain growth
U.S. export-license vetting for advanced AI accelerators lengthens lead times and raises the cost of replacement parts for UAE operators, pressuring maintenance windows in mission-critical clusters. While exploratory talks with foundry leaders hint at future domestic fabrication, commercial yields remain multiple years away. The single-sourcing of high-bandwidth memory from South Korea and Taiwan intensifies exposure to geopolitical events, forcing operators to hold larger onsite spares and adopt multi-vendor firmware validation. These measures add capital overhead and complicate power and thermal modeling under worst-case inventory scenarios.
Construction labor scarcity inflates infrastructure costs
Concurrent mega-projects in transport, tourism, and renewables siphon skilled trades from hyperscale builds, raising engineering, procurement, and construction packages by up to 20% against 2024 benchmarks. Contractors import specialty crews from India and the Philippines, but visa cycles, housing shortages, and climate-acclimatization programs stretch project timelines. Labor bottlenecks encourage modular-block designs that ship as pre-fabricated pods, yet the inland freight of oversize containers faces axle-weight restrictions across inter-emirate highways. Developers now stage dual-shift rotations and invest in onsite training centers, adding cost but preserving schedule integrity for time-to-market critical AI tenants.
*Our forecasts treat driver/restraint impacts as directional, not additive. The impact forecasts reflect baseline growth, mix effects, and variable interactions.
Segment Analysis
By Data Center Size: Hyperscale builds reset capacity planning
Massive campuses recorded the highest 7.78% CAGR, signaling operator preference for integrated, purpose-built complexes able to stage phased roll-outs that synchronize with GPU procurement waves. Large facilities still wield 46.35% of capacity and remain the anchor of retail colocation offers, yet new contracts skew toward blocks of 10 MW and above as cloud providers negotiate multi-year take-or-pay terms. The UAE data center market size for massive builds is forecast to reach 256 MW by 2031, capitalizing on economies in high-voltage substation access and heat-recovery loops. Sovereign capital underwrites long-tenor debt at favorable spreads, lowering weighted average cost of capital relative to developer peers in secondary markets and supporting aggressive price-per-kilowatt bids that incumbents struggle to match.
Within this framework, Khazna’s portfolio expansion from 28 MW in 2020 to 500 MW five years later demonstrates how sovereign backing accelerates land-bank assembly, power reservation, and entitlement processing. The UAE data center market share commanded by massive sites will widen once the Stargate campus reaches commercial readiness and rolls subsequent 1 GW tranches, a step change that few private operators can replicate. Mid-sized builds continue to serve disaster-recovery and field-office workloads, yet their pipeline slackens as clients opt for availability-zone diversity within the same hyperscale estate rather than scattered stand-alones.


By Tier Standard: Reliability gains eclipse cost considerations
Tier 3 dominates at 76.60% as enterprises balance redundancy with capital efficiency, but the Tier 4 subset is accelerating at 7.28% CAGR as BFSI, government, and AI inference clusters translate downtime intolerance into contractual service-level objectives. The UAE data center market size for Tier 4 footprints is expected to surpass 151 MW by 2031, driven by the maturation of supply chains for concurrently maintainable switchgear and fault-tolerant powertrain components. Operators chase Up-time Institute design certifications to unlock premium rates and long-term take-or-pay agreements in regulated verticals.
Abu Dhabi Municipality’s achievement of Tier 4 certification for its modular disaster-recovery site sets a public-sector benchmark. Client RFPs now demand micro-segmented security domains and dual-feed cooling tower loops, features easier to hardwire in new builds than to retrofit. Tier 1 and Tier 2 footprints contract in share as dev-test environments migrate to public cloud, concentrating remaining demand in legacy applications awaiting refactoring.
By Data Center Type: Edge nodes scale with 5G use cases
Colocation retains 79.45% share as enterprises favor opex models over capex ownership, especially for regulatory compliance functions that require local but not proprietary walls. Growth, however, tilts toward edge computing nodes advancing at 7.76% CAGR on the back of autonomous transport, smart-city sensors, and mobile content caching. The UAE data center market size allocated to edge nodes is projected to exceed 54 MW by 2031, a threefold lift from 2024 baselines. Telcos refactor central offices into micro-data hubs that host network-function virtualization as well as third-party AI inference services.
Hyperscale self-builds proceed in parallel, particularly where global providers secure strategic land near utility corridors to future-proof against multi-gigawatt expansion. Wholesale colocation has overtaken retail in new signings, reflecting enterprise group-level procurement and the desire to lock in cross-connect ecosystems adjacent to cloud on-ramps.
By End User Industry: BFSI leapfrogs on digital-banking mandates
IT and telecom firms commanded 65.10% of installed megawatts in 2025, mirroring the UAE’s positioning as the Gulf’s digital gateway. The UAE data center market size attributed to BFSI will grow at an 8.04% CAGR, surpassing 97 MW by 2031 as open-finance regulations and central-bank digital-currency pilots shape compute strategies. Banks must host API gateways and regulatory-tech sandboxes inside the federation to comply with CBUAE data-sovereignty rules, a shift that funnels high-availability workloads into Tier 4 zones. Government demand stays resilient as ministries roll out smart-city platforms and e-procurement suites that run on sovereign clouds.
E-commerce, media, and manufacturing maintain steady but secondary uptake, often through multi-tenant wholesale suites rather than purpose-built halls. Content providers emphasize low-latency delivery to mobile users, aligning with edge deployments along 5G base-station rings, while manufacturers adopt AI-driven quality control and digital twin simulations that prefer proximity to IIoT sensor clusters.
Geography Analysis
Dubai’s entrenched 56.75% share arises from first-mover advantages in connectivity, aviation logistics, and a pro-business regulatory design that attracts multinational headquarters and fintech sandboxes. The emirate’s data-center corridors along Al Fujairah Road and Dubai South host the densest concentration of carrier hotels, enabling one-hop latency to key submarine cable bundles landing at Jebel Ali. Green building mandates introduced in 2024 push operators toward desert-cooled liquid immersion and rooftop solar augmentation to maintain competitive power usage effectiveness. Water-scarcity rules, however, constrain evaporative-cooling systems, prompting adoption of closed-loop chillers that raise capex but improve sustainability scores. Price pressures persist as land values escalate near Expo City and Dubai Silicon Oasis, leading some developers to pivot toward multi-story vertical layouts to maximize plot ratios.
Abu Dhabi’s 8.16% CAGR reflects the flywheel effect of sovereign capital, nuclear-based baseload, and land grants within KIZAD and Masdar City that bundle utility connections with long-term lease stability. The Stargate AI campus alone promises 5 GW of eventual draw, dwarfing current national loading and attracting ancillary suppliers in power conditioning, advanced cooling, and chip testing. ADGM’s common-law framework lures asset-management firms that require familiar legal codes, reinforcing compute demand for risk-modeling and trade-settlement engines hosted within the emirate. The convergence of green-hydrogen pilots and solar mega-parks adds optionality for low-carbon attributes in corporate sustainability filings, a differentiator in global RFPs.
Other emirates serve emerging niches anchored in latency-sensitive edge workloads, disaster-recovery reserves, and industrial IoT data aggregation. Fujairah’s Arabian Sea frontage bypasses Hormuz chokepoints, offering alternate landing stations for future cable systems that will lower wholesale transit pricing. Ras Al Khaimah courts blockchain miners through preferential electricity tariffs tied to quarry byproduct power projects, though regulatory uncertainty keeps uptake modest. Sharjah’s University City incubators foster AI start-ups that lease micro-pods inside mixed-use innovation zones. Grid reliability outside the Dubai-Abu Dhabi corridor remains the principal brake on hyperscale builds, but ongoing federal interconnection programs are set to elevate redundancy standards across all seven emirates by 2028.
Competitive Landscape
Khazna Data Centers exerts outsized influence with roughly 70% of national capacity concentrated in more than a dozen campuses, a scale achieved through persistent sovereign backing and a standardized 20 MW module blueprint that accelerates permitting and construction. Silver Lake’s USD 2.2 billion stake introduces Western governance practices while leaving strategic control with G42, aligning capital efficiency with national AI objectives. Khazna’s roadmap prioritizes AI-optimized halls featuring liquid-immersion tanks, high-amp busways, and direct substation connections sized at 250 MVA per block, features that smaller rivals find difficult to replicate.
International challenger Equinix focuses on interconnection-centric facilities near cable landing sites and major carrier exchanges, servicing multinational cloud, SaaS, and media tenants that value network-dense environments over raw megawatt scale. Moro Hub leverages Dubai Electricity and Water Authority ownership to market carbon-neutral hosting packages powered by parkside solar arrays, targeting government and sustainability-oriented enterprises. Gulf Data Hub positions flexible colocation suites for small and mid-cap businesses, offering managed hosting and compliance support embedded within free-zone jurisdictions.
Strategic themes include vertical integration between AI model development, cloud services, and physical infrastructure, as exemplified by G42’s stack that spans chip design partnerships to sovereign LLM deployment. Edge specialists collaborate with telecom operators to retrofit central offices into micro-data centers hosting 5G core functions and content caching, creating distributed fabrics that complement hyperscale cores. Mergers and asset swaps remain plausible as investors seek diversification away from a single dominant player, but regulatory oversight will likely preserve a sovereign-aligned majority stake in any national-scale campus going forward.
United Arab Emirates Data Center Industry Leaders
Equinix Inc.
Etisalat
Gulf Data Hub
Khazna Data Center
Web Werks
- *Disclaimer: Major Players sorted in no particular order

Recent Industry Developments
- April 2025: Google Cloud and the UAE Cyber Security Council launched a cybersecurity center of excellence in Abu Dhabi to advance national cloud defenses.
- March 2025: ADQ entered a USD 25 billion partnership with Energy Capital Partners to finance dedicated power and grid-stability projects for hyperscale campuses.
- February 2025: The UAE announced plans to invest up to EUR 50 billion in French data centers, including a 1 GW AI-specific facility, under the France-UAE strategic AI pact.
- November 2024: Microsoft signed an agreement with ADNOC and Masdar to integrate renewable energy into UAE cloud and data-center operations.


United Arab Emirates Data Center Market Report Scope
Abu Dhabi, Dubai are covered as segments by Hotspot. Large, Massive, Medium, Mega, Small are covered as segments by Data Center Size. Tier 1 and 2, Tier 3, Tier 4 are covered as segments by Tier Type. Non-Utilized, Utilized are covered as segments by Absorption.| Large |
| Massive |
| Medium |
| Mega |
| Small |
| Tier 1 and 2 |
| Tier 3 |
| Tier 4 |
| Hyperscale / Self-Built | ||
| Enterprise / Edge | ||
| Colocation | Non-Utilized | |
| Utilized | Retail Colocation | |
| Wholesale Colocation | ||
| BFSI |
| IT and ITES |
| E-Commerce |
| Government |
| Manufacturing |
| Media and Entertainment |
| Telecom |
| Other End Users |
| Dubai |
| Abu Dhabi |
| Rest of United Arab Emirates |
| By Data Center Size | Large | ||
| Massive | |||
| Medium | |||
| Mega | |||
| Small | |||
| By Tier Standard | Tier 1 and 2 | ||
| Tier 3 | |||
| Tier 4 | |||
| By Data Center Type | Hyperscale / Self-Built | ||
| Enterprise / Edge | |||
| Colocation | Non-Utilized | ||
| Utilized | Retail Colocation | ||
| Wholesale Colocation | |||
| By End User Industry | BFSI | ||
| IT and ITES | |||
| E-Commerce | |||
| Government | |||
| Manufacturing | |||
| Media and Entertainment | |||
| Telecom | |||
| Other End Users | |||
| By Hotspot | Dubai | ||
| Abu Dhabi | |||
| Rest of United Arab Emirates | |||


Market Definition
- IT LOAD CAPACITY - The IT load capacity or installed capacity, refers to the amount of energy consumed by servers and network equipments placed in a rack installed. It is measured in megawatt (MW).
- ABSORPTION RATE - It denotes the extend to which the data center capacity has been leased out. For instance, a 100 MW DC has leased out 75 MW, then absorption rate would be 75%. It is also referred as utilization rate and leased-out capacity.
- RAISED FLOOR SPACE - It is an elevated space build over the floor. This gap between the original floor and the elevated floor is used to accommodate wiring, cooling, and other data center equipment. This arrangement assist in having proper wiring and cooling infrastructure. It is measured in square feet (ft^2).
- DATA CENTER SIZE - Data Center Size is segmented based on the raised floor space allocated to the data center facilities. Mega DC - # of Racks must be more than 9000 or RFS (raised floor space) must be more than 225001 Sq. ft; Massive DC - # of Racks must be in between 9000 and 3001 or RFS must be in between 225000 Sq. ft and 75001 Sq. ft; Large DC - # of Racks must be in between 3000 and 801 or RFS must be in between 75000 Sq. ft and 20001 Sq. ft; Medium DC # of Racks must be in between 800 and 201 or RFS must be in between 20000 Sq. ft and 5001 Sq. ft; Small DC - # of Racks must be less than 200 or RFS must be less than 5000 Sq. ft.
- TIER TYPE - According to Uptime Institute the data centers are classified into four tiers based on the proficiencies of redundant equipment of the data center infrastructure. In this segment the data center are segmented as Tier 1,Tier 2, Tier 3 and Tier 4.
- COLOCATION TYPE - The segment is segregated into 3 categories namely Retail, Wholesale and Hyperscale Colocation service. The categorization is done based on the amount of IT load leased out to potential customers. Retail colocation service has leased capacity less than 250 kW; Wholesale colocation services has leased capacity between 251 kW and 4 MW and Hyperscale colocation services has leased capacity more than 4 MW.
- END CONSUMERS - The Data Center Market operates on a B2B basis. BFSI, Government, Cloud Operators, Media and Entertainment, E-Commerce, Telecom and Manufacturing are the major end-consumers in the market studied. The scope only includes colocation service operators catering to the increasing digitalization of the end-user industries.
| Keyword | Definition |
|---|---|
| Rack Unit | Generally referred as U or RU, it is the unit of measurement for the server unit housed in the racks in the data center. 1U is equal to 1.75 inches. |
| Rack Density | It defines the amount of power consumed by the equipment and server housed in a rack. It is measured in kilowatt (kW). This factor plays a critical role in data center design and, cooling and power planning. |
| IT Load Capacity | The IT load capacity or installed capacity, refers to the amount of energy consumed by servers and network equipment placed in a rack installed. It is measured in megawatt (MW). |
| Absorption Rate | It denotes how much of the data center capacity has been leased out. For instance, if a 100 MW DC has leased out 75 MW, then the absorption rate would be 75%. It is also referred to as utilization rate and leased-out capacity. |
| Raised Floor Space | It is an elevated space built over the floor. This gap between the original floor and the elevated floor is used to accommodate wiring, cooling, and other data center equipment. This arrangement assists in having proper wiring and cooling infrastructure. It is measured in square feet/meter. |
| Computer Room Air Conditioner (CRAC) | It is a device used to monitor and maintain the temperature, air circulation, and humidity inside the server room in the data center. |
| Aisle | It is the open space between the rows of racks. This open space is critical for maintaining the optimal temperature (20-25 °C) in the server room. There are primarily two aisles inside the server room, a hot aisle and a cold aisle. |
| Cold Aisle | It is the aisle wherein the front of the rack faces the aisle. Here, chilled air is directed into the aisle so that it can enter the front of the racks and maintain the temperature. |
| Hot Aisle | It is the aisle where the back of the racks faces the aisle. Here, the heat dissipated from the equipment’s in the rack is directed to the outlet vent of the CRAC. |
| Critical Load | It includes the servers and other computer equipment whose uptime is critical for data center operation. |
| Power Usage Effectiveness (PUE) | It is a metric which defines the efficiency of a data center. It is calculated by: (𝑇𝑜𝑡𝑎𝑙 𝐷𝑎𝑡𝑎 𝐶𝑒𝑛𝑡𝑒𝑟 𝐸𝑛𝑒𝑟𝑔𝑦 𝐶𝑜𝑛𝑠𝑢𝑚𝑝𝑡𝑖𝑜𝑛)/(𝑇𝑜𝑡𝑎𝑙 𝐼𝑇 𝐸𝑞𝑢𝑖𝑝𝑚𝑒𝑛𝑡 𝐸𝑛𝑒𝑟𝑔𝑦 𝐶𝑜𝑛𝑠𝑢𝑚𝑝𝑡𝑖𝑜𝑛). Further, a data center with a PUE of 1.2-1.5 is considered highly efficient, whereas, a data center with a PUE >2 is considered highly inefficient. |
| Redundancy | It is defined as a system design wherein additional component (UPS, generators, CRAC) is added so that in case of power outage, equipment failure, the IT equipment should not be affected. |
| Uninterruptible Power Supply (UPS) | It is a device that is connected in series with the utility power supply, storing energy in batteries such that the supply from UPS is continuous to IT equipment even during utility power is snapped. The UPS primarily supports the IT equipment only. |
| Generators | Just like UPS, generators are placed in the data center to ensure an uninterrupted power supply, avoiding downtime. Data center facilities have diesel generators and commonly, 48-hour diesel is stored in the facility to prevent disruption. |
| N | It denotes the tools and equipment required for a data center to function at full load. Only "N" indicates that there is no backup to the equipment in the event of any failure. |
| N+1 | Referred to as 'Need plus one', it denotes the additional equipment setup available to avoid downtime in case of failure. A data center is considered N+1 when there is one additional unit for every 4 components. For instance, if a data center has 4 UPS systems, then for to achieve N+1, an additional UPS system would be required. |
| 2N | It refers to fully redundant design wherein two independent power distribution system is deployed. Therefore, in the event of a complete failure of one distribution system, the other system will still supply power to the data center. |
| In-Row Cooling | It is the cooling design system installed between racks in a row where it draws warm air from the hot aisle and supplies cool air to the cold aisle, thereby maintaining the temperature. |
| Tier 1 | Tier classification determines the preparedness of a data center facility to sustain data center operation. A data center is classified as Tier 1 data center when it has a non-redundant (N) power component (UPS, generators), cooling components, and power distribution system (from utility power grids). The Tier 1 data center has an uptime of 99.67% and an annual downtime of <28.8 hours. |
| Tier 2 | A data center is classified as Tier 2 data center when it has a redundant power and cooling components (N+1) and a single non-redundant distribution system. Redundant components include extra generators, UPS, chillers, heat rejection equipment, and fuel tanks. The Tier 2 data center has an uptime of 99.74% and an annual downtime of <22 hours. |
| Tier 3 | A data center having redundant power and cooling components and multiple power distribution systems is referred to as a Tier 3 data center. The facility is resistant to planned (facility maintenance) and unplanned (power outage, cooling failure) disruption. The Tier 3 data center has an uptime of 99.98% and an annual downtime of <1.6 hours. |
| Tier 4 | It is the most tolerant type of data center. A Tier 4 data center has multiple, independent redundant power and cooling components and multiple power distribution paths. All IT equipment are dual powered, making them fault tolerant in case of any disruption, thereby ensuring interrupted operation. The Tier 4 data center has an uptime of 99.74% and an annual downtime of <26.3 minutes. |
| Small Data Center | Data center that has floor space area of ≤ 5,000 Sq. ft or the number of racks that can be installed is ≤ 200 is classified as a small data center. |
| Medium Data Center | Data center which has floor space area between 5,001-20,000 Sq. ft, or the number of racks that can be installed is between 201-800, is classified as a medium data center. |
| Large Data Center | Data center which has floor space area between 20,001-75,000 Sq. ft, or the number of racks that can be installed is between 801-3,000, is classified as a large data center. |
| Massive Data Center | Data center which has floor space area between 75,001-225,000 Sq. ft, or the number of racks that can be installed is between 3001-9,000, is classified as a massive data center. |
| Mega Data Center | Data center that has a floor space area of ≥ 225,001 Sq. ft or the number of racks that can be installed is ≥ 9001 is classified as a mega data center. |
| Retail Colocation | It refers to those customers who have a capacity requirement of 250 kW or less. These services are majorly opted by small and medium enterprises (SMEs). |
| Wholesale Colocation | It refers to those customers who have a capacity requirement between 250 kW to 4 MW. These services are majorly opted by medium to large enterprises. |
| Hyperscale Colocation | It refers to those customers who have a capacity requirement greater than 4 MW. The hyperscale demand primarily originates from large-scale cloud players, IT companies, BFSI, and OTT players (like Netflix, Hulu, and HBO+). |
| Mobile Data Speed | It is the mobile internet speed a user experiences via their smartphones. This speed is primarily dependent on the carrier technology being used in the smartphone. The carrier technologies available in the market are 2G, 3G, 4G, and 5G, where 2G provides the slowest speed while 5G is the fastest. |
| Fiber Connectivity Network | It is a network of optical fiber cables deployed across the country, connecting rural and urban regions with high-speed internet connection. It is measured in kilometer (km). |
| Data Traffic per Smartphone | It is a measure of average data consumption by a smartphone user in a month. It is measured in gigabyte (GB). |
| Broadband Data Speed | It is the internet speed that is supplied over the fixed cable connection. Commonly, copper cable and optic fiber cable are used in both residential and commercial use. Here, optic cable fiber provides faster internet speed than copper cable. |
| Submarine Cable | A submarine cable is a fiber optic cable laid down at two or more landing points. Through this cable, communication and internet connectivity between countries across the globe is established. These cables can transmit 100-200 terabits per second (Tbps) from one point to another. |
| Carbon Footprint | It is the measure of carbon dioxide generated during the regular operation of a data center. Since, coal, and oil & gas are the primary source of power generation, consumption of this power contributes to carbon emissions. Data center operators are incorporating renewable energy sources to curb the carbon footprint emerging in their facilities. |


Research Methodology
Mordor Intelligence follows a four-step methodology in all our reports.
- Step-1: Identify Key Variables: In order to build a robust forecasting methodology, the variables and factors identified in Step-1 are tested against available historical market numbers. Through an iterative process, the variables required for market forecast are set and the model is built on the basis of these variables.
- Step-2: Build a Market Model: Market-size estimations for the forecast years are in nominal terms. Inflation is not a part of the pricing, and the average selling price (ASP) is kept constant throughout the forecast period for each country.
- Step-3: Validate and Finalize: In this important step, all market numbers, variables and analyst calls are validated through an extensive network of primary research experts from the market studied. The respondents are selected across levels and functions to generate a holistic picture of the market studied.
- Step-4: Research Outputs: Syndicated Reports, Custom Consulting Assignments, Databases & Subscription Platforms


