Safety Laser Scanner Market Size and Share
Market Overview
| Study Period | 2020 - 2031 |
|---|---|
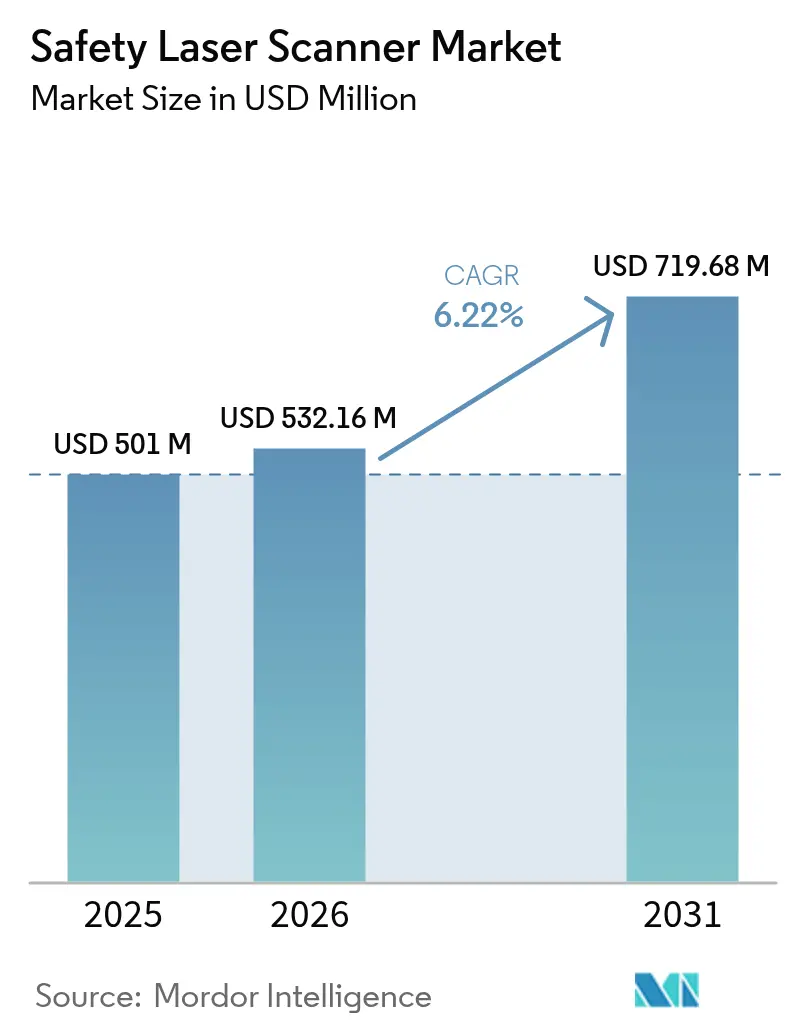
| Market Size (2026) | USD 532.16 Million |
| Market Size (2031) | USD 719.68 Million |
| Growth Rate (2026 - 2031) | 6.22% CAGR |
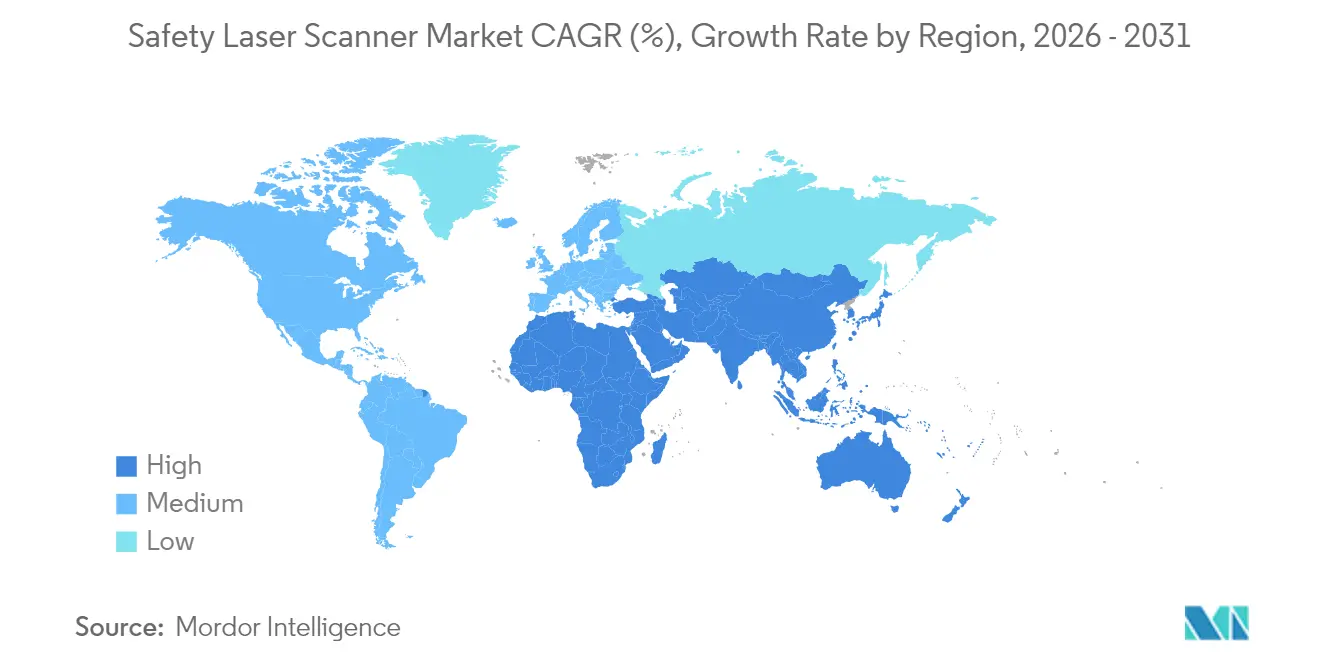
| Fastest Growing Market | Europe, Middle East, and Africa |
| Largest Market | Asia |
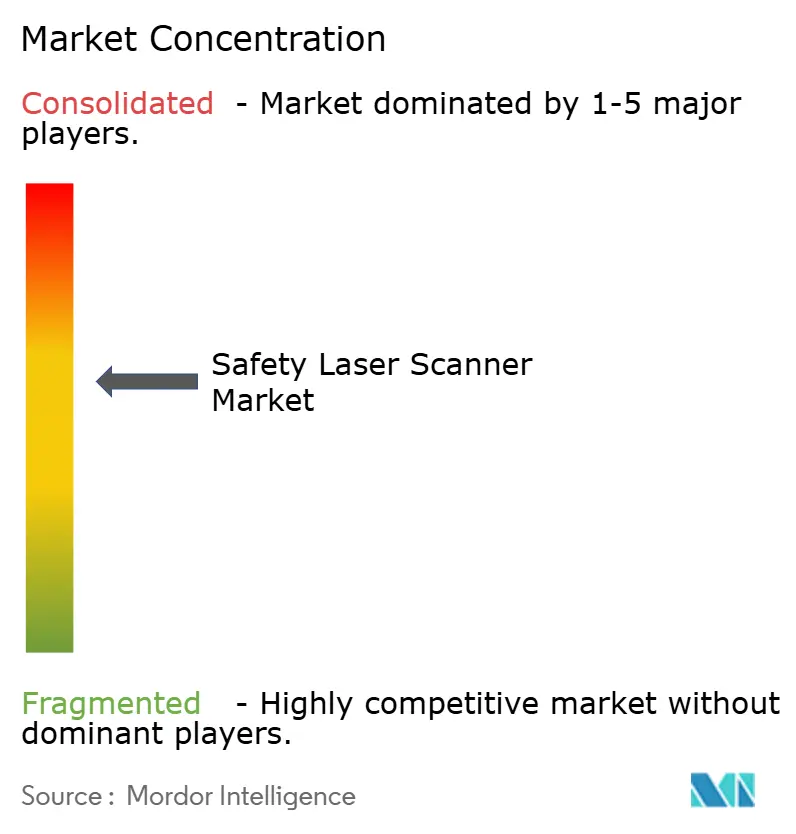
| Market Concentration | Medium |
Major Players *Disclaimer: Major Players sorted in no particular order Image © Mordor Intelligence. Reuse requires attribution under CC BY 4.0. | |
Safety Laser Scanner Market Analysis by Mordor Intelligence
The safety laser scanner market size was valued at USD 501 million in 2025 and estimated to grow from USD 532.16 million in 2026 to reach USD 719.68 million by 2031, at a CAGR of 6.22% during the forecast period (2026-2031). Europe anchors demand with a 35% revenue contribution, while Asia-Pacific is set to post the fastest 7.5% CAGR, buoyed by Chinese electronics automation and “dark-warehouse” projects in Japan-and-r15-08-(industrial-mobile-robots)-implementation). Strong momentum comes from automated guided vehicles (AGVs) and autonomous mobile robots (AMRs), enforcement of ISO 13849-1 and IEC 61496, and a shift toward predictive, data-rich safety systems that integrate with Industry 4.0 architectures. Competitive intensity is moderate: leading vendors differentiate through 275-degree fields of view, safeHDDM® filtering, and on-board analytics, while new entrants push cost-efficient 3D ultrasonic or vision-based alternatives. Region-specific regulations, such as Brazil’s NR-12 and Australia’s IECEx mandates, raise entry barriers but also open opportunities for specialist housings and explosion-proof designs.
Key Report Takeaways
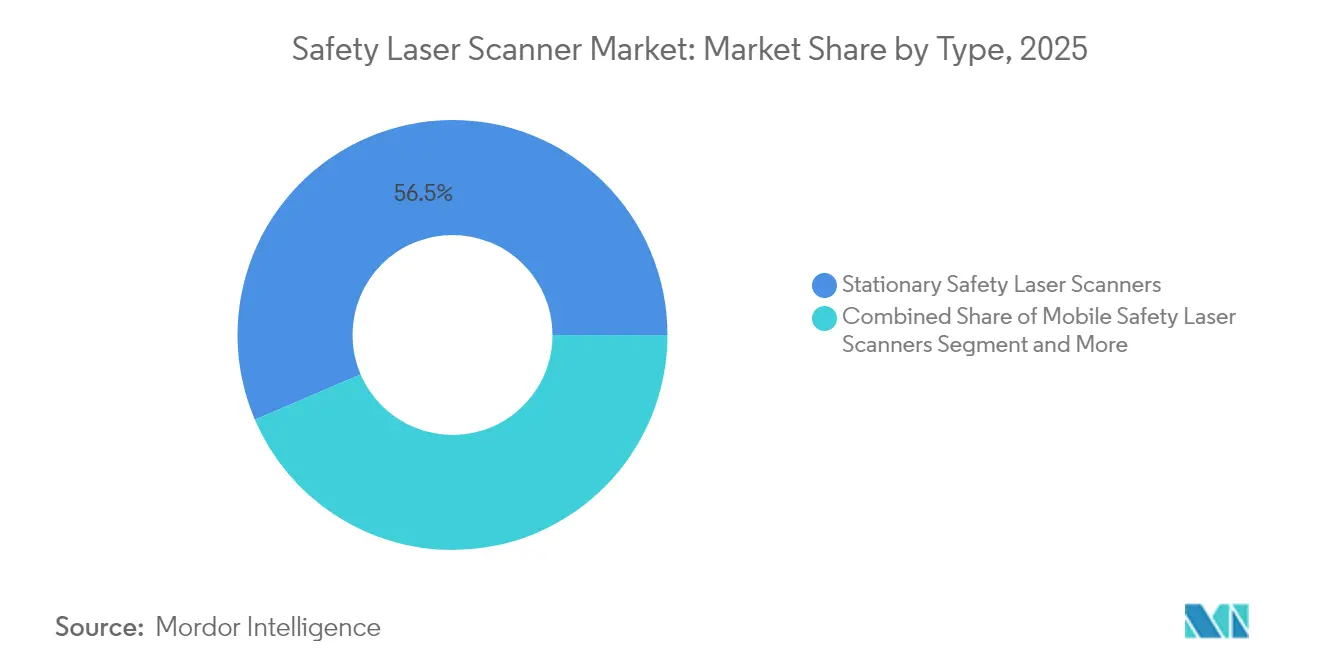
- By type, stationary scanners led with 56.45% of the safety laser scanner market share in 2025, while mobile scanners are projected to compound at 8.28% through 2031.
- By protective-field range, 5 m models accounted for 41.55% revenue in 2025; 7 m variants are poised for the quickest 7.08% CAGR to 2031. By application, conveyor and packaging lines held 32.60% revenue in 2025, whereas area protection & access control is forecast to record a 7.32% CAGR.
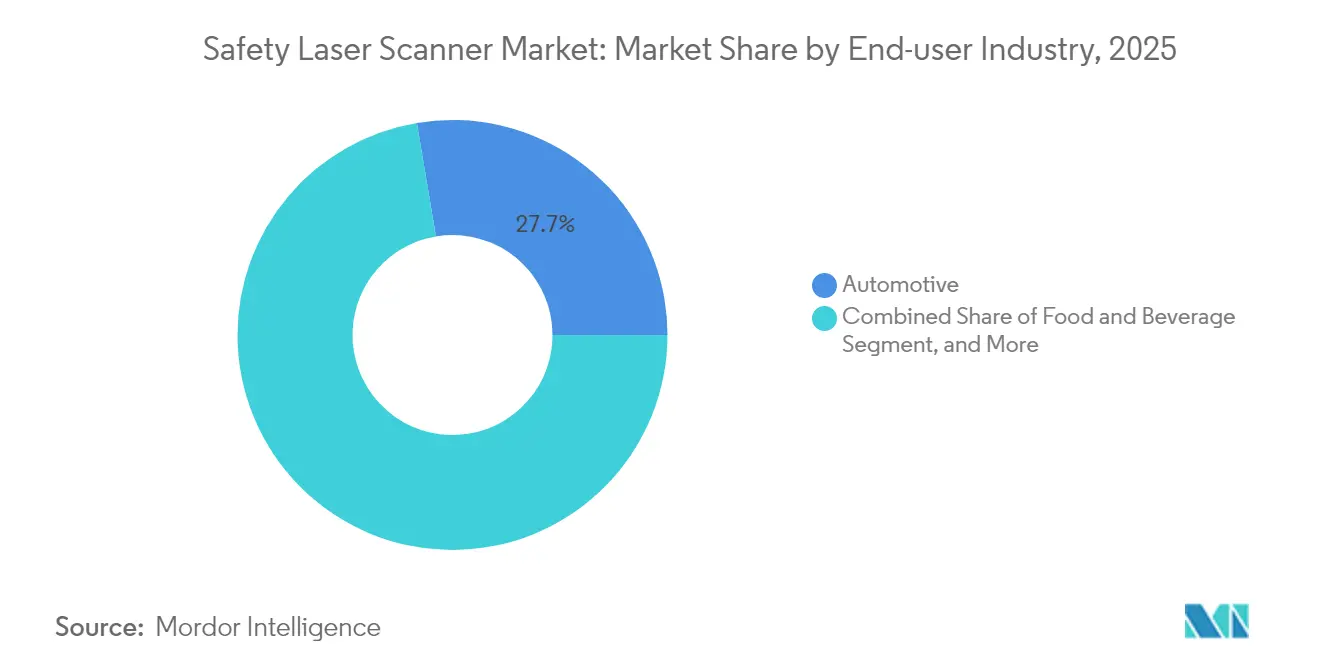
- By end-user industry, automotive retained 27.65% share in 2025; healthcare & pharmaceuticals will grow the fastest at 7.72% CAGR. By connectivity, CAN dominated with 47.40% share in 2025; Ethernet-based scanners will expand at an 7.88% CAGR as factories modernize.
- Regionally, Europe kept 34.70% revenue in 2025, while Asia-Pacific is set to accelerate at 7.33% CAGR on the back of collaborative-robot expansion.
- SICK AG, OMRON, and Keyence together controlled 48% of 2024 revenue, reflecting a moderately concentrated landscape.
Note: Market size and forecast figures in this report are generated using Mordor Intelligence’s proprietary estimation framework, updated with the latest available data and insights as of 2026.
Global Safety Laser Scanner Market Trends and Insights
Drivers Impact Analysis*
| DRIVER | (~) % IMPACT ON CAGR FORECAST | GEOGRAPHIC RELEVANCE | IMPACT TIMELINE |
|---|---|---|---|
| Rapid Adoption of AMRs in European Intralogistics Hubs | 1.8% | Europe, with spillover to North America | Medium term (2-4 years) |
| ISO 13849-1 and IEC 61496 Enforcement at German Automotive OEMs | 1.2% | Europe, particularly Germany | Short term (≤ 2 years) |
| Retrofitting Legacy Machinery in US SMEs for OSHA 1910.212 Compliance | 0.9% | North America | Medium term (2-4 years) |
| Collaborative-Robot Boom in Chinese Electronics Assembly | 1.4% | Asia-Pacific, primarily China | Medium term (2-4 years) |
| Dark Warehouses in Japanese 3PL Driving 270° Mobile Scanner Demand | 0.7% | Asia-Pacific, Japan focus | Long term (≥ 4 years) |
| Stringent FDA Validation Requirements in Pharmaceutical Manufacturing | 1.1% | Global, with concentration in North America and Europe | Medium term (2-4 years |
| Source: Mordor Intelligence | |||
Rapid Adoption of AMRs in European Intralogistics Hubs
European warehouses now field AMR fleets exceeding 1,000 daily missions, such as ifm electronic GmbH’s MiR100 deployment covering 30 km of routes.[1]MiR Editorial, “ifm electronic GmbH Improves Logistics with AMRs,” Mobile Industrial Robots, mobile-industrial-robots.com ISO 3691-4 obliges dynamic protective-field changes, which stationary guarding cannot meet. Consequently, mobile safety laser scanners with multi-zone switching and Ethernet/IP interfaces become essential enablers, rather than mere compliance devices, for material-handling automation.
ISO 13849-1 & IEC 61496 Enforcement at German Automotive OEMs
German carmakers now demand SIL3-validated scanners packaged with full EN ISO 12100:2024 risk-assessment files.[2]Peter König, “EN ISO 12100:2024—Expanded Scope and Verification,” IBF Solutions, ibf-solutions.com New criteria include cybersecurity design and AI-based predictive hazard identification. Vendors that offer adaptive, self-diagnosing scanners secure preferred-supplier status, although upfront validation costs increase system pricing.
Retrofitting Legacy Machinery in US SMEs for OSHA 1910.212 Compliance
OSHA formally recognizes laser guarding as acceptable protection on hydraulic press brakes when injury prevention is proven. This ruling sparks demand from SMEs upgrading decade-old equipment. Plug-and-play IO-Link scanners with wizard configuration reduce downtime, making retrofits financially viable and boosting the safety laser scanner market.
Collaborative-Robot Boom in Chinese Electronics Assembly
Cobot installations in Chinese factories continue to surge, necessitating Speed-and-Separation Monitoring that 2D light curtains cannot deliver. Scanners capable of sub-millisecond responses and 3D zone mapping protect workers while preserving throughput, fuelling adoption in assembly lines and test stations.
Restraints Impact Analysis*
| RESTRAINTS | (~) % IMPACT ON CAGR FORECAST | GEOGRAPHIC RELEVANCE | IMPACT TIMELINE |
|---|---|---|---|
| High SIL2/PLd certification costs for Brazilian & Argentine tier-2 suppliers | -0.8% | South America | Medium term (2–4 years) |
| Dust-induced false trips in Australian mining sites | -0.5% | Australia, global mining | Short term (≤ 2 years) |
| Price erosion from vision-based safety cameras in Nordic robotics | -0.6% | Europe, Nordics | Long term (≥ 4 years) |
| Skilled-labour gap for scanner integration in Middle-East SMEs | -0.4% | Middle East | Medium term (2–4 years) |
| Source: Mordor Intelligence | |||
High SIL2/PLd Certification Costs for Brazilian & Argentine Tier-2 Suppliers
Brazil’s NR-12 requires Portuguese documentation and on-site engineer validation, adding up to 20% of a scanner’s purchase price.[3]Andreas Rudder, “Safety Laser Scanner PSENscan,” Pilz GmbH, pilz.com Smaller suppliers delay adoption, slowing regional growth yet opening consultancy niches for vendors with local compliance teams.
Dust-Induced False Trips in Australian Mining Sites
Thick clouds of ore and coal dust often scatter the laser beam, so scanners register phantom obstacles and trigger emergency stops. Each false alarm forces crews to reset systems or switch to manual mode, slowing production and eroding confidence in automated safety. Coal seams add another layer of complexity because methane in the air requires explosion-proof housings that narrow the scanner’s optical window. CSIRO’s ExScan platform tackles the issue with tailored filters and sealed underground-rated housings, yet the units cost more than standard scanners and remain in early-stage rollouts across large mines. Competing suppliers are now promoting microwave radar and other non-optical sensors that stay reliable in dense dust, a shift that could restrain long-term demand for conventional laser-based systems.
*Our forecasts treat driver/restraint impacts as directional, not additive. The impact forecasts reflect baseline growth, mix effects, and variable interactions.
Segment Analysis
By Type: Mobile Variants Drive Innovation Despite Stationary Dominance
Stationary units retained 56.45% of the safety laser scanner market in 2025, supported by proven uptime on fixed presses and conveyors. Mobile variants, however, are tracking an 8.28% CAGR to 2031 as AMRs proliferate in warehouses. The safety laser scanner market size for mobile solutions is projected to reach USD 337.6 million by 2031, underpinned by compact battery-efficient designs and ISO 3691-4 compliance. Pilz’s PSENscan, for instance, ships with up to 70 configurable fields, letting AMRs recalibrate protection in milliseconds. Stationary models still dominate high-precision automotive body-in-white lines where repeatable guard shapes outweigh flexibility.
Protective-field preference is shifting. Five-meter scanners captured 41.55% of 2025 revenue because they balance coverage and latency, whereas seven-meter models, equipped with optimized optics, will log a 7.08% CAGR. Meanwhile, 3D scanning remains a premium niche for complex welding cells, while cost-driven buyers stick with robust 2D units.


By Application: Area Protection Emerges as Growth Driver
Conveyor and packaging applications drew 32.60% of 2025 revenue, but stricter personnel-safety rules elevate area protection & access control to the fastest 7.32% CAGR. Multi-zone scanners now ring robot welding bays and palletisers, replacing mechanical fences that impede line flexibility. SICK’s microScan3 permits three separate safety fields running in parallel, a critical feature for dense packaging floors. The safety laser scanner market share for area protection is set to climb to 36.80% by 2031 as insurers demand certification evidence.
AGVs and AMRs form the second-largest bucket, yet they will soon eclipse conveyors because intralogistics automation receives the bulk of capital budgets, especially from e-commerce operators. Scanner OEMs embed diagnostic gateways so that fleet-management software can pull health data and schedule predictive maintenance, keeping uptime above 99%.
By End-user Industry: Healthcare Drives Premium Segment Growth
Automotive held 27.65% revenue in 2025 thanks to early adoption on press brakes. Yet pharmaceutical facilities, hungry for ISO-classified cleanrooms, are registering a 7.72% CAGR. The safety laser scanner market size for healthcare applications accounted for USD 36 million in 2025 and will nearly double by 2031 as FDA audits favor documented, self-verifying safety devices. Scanners with HMI-generated validation files simplify 21 CFR Part 11 submissions.
Food and beverage processors adopt IP69K-rated models such as S3000 Cold Store that withstand –30 °C washdowns. Metals and heavy machinery users shift to explosion-proof housings to survive grinding-dust environments, mirroring mining’s IECEx trends.
By Connectivity: Ethernet Adoption Accelerates Industry 4.0 Integration
CAN still rules with 47.40% share because deterministic timing suits safety loops on body-shop lines. Yet Ethernet/IP, PROFINET, and EtherCAT scanners are clocking an 7.88% CAGR as factories converge OT and IT traffic. Real-time condition data feeds predictive analytics dashboards, enabling automatic field-switch risk scoring. IO-Link remains a retrofit play for SMEs that need single-cable power-plus-data simplicity on older presses.
Geography Analysis
Europe controlled 34.70% of 2025 revenue, leveraging strict CE machinery directives and a dense integrator network. German OEMs issue tightened procurement specs that elevate scanner functional safety, whereas Nordic robots shift to camera-based systems, creating price pressure yet also accelerating image-processing add-ons. Regional grant programs targeting carbon-neutral production further incentivize automation, indirectly lifting scanner sales.
Asia-Pacific is on course for a 7.33% CAGR. China’s electronics plants require integrated Speed-and-Separation Monitoring for cobots, and Japan’s logistics firms pursue lights-out operations. Meanwhile, skilled-labour shortages in Taiwan and Korea spur turnkey safety packages bundled with remote diagnostics. India’s automotive Tier-1 suppliers begin piloting Ethernet/IP scanners to future-proof greenfield lines, yet import duties still curb rapid expansion.
North America benefits from OSHA endorsement of laser guarding and clearer NRTL certification pathways. Retrofit projects in metal-forming SMEs and new EV battery plants fuel demand. However, widespread reliance on legacy CAN networks slows the shift to data-rich Ethernet models. South America struggles with NR-12 cost burdens that push smaller outfits toward cheaper mechanical guards, though multinational OEMs maintain purchases to meet corporate safety KPIs. Africa remains nascent; mining enclaves adopt scanner-protected robotic drilling rigs but volumes stay low.

Competitive Landscape
The market shows moderate concentration. SICK AG, OMRON, and Keyence jointly hold 48% revenue, relying on patented optics and software to maintain margins. SICK’s safeHDDM® digital filter improves dust immunity, while OMRON bundles scanners with Sysmac controllers for single-vendor safety. Keyence markets 275-degree models with colour HMIs that guide installers during validation.
New entrants attack on price and niche environments. Australian-based CSIRO licenses ExScan explosion-proof technology to OEMs serving methane-rich mines. Sonair pilots 3D ultrasonic arrays that promise 50-80% cost cuts for AMRs, extracting share in cost-sensitive European SME segments. Vendors with in-house certification teams gain an edge in Latin America, where local engineer validation is mandatory. Partnerships with integrators that possess cybersecurity credentials become decisive as scanners increasingly connect to enterprise networks.
Safety Laser Scanner Industry Leaders
Leuze Electronics GmbH
OMRON Corporation
Panasonic Corporation
Rockwell Automation Inc.
SICK AG
- *Disclaimer: Major Players sorted in no particular order

Recent Industry Developments
- February 2025: Pepperl+Fuchs upgraded R2000 scanners for explosion-protected oil-and-gas sites.
- January 2025: Mobile Industrial Robots highlighted ifm electronic’s 1,000+ mission AMR fleet, demonstrating scanner integration benefits.
- October 2024: SICK added multi-field evaluation to microScan3, enabling concurrent monitoring of cobot cells.
- September 2024: Sonair unveiled a 180×180 FOV 3D ultrasonic sensor line for AMR safety, claiming 50-80% cost reduction.


Global Safety Laser Scanner Market Report Scope
The scope of the study for the security laser scanners market has considered the vendors offering products for both stationary and vertical application with various coverage angle and response rate for a wide range of applications across the geographical regions.
| Stationary Safety Laser Scanners |
| Mobile Safety Laser Scanners |
| Protective-Field Range (3 m, 5 m, 7 m) |
| Scanning Dimension (2D, 3D) |
| Connectivity (Ethernet, CAN, IO-Link) |
| AGVs and AMRs |
| Robotic Cells |
| Conveyor and Packaging Lines |
| Area Protection and Access Control |
| Automotive |
| Food and Beverage |
| Healthcare and Pharmaceuticals |
| Consumer Goods and Electronics |
| Logistics and Warehousing |
| Metals and Heavy Machinery |
| Oil and Gas |
| Ethernet |
| CAN |
| IO-Link |
| North America | United States |
| Canada | |
| Mexico | |
| Europe | United Kingdom |
| Germany | |
| France | |
| Italy | |
| Rest of Europe | |
| Asia-Pacific | China |
| Japan | |
| India | |
| South Korea | |
| Rest of Asia-Pacific | |
| Middle East | Israel |
| Saudi Arabia | |
| United Arab Emirates | |
| Turkey | |
| Rest of Middle East | |
| Africa | South Africa |
| Egypt | |
| Rest of Africa | |
| South America | Brazil |
| Argentina | |
| Rest of South America |
| By Type | Stationary Safety Laser Scanners | |
| Mobile Safety Laser Scanners | ||
| Protective-Field Range (3 m, 5 m, 7 m) | ||
| Scanning Dimension (2D, 3D) | ||
| Connectivity (Ethernet, CAN, IO-Link) | ||
| By Application | AGVs and AMRs | |
| Robotic Cells | ||
| Conveyor and Packaging Lines | ||
| Area Protection and Access Control | ||
| By End-user Industry | Automotive | |
| Food and Beverage | ||
| Healthcare and Pharmaceuticals | ||
| Consumer Goods and Electronics | ||
| Logistics and Warehousing | ||
| Metals and Heavy Machinery | ||
| Oil and Gas | ||
| By Connectivity | Ethernet | |
| CAN | ||
| IO-Link | ||
| By Geography | North America | United States |
| Canada | ||
| Mexico | ||
| Europe | United Kingdom | |
| Germany | ||
| France | ||
| Italy | ||
| Rest of Europe | ||
| Asia-Pacific | China | |
| Japan | ||
| India | ||
| South Korea | ||
| Rest of Asia-Pacific | ||
| Middle East | Israel | |
| Saudi Arabia | ||
| United Arab Emirates | ||
| Turkey | ||
| Rest of Middle East | ||
| Africa | South Africa | |
| Egypt | ||
| Rest of Africa | ||
| South America | Brazil | |
| Argentina | ||
| Rest of South America | ||


Key Questions Answered in the Report
What is the current value of the safety laser scanner market?
The market stands at USD 532.16 million in 2026 and is projected to reach USD 719.68 million by 2031.
Which region will grow the fastest through 2031?
Asia-Pacific is forecast to post a 7.33% CAGR, led by Chinese electronics automation and Japanese lights-out warehouses.
Why are mobile safety laser scanners gaining traction?
Rising AMR deployments require dynamic, 360° protection fields that stationary guards cannot provide, driving an 8.28% CAGR for mobile units.
How are regulations influencing demand?
Standards such as ISO 13849-1, IEC 61496, and OSHA 1910.212 mandate sophisticated area monitoring, spurring upgrades across Europe and North America.
Which end-user segment is expanding the quickest?
Healthcare and pharmaceuticals, at a 7.72% CAGR, due to stringent cleanroom validation and FDA documentation requirements.
What technologies threaten traditional laser scanners?
Cost-efficient 3D ultrasonic sensors and vision-based safety cameras are emerging, pressuring prices in cost-sensitive segments.
Page last updated on:


