Russia Data Center Market Size and Share
Market Overview
| Study Period | 2020 - 2031 |
|---|---|
| Forecast Data Period | 2026 - 2031 |
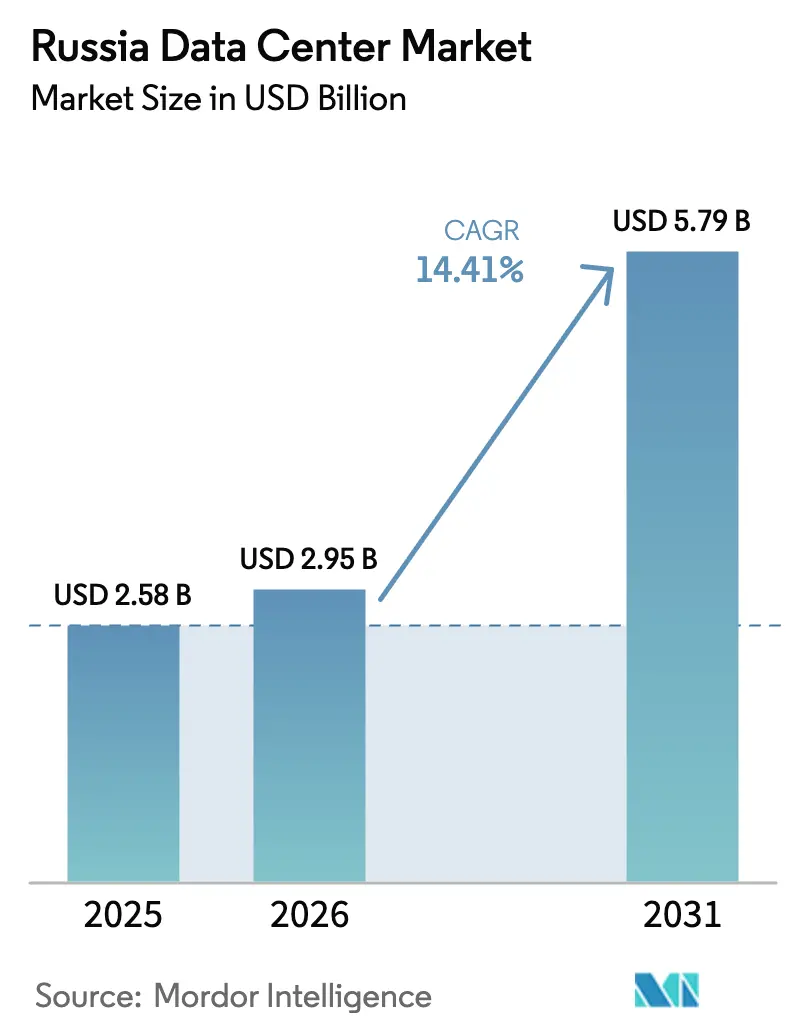
| Base Year Market Size (2025) | USD 2.58 Billion |
| Market Size (2026) | USD 2.95 Billion |
| Market Size (2031) | USD 5.79 Billion |
| Growth Rate (2026 - 2031) | 14.41% CAGR |
| Market Concentration | High |
Major Players*Disclaimer: Major Players sorted in no particular order Image © Mordor Intelligence. Reuse requires attribution under CC BY 4.0. | |
Russia Data Center Market Analysis by Mordor Intelligence
The Russia data center market size was valued at USD 2.58 billion in 2025 and estimated to grow from USD 2.95 billion in 2026 to reach USD 5.79 billion by 2031, at a CAGR of 14.41% during the forecast period (2026-2031). Meanwhile, the IT load capacity is expected to increase from 1,010 MW to 1,140 MW during the same period, growing at a 2.45% CAGR. The market segment shares and estimates are calculated and reported in terms of MW. This widening gap between capacity and value reflects premium pricing caused by constrained server imports, rising construction costs, and surging demand for sovereign cloud and AI workloads. Digital sovereignty rules, effective July 2025, the RUB 695 billion federal transformation budget, and a 24.4% spike in 2024 internet traffic bolster utilization rates inside Moscow and emerging regional hubs. Operators also gain from enterprise cloud migration, edge deployment for 5G, and the build-out of Rosatom’s low-cost nuclear-powered campuses. However, sanctions-driven hardware shortages, double-digit power-tariff hikes in major metros, and a talent drain of senior engineers temper near-term supply additions.[1]Ministry of Digital Development, “Methodological Guidelines on Unacceptable Events for Ensuring Continuity of Organizations,” digital.gov.ru
Key Report Takeaways
- By data center size, large facilities led with 56.55% revenue share in 2025, while massive campuses recorded the fastest 2.69% CAGR through 2031.
- By tier type, Tier 3 captured 77.10% of the Russia data center market share in 2025, whereas Tier 4 grew at the highest 2.95% CAGR to 2031.
- By facility type, colocation accounted for 59.10% of the 2025 Russia data center market size, and hyperscale self-built sites advance at a 2.75% CAGR over the forecast horizon.
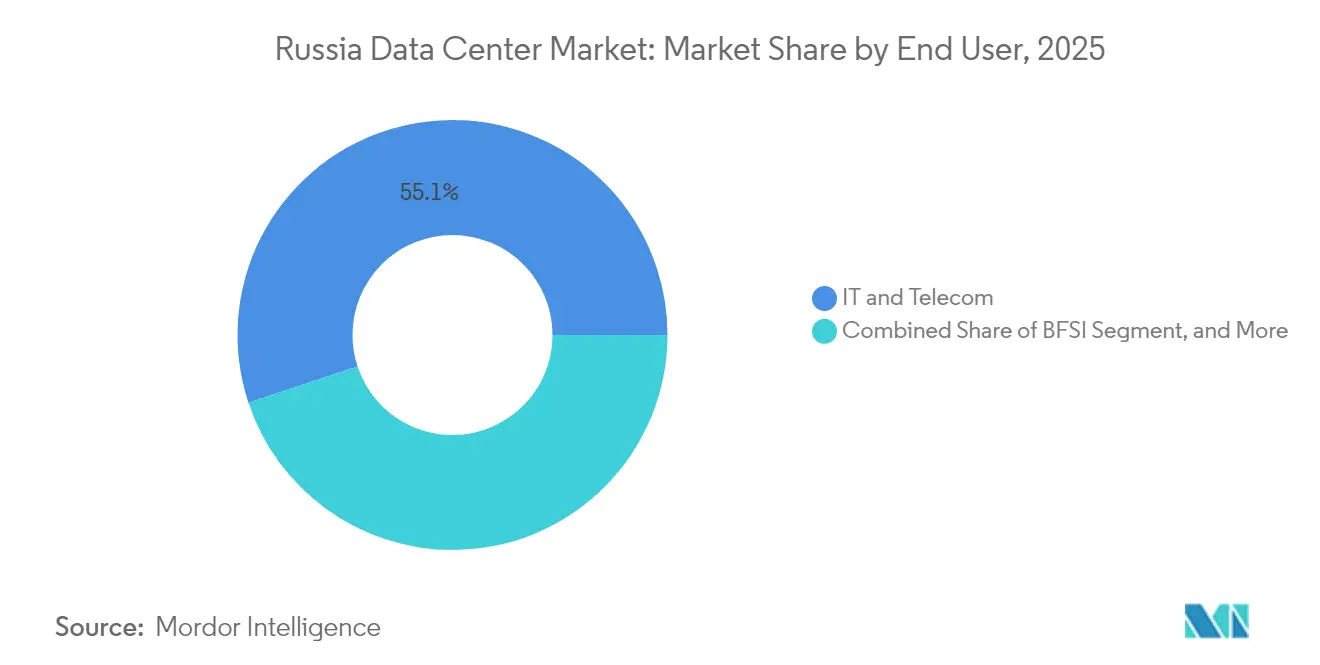
- By end-user vertical, IT and telecom held 55.10% share in 2025, while BFSI posts the strongest 2.30% CAGR through 2031.
- By geography, Moscow represented 62.30% of 2025 spending, and the Rest of Russia expands at a 3.06% CAGR to 2031.
Note: Market size and forecast figures in this report are generated using Mordor Intelligence’s proprietary estimation framework, updated with the latest available data and insights as of 2026.
Russia Data Center Market Trends and Insights
Drivers Impact Analysis*
| Driver | (~) % Impact on CAGR Forecast | Geographic Relevance | Impact Timeline |
|---|---|---|---|
| Accelerated cloud migration among Russian enterprises | +0.80% | National, concentrated in Moscow and St. Petersburg | Medium term (2-4 years) |
| Federal digital-economy initiatives driving data localisation | +0.60% | National, with regional program focus | Long term (≥ 4 years) |
| Surge in OTT video streaming and online gaming traffic | +0.40% | National, urban concentration | Short term (≤ 2 years) |
| Edge-computing demand fuelled by 5G rollout | +0.30% | Major cities, expanding to regions | Medium term (2-4 years) |
| Deployment of AI supercomputers for sovereign LLMs | +0.20% | Moscow, Novosibirsk, academic centers | Long term (≥ 4 years) |
| Rosatom nuclear-powered green data-centre projects | +0.20% | Specific nuclear plant locations | Long term (≥ 4 years) |
| Source: Mordor Intelligence | |||


Accelerated Cloud Migration Among Russian Enterprises
Enterprise cloud spending is rising by 30% annually, with average contract lengths lengthening to five years and monthly wallet share expanding by 2%. Tier-1 providers report 50-70% revenue growth, spurring predictable multi-megawatt demand for colocation halls positioned near headquarters districts. Moscow campuses gain the most short-run bookings as they offer dense carrier connectivity and established service desks. This workload shift toward scalable platforms cements a baseline growth path for the Russia data center market.[2]Yandex, “Forecast of the Cloud Services Market in Russia 2025-2029,” yandex.ru
Federal Digital-Economy Initiatives Driving Data Localisation
More than RUB 695 billion is earmarked for regional projects in 2025-2027 that require agencies to rely on domestic clouds and software. Tightened personal-data laws from July 2025 force multinationals to process Russian citizen files locally, funnelling workloads into compliant Tier 3 and Tier 4 halls. By tying budget disbursements to regional cloud-usage metrics, the program accelerates construction in secondary cities and reduces over-reliance on the capital region.[3]Ministry of Digital Development, “Methodological Instructions on Categorizing Critical Information Infrastructure in Telecommunications,” digital.gov.ru
Surge in OTT Video Streaming and Online Gaming Traffic
Domestic platforms replaced blocked foreign services, resulting in a 28.1% increase in fixed-line data volumes in 2024 and a corresponding rise in total traffic to 188,530 petabytes. Subscriber counts on streaming services climbed from 45 million to 58 million, and local game studios launched latency-sensitive titles. These content trends increase rack-level power density, raise edge cache spending, and stimulate upgrades to peering nodes that anchor the Russian data center market.
Edge-Computing Demand Fuelled by 5G Rollout
Pilot 5G clusters from MTS and its peers require low-latency processing for VR, industrial IoT, and network function virtualization. Telecom operators invested RUB 350 billion in 2024 infrastructure, carving budgets for micro-data centers sited within tower compounds and manufacturing zones. As 5G expands beyond Moscow, a distributed grid of small facilities unlocks new addressable demand for regional providers, diversifying revenue beyond legacy wholesale colocation.
Restraints Impact Analysis*
| Restraint | (~) % Impact on CAGR Forecast | Geographic Relevance | Impact Timeline |
|---|---|---|---|
| Export restrictions on advanced server hardware | -0.50% | National, acute in hyperscale deployments | Short term (≤ 2 years) |
| Rising electricity tariffs in major metros | -0.30% | Moscow, St. Petersburg metropolitan areas | Medium term (2-4 years) |
| Scarcity of Tier IV-certified contractors outside Moscow | -0.20% | Regional markets, excluding Moscow | Medium term (2-4 years) |
| Talent drain of experienced data-centre engineers | -0.20% | National, concentrated in technical centers | Long term (≥ 4 years) |
| Source: Mordor Intelligence | |||
Export Restrictions on Advanced Server Hardware
Sanctions block the import of latest-generation CPUs, GPUs, and switching silicon, forcing operators to overpay via third-country brokers or opt for domestic alternatives. YADRO’s OpenYard line alleviates bottlenecks yet still trails global throughput standards and has limited annual output. Resulting capex inflation slows build schedules and constrains hyperscale expansions, temporarily capping upside for the Russia data center market until local fabs scale.
Rising Electricity Tariffs in Major Metros
Power prices in Moscow Oblast rose 12-16% in 2025, and energy accounts for 60-70% of data-center opex. Operators respond by improving PUE, curbing non-critical lighting loads, and exploring colder northern sites with cheaper hydro and nuclear power supplies. While tariff pressure erodes short-term margins, it also nudges future builds toward Siberia and Rosatom-adjacent zones, redistributing growth trajectories across the Russia data center market.
*Our forecasts treat driver/restraint impacts as directional, not additive. The impact forecasts reflect baseline growth, mix effects, and variable interactions.
Segment Analysis
By Data Center Size: Massive Campuses Gain Velocity
Large sites held a 56.55% revenue lead in 2025, underpinned by balanced cost and scalability profiles. The massive-facility cohort is projected to post a 2.69% CAGR to 2031 as cloud hyperscalers and AI labs commission single-site clusters exceeding 50 MW. Nebius Group’s USD 1 billion AI campus signals rising preference for high-density footprints with dedicated sub-stations and proprietary cooling. Consolidation around multi-hall complexes drives economies that protect margins despite hardware shortages. Smaller edge and medium facilities still proliferate for 5G and regulatory proximity needs, yet their combined share steadily drops as core workloads agglomerate at scale.
The Russia data center market size for massive campuses grows faster because sovereign LLM training swells GPU rack demand, while Tier 4 security mandates favour contiguous, controllable premises. Conversely, mega-scale government builds progress cautiously due to capital intensity and supply-chain uncertainty. Balanced portfolios emerge as operators deploy large backbone hubs near Moscow, complemented by satellite pods closer to users to satisfy latency targets.


By Tier Type: Upshift Toward Tier 4 Reliability
Tier 3 frameworks held a 77.10% market share in 2025, widely regarded as the optimal balance between redundancy and cost. Financial regulators and the new critical-infrastructure code, however, raise uptime targets, allowing Tier 4 halls to clock the fastest 2.95% CAGR. Core banking, securities settlement, and digital-identity platforms migrate into concurrently maintainable environments with 99.995% availability. Tier 1 and Tier 2 footprints persist in remote locales where ambient temperatures offset cooling loads and workloads tolerate scheduled downtime.
Due to these dynamics, the Russia data center market share for Tier 4 is expected to rise gradually yet steadily, driven by a combination of regulatory requirements and competitive risk management among top banks. Operators able to design, certify, and staff Tier 4 premises outside Moscow seize an early-mover premium and help decentralize national capacity.
By Data Center Type: Colocation Retains Lead While Hyperscale Accelerates
With 59.10% of 2025 revenue, colocation continues to anchor enterprise digital pivots, offering pay-as-you-grow capacity without capex burdens. Still, self-built hyperscale facilities enjoy a 2.75% CAGR as Yandex Cloud, VK, and game publishers seek workload-specific architectures and direct control of security stacks. Colocation suppliers respond by adopting modular build blocks, flexible power topologies, and connectivity marketplaces to remain relevant.
Infrastructure scarcity in the capital keeps rates elevated, letting incumbents fund expansions into the Rest of Russia. At the same time, sovereign AI and search-index pods often require proprietary network fabrics, prompting developers to construct greenfield hyperscale buildings designed for liquid cooling and 100G spine-leaf architectures. This duality ensures both service models coexist and together underpin the Russia data center market through 2030.
By End User: BFSI Gains Momentum Amid IT and Telecom Dominance
IT and telecom firms account for 55.10% of current demand, thanks to the prevalence of software-defined networks, content distribution nodes, and carrier-neutral interconnection hubs. Banks and insurers accelerate at a 2.30% CAGR, propelled by real-time payments, remote banking adoption, and tightened continuity rules that prescribe Tier 4 hosting. E-commerce follows closely, requiring low-latency APIs, fraud analytics clusters, and the ability to scale relentlessly during the holiday season.
Manufacturing, media, and public-sector workloads each deepen their penetration, albeit from smaller bases, collectively diversifying end-user exposure within the Russian data center market. Workload complexity, rather than raw traffic, is increasingly shaping purchasing decisions, driving requests for high-density racks, burstable power, and on-site key management services in response to sector-specific regulations.
By Hotspot: Capital Strength Meets Regional Upswing
Moscow retains a 62.30% concentration due to its unmatched carrier hotels, proximity to business districts, and skilled labor pools. Yet, a 3.06% CAGR in the Rest of Russia underscores a drift toward cities such as Novosibirsk, Nizhny Novgorod, and Tver, where land and electricity costs are lower and federal grants offset the costs of transport infrastructure development. The Russia data center market size for non-capital zones is increasing as ministries require a share of workloads to remain within their home districts to improve service resiliency and meet latency thresholds.
BitRiver’s hydro-powered Far East campus and Rosatom’s nuclear-fuelled Tver project illustrate how regional propositions combine cheap electrons with renewable or carbon-neutral narratives. Fiber backhaul gaps remain a hurdle, but multi-year state digital economy funding earmarks optical backbone upgrades that progressively align regional SLAs with Moscow benchmarks.
Russia Data Center Market - Geography Analysis
Moscow’s entrenched 63.07% hold is based on dense dark-fiber routes, robust peering exchanges, and proximity to head offices, providing immediate access to decision-makers and support engineers. Despite tariff hikes eating into opex, high average selling rates and near-zero vacancy maintain strong EBITDA margins. Operators continue to add phases through mezzanine power upgrades and modular expansions within existing compounds, rather than incurring the costs of new land purchases.
Secondary cities exhibit a sharper 3.20% CAGR as subsidy packages and lower power prices improve project IRRs. Siberian hydro and Far East nuclear sources offer electrons at prices 40-60% lower than Moscow quotes, making sites magnets for AI-training clusters. Edge nodes within industrial belts also proliferate to serve IoT workloads in metallurgy, oil, and gas fields, ensuring latency under 10 milliseconds.
Cross-regional fiber-optic corridors financed under the national “Digital Economy” program shorten backhaul times and simplify compliance for agencies headquartered outside the capital. This policy mix steadily de-risks geographic diversification, pulling the growth vector away from an over-centralized Moscow footprint and ultimately fostering a polycentric Russia data center market.[4]D-Russia, “Recommended Digital-Transformation Indicators for Regions 2025-2027,” d-russia.ru
Competitive Landscape
Top Companies in Russia Data Center Market
Market concentration is moderate. State-backed Rostelecom and Rosatom provide large footprints, long-term utility contracts, and regulatory influence. Rostelecom extends channel depth among ministries and large enterprises, whereas Rosatom leverages nuclear-adjacent plots that offer 25-year power-purchase stability for high-density loads. Private specialists, such as Nebius Group and IXcellerate, focus on technology differentiation, deploying immersion cooling, AI-optimized fabrics, and low-carbon certifications to capture premium customers.
YADRO’s in-house server production and Aquarius’ expansion into motherboard assembly illustrate vertical integration moves countering hardware embargo risks. Selectel and DataPro extend Tier 3 footprints into St. Petersburg and Krasnodar, providing national chains with geographic redundancy options. Because hyperscalers self-fund record capital programs while colocation incumbents hike rack rates to balance demand, the Russia data center market sustains healthy profitability despite supply-chain frictions.
Russia Data Center Industry Leaders
IXELERATE LLC
MTS PJSC (MTS Group)
Rostelecom
Selectel Ltd
Yandex.Cloud LLC
- *Disclaimer: Major Players sorted in no particular order


Recent Industry Developments
- May 2025: The Ministry of Digital Development issued full guidelines for classifying critical information infrastructure sites, elevating reliability benchmarks for telecom-aligned data centers.
- April 2025: The federal transformation program secured RUB 695 billion in appropriations for 2025-2027, embedding cloud-usage targets for regional governments.
- March 2025: Sector-wide telecom revenue reached RUB 2.1 trillion in 2024, driven by 11% growth in fixed broadband, underscoring the bandwidth demand-pull.
- January 2025: Nebius Group unveiled a USD 1 billion AI-compute rollout, signaling private commitment to sovereign large-language-model capabilities.


Russia Data Center Market Report Scope
Moscow are covered as segments by Hotspot. Large, Massive, Medium, Mega, Small are covered as segments by Data Center Size. Tier 1 and 2, Tier 3, Tier 4 are covered as segments by Tier Type. Non-Utilized, Utilized are covered as segments by Absorption.| Large |
| Massive |
| Medium |
| Mega |
| Small |
| Tier 1 and 2 |
| Tier 3 |
| Tier 4 |
| Hyperscale/Self-built | ||
| Enterprise/Edge | ||
| Colocation | Non-Utilised | |
| Utilised | Retail Colocation | |
| Wholesale Colocation | ||
| BFSI |
| IT and ITES |
| E-Commerce |
| Government |
| Manufacturing |
| Media and Entertainment |
| Telecom |
| Other End Users |
| Moscow |
| Rest of Russia |
| By Data Center Size | Large | ||
| Massive | |||
| Medium | |||
| Mega | |||
| Small | |||
| By Tier Type | Tier 1 and 2 | ||
| Tier 3 | |||
| Tier 4 | |||
| By Data Center Type | Hyperscale/Self-built | ||
| Enterprise/Edge | |||
| Colocation | Non-Utilised | ||
| Utilised | Retail Colocation | ||
| Wholesale Colocation | |||
| By End User | BFSI | ||
| IT and ITES | |||
| E-Commerce | |||
| Government | |||
| Manufacturing | |||
| Media and Entertainment | |||
| Telecom | |||
| Other End Users | |||
| By Hotspot | Moscow | ||
| Rest of Russia | |||


Market Definition
- IT LOAD CAPACITY - The IT load capacity or installed capacity, refers to the amount of energy consumed by servers and network equipments placed in a rack installed. It is measured in megawatt (MW).
- ABSORPTION RATE - It denotes the extend to which the data center capacity has been leased out. For instance, a 100 MW DC has leased out 75 MW, then absorption rate would be 75%. It is also referred as utilization rate and leased-out capacity.
- RAISED FLOOR SPACE - It is an elevated space build over the floor. This gap between the original floor and the elevated floor is used to accommodate wiring, cooling, and other data center equipment. This arrangement assist in having proper wiring and cooling infrastructure. It is measured in square feet (ft^2).
- DATA CENTER SIZE - Data Center Size is segmented based on the raised floor space allocated to the data center facilities. Mega DC - # of Racks must be more than 9000 or RFS (raised floor space) must be more than 225001 Sq. ft; Massive DC - # of Racks must be in between 9000 and 3001 or RFS must be in between 225000 Sq. ft and 75001 Sq. ft; Large DC - # of Racks must be in between 3000 and 801 or RFS must be in between 75000 Sq. ft and 20001 Sq. ft; Medium DC # of Racks must be in between 800 and 201 or RFS must be in between 20000 Sq. ft and 5001 Sq. ft; Small DC - # of Racks must be less than 200 or RFS must be less than 5000 Sq. ft.
- TIER TYPE - According to Uptime Institute the data centers are classified into four tiers based on the proficiencies of redundant equipment of the data center infrastructure. In this segment the data center are segmented as Tier 1,Tier 2, Tier 3 and Tier 4.
- COLOCATION TYPE - The segment is segregated into 3 categories namely Retail, Wholesale and Hyperscale Colocation service. The categorization is done based on the amount of IT load leased out to potential customers. Retail colocation service has leased capacity less than 250 kW; Wholesale colocation services has leased capacity between 251 kW and 4 MW and Hyperscale colocation services has leased capacity more than 4 MW.
- END CONSUMERS - The Data Center Market operates on a B2B basis. BFSI, Government, Cloud Operators, Media and Entertainment, E-Commerce, Telecom and Manufacturing are the major end-consumers in the market studied. The scope only includes colocation service operators catering to the increasing digitalization of the end-user industries.
| Keyword | Definition |
|---|---|
| Rack Unit | Generally referred as U or RU, it is the unit of measurement for the server unit housed in the racks in the data center. 1U is equal to 1.75 inches. |
| Rack Density | It defines the amount of power consumed by the equipment and server housed in a rack. It is measured in kilowatt (kW). This factor plays a critical role in data center design and, cooling and power planning. |
| IT Load Capacity | The IT load capacity or installed capacity, refers to the amount of energy consumed by servers and network equipment placed in a rack installed. It is measured in megawatt (MW). |
| Absorption Rate | It denotes how much of the data center capacity has been leased out. For instance, if a 100 MW DC has leased out 75 MW, then the absorption rate would be 75%. It is also referred to as utilization rate and leased-out capacity. |
| Raised Floor Space | It is an elevated space built over the floor. This gap between the original floor and the elevated floor is used to accommodate wiring, cooling, and other data center equipment. This arrangement assists in having proper wiring and cooling infrastructure. It is measured in square feet/meter. |
| Computer Room Air Conditioner (CRAC) | It is a device used to monitor and maintain the temperature, air circulation, and humidity inside the server room in the data center. |
| Aisle | It is the open space between the rows of racks. This open space is critical for maintaining the optimal temperature (20-25 °C) in the server room. There are primarily two aisles inside the server room, a hot aisle and a cold aisle. |
| Cold Aisle | It is the aisle wherein the front of the rack faces the aisle. Here, chilled air is directed into the aisle so that it can enter the front of the racks and maintain the temperature. |
| Hot Aisle | It is the aisle where the back of the racks faces the aisle. Here, the heat dissipated from the equipment’s in the rack is directed to the outlet vent of the CRAC. |
| Critical Load | It includes the servers and other computer equipment whose uptime is critical for data center operation. |
| Power Usage Effectiveness (PUE) | It is a metric which defines the efficiency of a data center. It is calculated by: (𝑇𝑜𝑡𝑎𝑙 𝐷𝑎𝑡𝑎 𝐶𝑒𝑛𝑡𝑒𝑟 𝐸𝑛𝑒𝑟𝑔𝑦 𝐶𝑜𝑛𝑠𝑢𝑚𝑝𝑡𝑖𝑜𝑛)/(𝑇𝑜𝑡𝑎𝑙 𝐼𝑇 𝐸𝑞𝑢𝑖𝑝𝑚𝑒𝑛𝑡 𝐸𝑛𝑒𝑟𝑔𝑦 𝐶𝑜𝑛𝑠𝑢𝑚𝑝𝑡𝑖𝑜𝑛). Further, a data center with a PUE of 1.2-1.5 is considered highly efficient, whereas, a data center with a PUE >2 is considered highly inefficient. |
| Redundancy | It is defined as a system design wherein additional component (UPS, generators, CRAC) is added so that in case of power outage, equipment failure, the IT equipment should not be affected. |
| Uninterruptible Power Supply (UPS) | It is a device that is connected in series with the utility power supply, storing energy in batteries such that the supply from UPS is continuous to IT equipment even during utility power is snapped. The UPS primarily supports the IT equipment only. |
| Generators | Just like UPS, generators are placed in the data center to ensure an uninterrupted power supply, avoiding downtime. Data center facilities have diesel generators and commonly, 48-hour diesel is stored in the facility to prevent disruption. |
| N | It denotes the tools and equipment required for a data center to function at full load. Only "N" indicates that there is no backup to the equipment in the event of any failure. |
| N+1 | Referred to as 'Need plus one', it denotes the additional equipment setup available to avoid downtime in case of failure. A data center is considered N+1 when there is one additional unit for every 4 components. For instance, if a data center has 4 UPS systems, then for to achieve N+1, an additional UPS system would be required. |
| 2N | It refers to fully redundant design wherein two independent power distribution system is deployed. Therefore, in the event of a complete failure of one distribution system, the other system will still supply power to the data center. |
| In-Row Cooling | It is the cooling design system installed between racks in a row where it draws warm air from the hot aisle and supplies cool air to the cold aisle, thereby maintaining the temperature. |
| Tier 1 | Tier classification determines the preparedness of a data center facility to sustain data center operation. A data center is classified as Tier 1 data center when it has a non-redundant (N) power component (UPS, generators), cooling components, and power distribution system (from utility power grids). The Tier 1 data center has an uptime of 99.67% and an annual downtime of <28.8 hours. |
| Tier 2 | A data center is classified as Tier 2 data center when it has a redundant power and cooling components (N+1) and a single non-redundant distribution system. Redundant components include extra generators, UPS, chillers, heat rejection equipment, and fuel tanks. The Tier 2 data center has an uptime of 99.74% and an annual downtime of <22 hours. |
| Tier 3 | A data center having redundant power and cooling components and multiple power distribution systems is referred to as a Tier 3 data center. The facility is resistant to planned (facility maintenance) and unplanned (power outage, cooling failure) disruption. The Tier 3 data center has an uptime of 99.98% and an annual downtime of <1.6 hours. |
| Tier 4 | It is the most tolerant type of data center. A Tier 4 data center has multiple, independent redundant power and cooling components and multiple power distribution paths. All IT equipment are dual powered, making them fault tolerant in case of any disruption, thereby ensuring interrupted operation. The Tier 4 data center has an uptime of 99.74% and an annual downtime of <26.3 minutes. |
| Small Data Center | Data center that has floor space area of ≤ 5,000 Sq. ft or the number of racks that can be installed is ≤ 200 is classified as a small data center. |
| Medium Data Center | Data center which has floor space area between 5,001-20,000 Sq. ft, or the number of racks that can be installed is between 201-800, is classified as a medium data center. |
| Large Data Center | Data center which has floor space area between 20,001-75,000 Sq. ft, or the number of racks that can be installed is between 801-3,000, is classified as a large data center. |
| Massive Data Center | Data center which has floor space area between 75,001-225,000 Sq. ft, or the number of racks that can be installed is between 3001-9,000, is classified as a massive data center. |
| Mega Data Center | Data center that has a floor space area of ≥ 225,001 Sq. ft or the number of racks that can be installed is ≥ 9001 is classified as a mega data center. |
| Retail Colocation | It refers to those customers who have a capacity requirement of 250 kW or less. These services are majorly opted by small and medium enterprises (SMEs). |
| Wholesale Colocation | It refers to those customers who have a capacity requirement between 250 kW to 4 MW. These services are majorly opted by medium to large enterprises. |
| Hyperscale Colocation | It refers to those customers who have a capacity requirement greater than 4 MW. The hyperscale demand primarily originates from large-scale cloud players, IT companies, BFSI, and OTT players (like Netflix, Hulu, and HBO+). |
| Mobile Data Speed | It is the mobile internet speed a user experiences via their smartphones. This speed is primarily dependent on the carrier technology being used in the smartphone. The carrier technologies available in the market are 2G, 3G, 4G, and 5G, where 2G provides the slowest speed while 5G is the fastest. |
| Fiber Connectivity Network | It is a network of optical fiber cables deployed across the country, connecting rural and urban regions with high-speed internet connection. It is measured in kilometer (km). |
| Data Traffic per Smartphone | It is a measure of average data consumption by a smartphone user in a month. It is measured in gigabyte (GB). |
| Broadband Data Speed | It is the internet speed that is supplied over the fixed cable connection. Commonly, copper cable and optic fiber cable are used in both residential and commercial use. Here, optic cable fiber provides faster internet speed than copper cable. |
| Submarine Cable | A submarine cable is a fiber optic cable laid down at two or more landing points. Through this cable, communication and internet connectivity between countries across the globe is established. These cables can transmit 100-200 terabits per second (Tbps) from one point to another. |
| Carbon Footprint | It is the measure of carbon dioxide generated during the regular operation of a data center. Since, coal, and oil & gas are the primary source of power generation, consumption of this power contributes to carbon emissions. Data center operators are incorporating renewable energy sources to curb the carbon footprint emerging in their facilities. |


Research Methodology
Mordor Intelligence follows a four-step methodology in all our reports.
- Step-1: Identify Key Variables: In order to build a robust forecasting methodology, the variables and factors identified in Step-1 are tested against available historical market numbers. Through an iterative process, the variables required for market forecast are set and the model is built on the basis of these variables.
- Step-2: Build a Market Model: Market-size estimations for the forecast years are in nominal terms. Inflation is not a part of the pricing, and the average selling price (ASP) is kept constant throughout the forecast period for each country.
- Step-3: Validate and Finalize: In this important step, all market numbers, variables and analyst calls are validated through an extensive network of primary research experts from the market studied. The respondents are selected across levels and functions to generate a holistic picture of the market studied.
- Step-4: Research Outputs: Syndicated Reports, Custom Consulting Assignments, Databases & Subscription Platforms


