Riding Gear Market Size and Share
Market Overview
| Study Period | 2019 - 2031 |
|---|---|
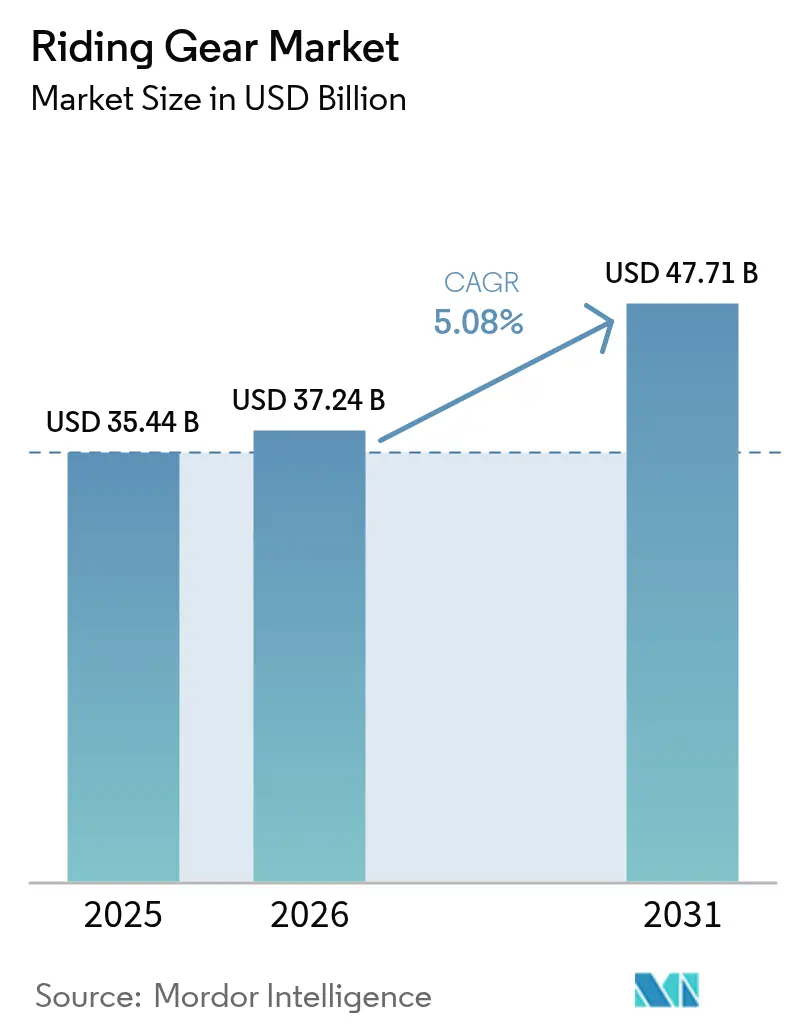
| Market Size (2026) | USD 37.24 Billion |
| Market Size (2031) | USD 47.71 Billion |
| Growth Rate (2026 - 2031) | 5.08% CAGR |
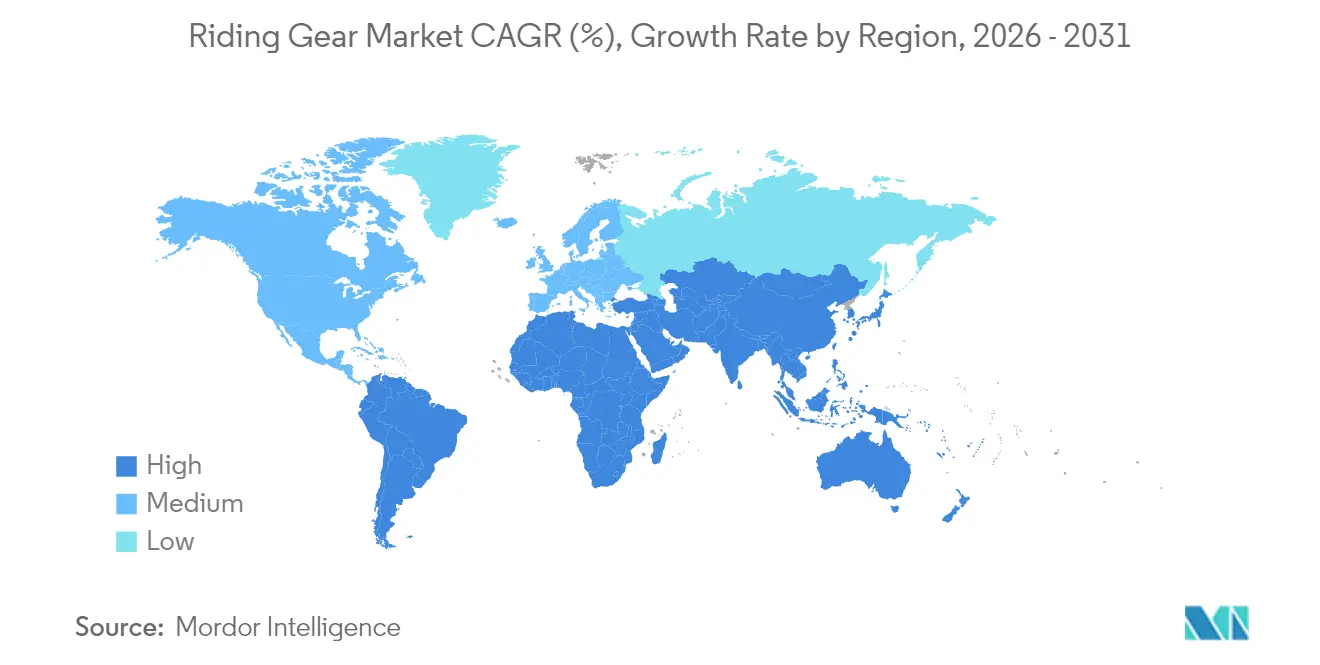
| Fastest Growing Market | Middle East and Africa |
| Largest Market | Asia-Pacific |
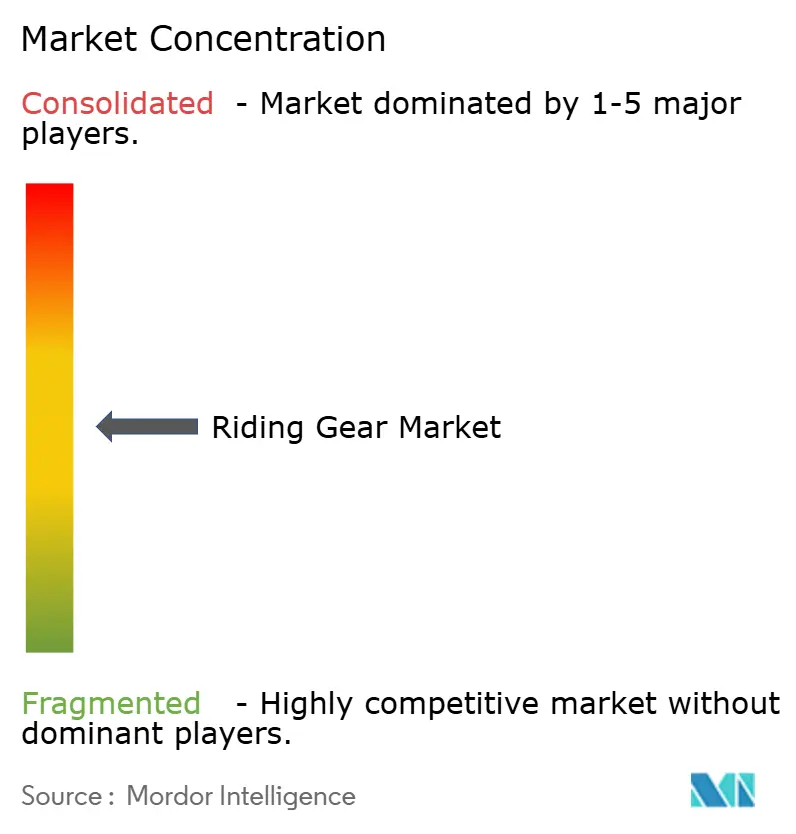
| Market Concentration | Medium |
Major Players
*Disclaimer: Major Players sorted in no particular order Image © Mordor Intelligence. Reuse requires attribution under CC BY 4.0. |
|
Riding Gear Market Analysis by Mordor Intelligence
The riding gear market size is projected to expand from USD 35.44 billion in 2025 and USD 37.24 billion in 2026 to USD 47.71 billion by 2031, registering a 5.08% CAGR between 2026 and 2031. A confluence of stricter safety mandates, rising two-wheeler ownership, and lifestyle branding by motorcycle OEMs is steering buyers toward higher-specification protective apparel. Active-safety features such as airbag vests, carbon-composite helmets, and heads-up visor displays are diffusing from professional racing into commuter wardrobes, aided by component miniaturization and price drops[1]“ECE 22.06 Motorcycle Helmet Regulation,” United Nations Economic Commission for Europe, unece.org. Online retail now offers virtual fitting, video consultations, and same-day delivery, eroding the long-held edge of brick-and-mortar specialists while broadening geographic reach. At the same time, vehicle brands treat gear as a profit center, using curated collections and bundled financing to court riders and non-riders alike, thereby deepening the riding gear market’s customer funnel.
Key Report Takeaways
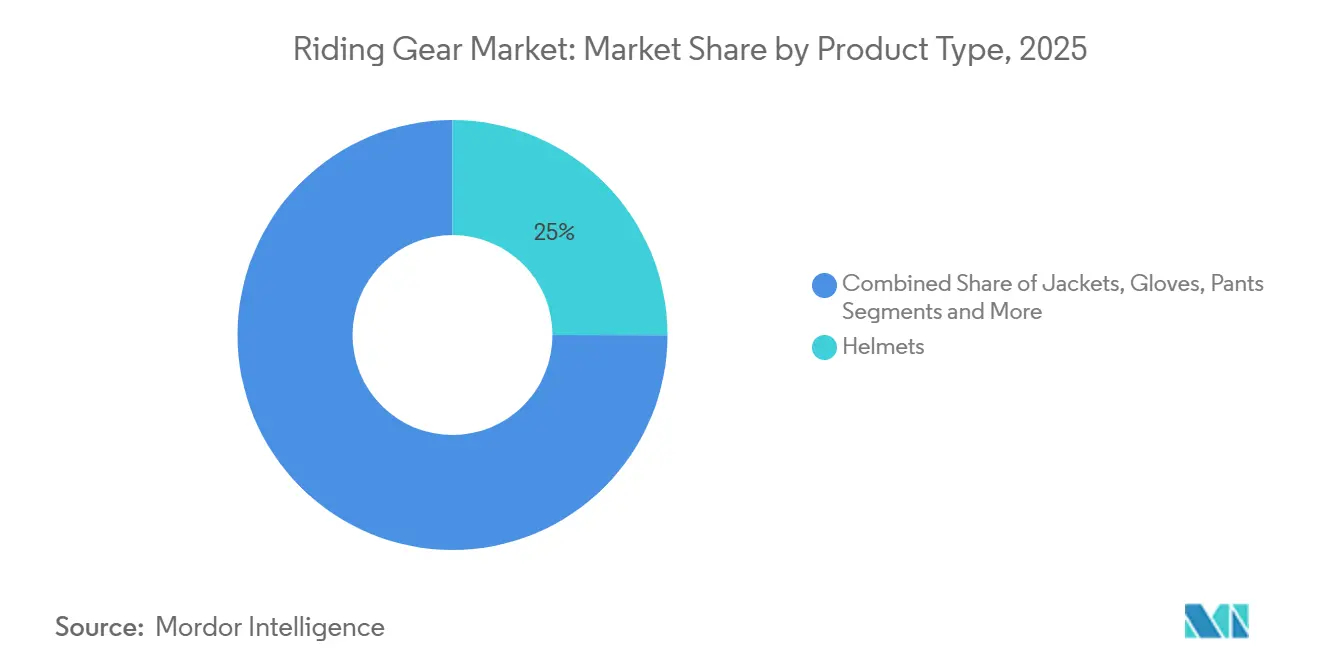
- By product type, helmets led the riding gear market with 25.01% market share in 2025, while airbag jackets and vests are advancing at a 5.44% CAGR through 2031.
- By material, leather captured 54.32% of the riding gear market in 2025; carbon-fiber composites are the fastest mover, with a 5.47% CAGR through 2031.
- By distribution channel, offline retail held 64.23% share of the riding gear market in 2025, yet online channels are expanding at a 5.51% CAGR through 2031.
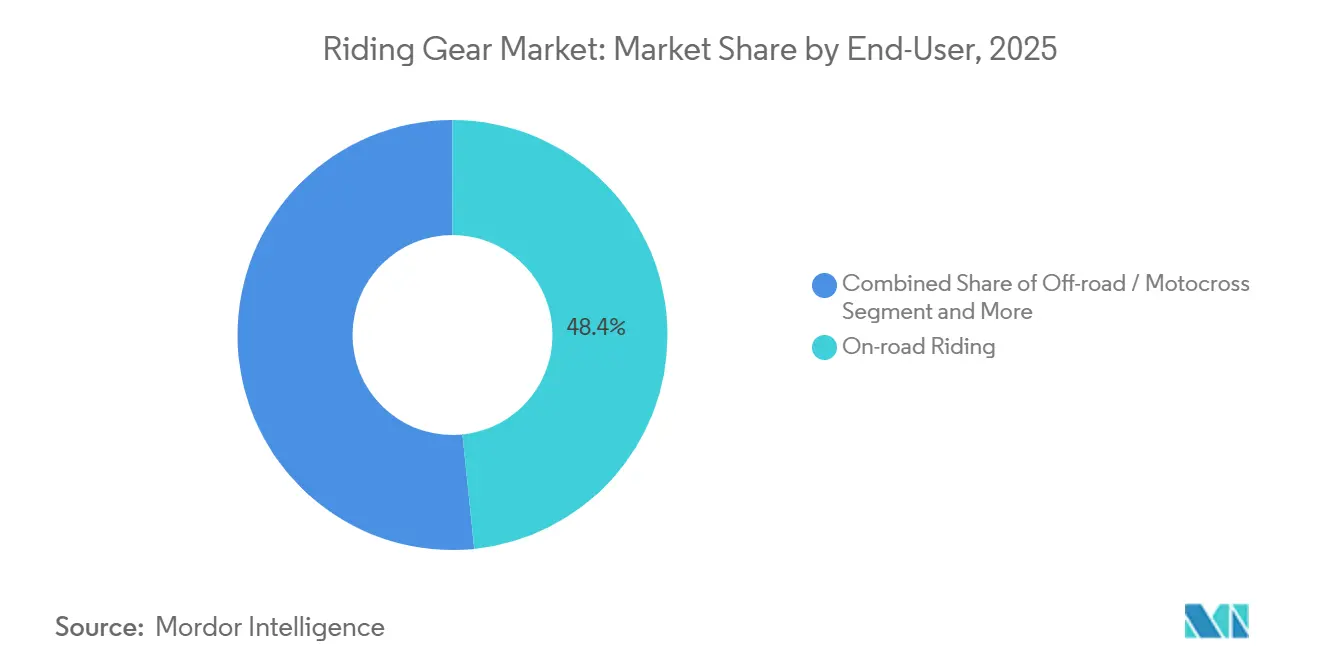
- By end-user, on-road riding accounted for 48.39% of the riding gear market revenue in 2025, whereas adventure-touring demand is growing at a 5.54% CAGR through 2031.
- By price range, mid-range items accounted for 44.71% of riding gear market sales in 2025, but premium gear is rising at a 5.57% CAGR during the forecast period.
- By geography, Asia-Pacific accounted for 39.21% of riding gear market sales in 2025; the Middle East and Africa region is set to post the fastest CAGR of 5.59% through 2031.
Note: Market size and forecast figures in this report are generated using Mordor Intelligence’s proprietary estimation framework, updated with the latest available data and insights as of 2026.
Global Riding Gear Market Trends and Insights
Drivers Impact Analysis*
| Driver | (~) % Impact on CAGR Forecast | Geographic Relevance | Impact Timeline |
|---|---|---|---|
| Rising Motorcycle Ownership | +1.2% | Asia-Pacific core, spill-over to South America | Medium term (2-4 years) |
| Safety Regulations | +1.1% | Global, led by Europe and North America | Short term (≤ 2 years) |
| Adventure-Touring and Long-Distance Riding | +0.9% | North America, Europe, Australia | Medium term (2-4 years) |
| Adoption of Airbag-Integrated Jackets | +0.7% | Europe, North America, Japan | Short term (≤ 2 years) |
| Lifestyle Merchandise Expansion | +0.6% | Global, early gains in India, United States, Europe | Medium term (2-4 years) |
| Growing Female Rider Segment | +0.4% | North America, Europe, urban Asia-Pacific | Long term (≥ 4 years) |
| Source: Mordor Intelligence | |||
Rising Motorcycle Ownership in Emerging Markets
Urbanization, income growth, and congested public transit systems are propelling millions of first-time riders in India, Indonesia, Thailand, and Vietnam to choose two-wheelers for daily mobility. As this installed base swells, each new vehicle purchase triggers follow-on demand for certified helmets, jackets, gloves, and boots that many governments now require at the point of registration. Motorcycle brands accelerate the cycle by adding retail capacity. Royal Enfield alone operates more than 900 dealerships across India, making it easier for novice riders to bundle protective gear with finance or insurance packages. Social-media communities further amplify safety messaging, normalizing protective apparel as an integral part of ownership rather than a discretionary add-on. The net effect is a self-reinforcing loop: higher motorcycle penetration expands the addressable apparel audience, and widespread gear visibility on city streets nudges successive cohorts to adopt certified products from their very first ride.
Stricter Global Safety Regulations Mandating Protective Gear
FIM’s FRHPhe-02 helmet protocol became compulsory for all sanctioned racing in 2026, creating a halo effect that pushes consumers to seek the same specification in street helmets[2]"More helmets - FIM homologated under FRHPhe-02", FIM, fim-moto.com. Europe’s ECE 22.06 regulation, which adds rotational-impact and retention testing, forces manufacturers to redesign shell geometries, liners, and visors, raising the technical baseline across product ranges[3]"A Guide to ECE 22.06: approval of motorcycle helmets and visors", Billyscrashhelmets, billyscrashhelmets.co.uk . Retailers increasingly stock only fully compliant models, using certification badges as quick visual assurances of quality. Small brands without in-house test labs now partner with independent facilities or risk delisting, a shift that consolidates share toward technically capable incumbents. Over the forecast horizon, converging standards will lower approval complexity for cross-border sales, further globalizing the riding gear market.
Boom In Adventure-Touring And Long-Distance Riding Culture
Adventure bikes capable of crossing continents on mixed terrain are spurring demand for modular jackets, waterproof pants, and multi-season boots that can transition from asphalt to gravel. Riders allocate larger budgets to gear because long-distance routes expose them to volatile weather and remote crash response times, making redundancy and durability more valuable. Manufacturers respond with laminated shells, quick-dry liners, and hydration-pouch integration that address comfort and safety equally. Motorcycle clubs and online forums document gear failures and successes in real expeditions, shaping peer-to-peer recommendations that accelerate adoption curves. The narrative of experience over horsepower keeps the riding gear market anchored in premium storytelling rather than mere utility.
Rapid Adoption of Airbag-Integrated Jackets After Price Drop
The average retail price of electronic airbag vests fell significantly in 2025, unlocking the mid-range commuter cohort that had been priced out of active-safety technology. Brands now offer subscription-free algorithms that deploy inflatable bladders within milliseconds of crash detection, removing hidden cost barriers. Early adopters share dramatic crash videos online, giving visceral proof of injury reduction and generating organic word-of-mouth marketing. Insurers in select European countries already extend premium discounts for certified airbag use, giving buyers a tangible payback period. These converging incentives embed airbag systems into rider checklists, stimulating recurring revenue for replacement canisters and firmware updates.
Restraints Impact Analysis*
| Restraint | (~) % Impact on CAGR Forecast | Geographic Relevance | Impact Timeline |
|---|---|---|---|
| Costly Premium Protective Gear | -0.7% | Global, most pronounced in price-sensitive markets | Long term (≥ 4 years) |
| Counterfeit CE-Marked Products | -0.5% | Global, concentrated in online channels | Medium term (2-4 years) |
| Seasonality Dampening | -0.3% | Northern Europe, North America, Northern Asia | Short term (≤ 2 years) |
| Sustainability Backlash | -0.2% | EU and North America primarily | Medium term (2-4 years) |
| Source: Mordor Intelligence | |||
High Cost Of Certified Premium Protective Gear
Top-tier laminated touring suits, carbon shells, and electronic airbag systems command prices that eclipse average monthly wages in many emerging economies. Although installment plans and micro-credit mitigate sticker shock, they also lengthen replacement cycles and amplify default risk. To bridge the gap, some brands introduce modular armor kits that retrofit into existing jackets, yet uptake remains niche. Currency volatility further complicates retail pricing, prompting distributors to hedge inventory costs and limit product breadth. Unless scale economies or material breakthroughs compress unit costs, price will stay a friction point that tempers the riding gear market’s full potential.
Proliferation Of Counterfeit Ce-Marked Products Eroding Trust
Fake certification stickers and knock-off helmets retail at deep discounts, eroding consumer trust in labeling systems. Enforcement agencies periodically seize shipments, but porous borders and online marketplaces keep the illicit supply alive. Legitimate brands invest in QR-code verification and blockchain traceability, which add overhead and require rider awareness to be effective. Some distributors conduct in-house drop tests to reassure customers, yet field checks remain rare. Until end-users can readily authenticate products, counterfeits will siphon volume and tarnish confidence across the riding gear market.
*Our forecasts treat driver/restraint impacts as directional, not additive. The impact forecasts reflect baseline growth, mix effects, and variable interactions.
Segment Analysis
By Product Type: Airbag Systems Enter the Mainstream
Helmets contributed 25.01% of the riding gear market share in 2025, confirming their status as non-negotiable safety basics, while airbag jackets and vests are growing at a 5.44% CAGR, reflecting a shift toward active protection. Brands pair electronic sensors with subscription-free algorithms, making airbags attractive to commuters and weekend tourers alike. Meanwhile, traditional jackets incorporate ventilated armor pockets and quick-detach liners that widen climate adaptability without electronic complexity. Gloves, boots, and standalone protectors round out full-body coverage, marketed as modular add-ons that upscale rider safety in stages.
Carbon-composite helmet shells integrate Bluetooth comms and tinted drop-down visors, aligning with rising demand for connectivity. Boots feature pivot hinges and toe sliders that originate in superbike racing, now repurposed for urban riding to improve walkability and crash resilience. Body armor inserts employ viscoelastic foams that harden on impact, offering stealth protection under casual outerwear. Collectively, these innovations reinvent familiar categories, sustaining the riding gear market through iterative value-add rather than wholesale upheaval.


By Material: Composites Challenge Leather
Leather captured 54.32% of the riding gear market in 2025, driven by abrasion performance and classic aesthetics, while carbon-fiber composites posted a 5.47% CAGR as weight reduction becomes a selling point for helmets and back plates. Multi-axial carbon weaves permit thinner shell profiles that dissipate energy without bulk, easing neck strain on long rides. Aramid-reinforced textiles and laminated membranes now achieve CE level-2 impact ratings, making them credible leather alternatives in humid and wet climates.
Mesh-panel hybrids push airflow farther, inviting riders in tropical zones into the protective gear fold. Eco-concerns spur interest in plant-based and recycled synthetics, though commercial volumes remain exploratory. Brands advertise waterless tanning and traceable hides to offset animal-welfare critiques. Carbon and aramid suppliers court OEM partnerships to secure scale, offering pre-preg sheets tailored to helmet molds and armor shapes. This material arms race fuels continuous differentiation, ensuring the riding gear market remains fertile ground for breakthroughs in textile science.
By Distribution Channel: E-Commerce Narrows the Fit Gap
Offline outlets retained a 64.23% share in 2025, supported by test-fit confidence and instant product hand-off, while online sales raced ahead at a 5.51% CAGR on the back of free returns and size-prediction software. Livestream demos, 360-degree product spins, and peer reviews digitally reproduce tactile cues, easing apprehension about helmet sizing and jacket sleeve length. Marketplace algorithms recommend complementary items, lifting average basket values and nudging shoppers toward premium upgrades. Direct-to-consumer brands bypass wholesale mark-ups, funneling savings into influencer campaigns and faster product refresh cycles.
Brick-and-mortar dealers adapt by hosting weekend ride clinics, maintenance workshops, and gear rental programs that convert footfall into loyalty. Many add click-and-collect counters to blend immediacy with the depth of online inventory. Specialist retailers stock size-break ranges in niche categories like petite women’s adventure suits or tall-sized sport leathers, keeping them indispensable to riders with atypical proportions. In aggregate, the omni-channel pivot intensifies competition and raises service expectations across the industry.
By End-User: Adventure Touring Outpaces Commuting
On-road commuters accounted for 48.39% of the riding gear market in 2025, yet adventure-touring riders are driving segment growth at a 5.54% CAGR as they outfit for cross-border expeditions. Multi-layer jackets with hydration pockets, magnetic map windows, and emergency beacon compartments cater to this appetite for self-sufficiency. Electrically heated gloves and socks extend riding seasons in high-latitude regions, improving comfort on dawn starts and mountain ascents. Dirt-oriented end-users seek ultra-vented jerseys and hard-shell knee braces that withstand repetitive impacts while permitting full articulation.
Track-day enthusiasts purchase one-piece leather suits with hump-mounted hydration and cut-proof seams, mirroring MotoGP aesthetics on amateur circuits. Urban scooter owners gravitate toward casually styled hoodies lined with Kevlar, blending streetwear with discreet protection. Each cohort imposes distinct demands, fracturing the riding gear market into micro-niches that vendors pursue through targeted SKUs and tailored marketing.
By Price Range: Premium Upshift Continues
Mid-range gear accounted for 44.71% of revenue in 2025, balancing certification with manageable outlays, while premium lines advanced at a 5.57% CAGR as affluent riders indulged in tech-laden apparel. Laminated shells bearing Gore-Tex or proprietary membranes promise all-season reliability, justifying their elevated price tags with extended warranties and crash-replacement policies. Entry-level ranges face squeeze from counterfeit competition, prompting reputable brands to bundle accessories or loyalty points to defend volume.
Financing options and trade-in credits extend affluent buying power, steering repeat customers into the top tier. Limited-edition collaborations, race replica liveries, heritage collections, and celebrity signatures, inject scarcity value that commands instant sell-outs. Subscription models emerge for airbag canister refills and firmware upgrades, shifting revenue from one-time sales to recurring streams. The result is a stratified riding gear market where premiumization unlocks margin resilience even as volumes plateau in mature geographies.
Geography Analysis
Asia-Pacific accounted for 39.21% of the riding gear market share in 2025, underpinned by high two-wheeler ownership in India, Indonesia, and Thailand. Governments intensify helmet enforcement and explore subsidies for certified products, nudging first-time buyers toward regulated gear. Domestic manufacturers scale up automated molding and robotic stitching to serve both local demand and export contracts, reinforcing regional cost advantages. Meanwhile, China’s electric scooter boom fuels appetite for lightweight, urban-flavored helmets and waterproof commuter jackets, broadening the region’s material palette.
Europe and North America together represent a mature yet lucrative arena for high-feature gear because discretionary incomes and stringent safety standards converge. ECE 22.06 and DOT labeling make certification table stakes, pushing innovation into ventilation, acoustics, and integration of communication modules. Touring culture, track-day hobbyists, and year-round commuters sustain multiple sub-segments, each craving specialized performance attributes. Dealer consolidation in both regions gives larger chains buying leverage, pressuring smaller brands to differentiate through online storytelling or bespoke sizing services. Currency fluctuations between USD and EUR slightly reshape import cost dynamics but leave underlying demand intact.
The Middle East and Africa region posts the quickest 5.59% CAGR as urbanization, infrastructure build-out, and rising disposable incomes lift motorcycle purchases from a low base. Gulf Cooperation Council countries tighten helmet mandates with on-the-spot fines, stimulating sales of certified helmets among expatriate workers and young nationals alike. Local climates, ranging from desert heat to coastal humidity, spur demand for ventilated textiles and moisture-wicking liners. Counterfeit detection remains uneven, but public awareness campaigns are beginning to shift preferences toward authorized outlets. As distributors add micro-financing and e-commerce to reach remote customers, the riding gear market unlocks substantial latent volume across the region.

Regulatory Landscape
Safety and conformity requirements remain a primary market shaper, with helmet compliance anchored by UNECE Regulation No. 22 (including the 06 series used across many non-EU markets) and the United States FMVSS No. 218 (49 CFR 571.218) administered by the National Highway Traffic Safety Administration. In the European Union, riding gear sits under the Personal Protective Equipment framework of Regulation (EU) 2016/425, while motorcycle protective garments are standardized through the EN 17092 series, which influences certification claims and retail assortment decisions.
Alongside product safety rules, trade-policy actions in 2026 introduced additional planning complexity for imported riding apparel and helmets. In April 2026, the US Section 232 automobile parts tariff inclusions process opened a submission window (April 1 to April 14, 2026), giving stakeholders a defined route to request adjustments to existing duties. In July 2026, the Motorcycle Industry Council filed comments tied to Section 301 tariff investigations that raised concerns about potential duties impacting Vietnam-origin riding apparel and helmets, reinforcing the need for importers to manage sourcing options and landed-cost volatility.
Value Chain Analysis
The riding gear value chain begins with raw material inputs (leather, aramid blends, technical textiles, carbon-fiber composites) and specialized components such as viscoelastic impact protectors and armor systems. Design and engineering, prototyping, and certification testing form a critical midstream layer, since compliance with helmet and PPE standards determines market access. As a result, the role of third-party test labs and validation partners has expanded. Assembly is executed through a mix of in-house facilities and contracted manufacturing, followed by branding and packaging, with go-to-market supported by offline specialists, OEM dealerships, and fast-growing online channels that offer fit tools and return logistics.
Recent actions show how leading brands are reinforcing technical capability and material innovation within the chain. Alpinestars announced a technical collaboration with RINA in November 2025 to strengthen product validation and standards compliance, and RST Moto partnered with D3O for impact-armor integration in its 2026 collection, highlighting the contribution of component suppliers and tested protection systems to premium differentiation. On the risk side, logistics and trade disruptions remain material. In October 2024, the Motorcycle Industry Council warned about dockworker strike risk that could pressure powersports supply chains, prompting brands and distributors to diversify sourcing, increase buffer stock for seasonal demand, and rebalance production footprints to reduce single-lane dependency.
Competitive Landscape
In the riding gear market, no brand commands a double-digit global share. Yet, established players like Alpinestars, Fox Racing, Klim, AGVSport, and Rynox capitalize on athlete sponsorships and proprietary safety systems to maintain visibility. By investing in in-house crash rigs and climate chambers, they expedite compliance with evolving FIM and ECE protocols, safeguarding their margins from the costs of third-party testing. This technical expertise earns them prime shelf space, as retailers prioritize fully certified products. Meanwhile, smaller brands respond with nimble product drops, influencer collaborations, and tailored collections that resonate with local markets, ensuring industry diversity.
In January 2026, Dainese raised EUR 30 million (~USD 32 million) in new equity and successfully restructured its EUR 190 million (~USD 202 million) in liabilities, demonstrating its commitment to financial stability. The infusion underscores private-equity confidence in premium gear’s runway and signals that scale can amplify R&D returns. Concurrently, Royal Enfield’s apparel division doubled revenue in 2025, confirming lifestyle branding as a viable vector for OEM diversification. This encroachment by vehicle makers raises the competitive bar, forcing pure-play gear specialists to out-innovate on technical fronts.
Technology convergence now differentiates front-runners: Shoei’s heads-up-display helmet captures telemetry while integrating seamlessly with smartphone navigation; Klim’s modular armor retrofits extend garment life cycles, appealing to sustainability-minded riders. Brands pilot QR-coded authenticity tags to curb counterfeits, yet success hinges on retailer participation and consumer diligence. White-space opportunities persist in women-specific sizing, heated urban gloves, and biodegradable shell materials, areas where nimble entrants can chip away at mid-tier incumbents. Collectively, strategic partnerships, R&D intensity, and lifestyle storytelling steer the riding gear market toward a dynamic yet moderately consolidated future.
Riding Gear Industry Leaders
-
AGV
-
Fox Racing Inc.
-
Alpinestars SPA
-
Klim Technical Riding Gear
-
Rynox Gears India Pvt. Ltd.
- *Disclaimer: Major Players sorted in no particular order

Market Opportunities and Future Outlook
Standardization and certification are strengthening an upgrade cycle that benefits technically capable brands and retailers that can communicate compliance. The EU PPE framework (Regulation (EU) 2016/425) and garment standards such as EN 17092 push manufacturers toward documented performance claims. Racing-driven specifications also feed consumer demand for higher-rated helmets, including FIM making its FRHPhe-02 helmet protocol compulsory for sanctioned racing in 2026. Within this context, the report points to opportunities in compliant product refreshes (helmets and protective garments) and in services that reduce purchase friction, including online fit assistance and authenticity verification in response to counterfeit CE-marked products.
Active-safety and connected protection remain a tangible whitespace area as pricing and modularity improve, and the report identifies airbag jackets and vests as the fastest-growing product segment within its scope. Brands are already commercializing modular protection systems and specialized collections, including Klim introducing the Rogue armor system for 2026 apparel with backward compatibility, alongside multiple 2026 model-year gear launches aimed at specific riding styles such as off-road and sport-touring. OEM-linked lifestyle merchandise expansion, highlighted by Royal Enfield scaling gear attachment through its dealership footprint, also creates additional shelf space for bundled, certified riding gear at the point of motorcycle purchase, particularly in high two-wheeler penetration markets in Asia-Pacific.
Recent Industry Developments
- July 2026: Alpinestars released the limited-edition Unity collection, spanning Techstar gear, Tech 7 boots, and Supertech goggles. The release reinforces how brand-led capsules help maintain premium positioning while staying aligned with rider communities that influence broader buying trends.
- May 2026: AGV released the K7 full-face sport-touring helmet with three outer shell sizes and an integrated spoiler and ventilation system. The launch targets riders trading up for comfort and aerodynamic performance in a mainstream touring use case, supporting higher-spec helmet mix within the category.
- December 2025: SMK Helmets expanded its premium lineup in India with new helmet models and a full range of CE-certified riding jackets. The expansion broadens access to certified gear in a high-volume two-wheeler market and increases competitive intensity across mid-range to premium price tiers at retail.


Research Methodology Framework and Report Scope
Market Definition and Coverage
This market tracks the value of riding gear bought for rider safety, comfort, and riding use, including helmets, jackets, gloves, pants, footwear, and protective add-ons across key riding styles and sales channels.
Scope exclusions: We do not count vehicle sales, fuel, routine vehicle maintenance parts, or general fashion apparel that is not designed and marketed for riding use.
Segmentation Overview
-
By Product Type
- Jackets
- Helmets
- Gloves
- Pants / Trousers
- Boots / Shoes
- Body Armor & Protectors
- Airbag Jackets & Vests
-
By Material
- Leather
- Textile
- Mesh
- Carbon-Fiber Composites
- Kevlar / Aramid Blends
- Other Materials
-
By Distribution Channel
- Online
- Offline
-
By End-user
- On-road Riding
- Off-road / Motocross
- Adventure & Touring
- Commuter
-
By Price Range
- Premium
- Mid-range
- Economy
-
By Geography
-
North America
- United States
- Canada
- Rest of North America
-
South America
- Brazil
- Argentina
- Rest of South America
-
Europe
- Germany
- United Kingdom
- France
- Italy
- Spain
- Russia
- Rest of Europe
-
Asia-Pacific
- China
- Japan
- India
- South Korea
- Rest of Asia-Pacific
-
Middle East and Africa
- United Arab Emirates
- Saudi Arabia
- Turkey
- Egypt
- South Africa
- Rest of Middle East and Africa
-
North America
Data Sources, Market Sizing, and Validation
Desk Research
Desk work started with mapping the product boundary and the safety standards that shape what is actually counted as riding gear, then anchored demand signals by region. We leaned on public sources such as road safety and crash statistics from agencies like NHTSA and the WHO, transport and vehicle parc indicators from sources such as OICA, and trade and customs statistics via UN Comtrade where relevant for helmets and apparel movements.
To keep pricing and mix realistic, we also reviewed materials and protective-technology references from open standards bodies and technical publications, along with brand and retailer disclosures like annual reports, investor presentations, and product catalogs. In parallel, paid subscriptions we already maintain for company financial intelligence, patent lookups, and shipment-level trade visibility were used selectively to cross-check direction and fill gaps where public data was thin. These desk sources are illustrative only, and many other public documents and datasets were also used for collection, validation, and clarification.
Primary Interviews and Surveys
Primary work was used to pressure-test what sells in volume versus what stays niche, and to confirm how prices move when certification levels, materials, and airbag adoption change. We spoke with a mix of manufacturers, distributors, retailers, and service or certification-side experts across major riding regions, so assumptions from desk research could be corrected before finalizing the model.
Distribution of primary research fieldwork respondents
| Company type | Respondent position | Region |
|---|---|---|
| Top tier: 30% | CXOs: 16% | APAC: 38% |
| Mid tier: 52% | Functional/Unit leaders: 35% | EMEA: 35% |
| Smaller Players: 18% | Managers: 49% | Americas: 27% |
Market-Sizing & Forecasting
The sizing logic was built using a top-down demand pool, where two-wheeler parc and active rider base by region are translated into likely annual gear purchase cycles, then valued using price bands by gear category. That spine was checked with selective bottom-up approximations, such as rolling up a sample of supplier and channel revenues where disclosures were available, and sanity-checking unit volumes using typical helmet and apparel replacement behavior.
Key inputs that moved the model in a visible way included two-wheeler ownership and usage intensity, enforcement and adoption of safety standards for helmets and protective apparel, mix shift between on-road and off-road riding, the online versus offline share (which affects discounting), and the penetration of higher value protection like body armor and airbag vests. When a country had weak visibility on any one input, proxy indicators like import trends, retail assortment depth, and expert-validated pricing ladders were used to close gaps in a consistent manner.
For forecasting, we used scenario analysis supported by multivariate regression on demand drivers, then applied expert-agreed guardrails on price inflation and premiumization so growth does not run ahead of what distribution and compliance can realistically support.
Data Validation & Update Cycle
Outputs were validated through multiple checks so the numbers stay connected to real-world signals. First, we compared category totals against independent indicators like helmet compliance levels, two-wheeler parc growth, and channel mix shifts, then investigated any sharp jumps that did not match these demand markers.
Before sign-off, assumptions and formulas were reviewed in steps, and call-backs were triggered when interview feedback diverged materially by region or gear type. The report is refreshed once a year, and interim updates are made when material events happen, such as major safety rule changes, supply disruptions, or pricing shocks. Right before delivery, a final review pass is completed so clients receive the latest consistent view.
Mordor Intelligence's Riding Gear Market Estimate Compared With Other Published Estimates
It is normal to see different market sizes for riding gear because each publisher draws the boundary in its own way, picks a different base year, and uses a different pricing and mix logic. Even when the product list looks similar, differences in what counts as riding gear versus adjacent apparel, and how online discounting is treated, can create a wide spread.
By tracking purchase-cycle assumptions, certification-led mix shifts, and currency timing, Mordor Intelligence keeps the estimate tied to rider demand signals and avoids counting non-riding lifestyle apparel that is not built for protection.
Benchmark comparison
| Source | Market Size | Gaps in Research Methodology |
|---|---|---|
| Mordor Intelligence | USD 37.24 B (2026) | |
| Global Advisory Firm A | USD 13.18 B (2024) | Uses a narrower motorbike riding gear boundary and an earlier base year, and it appears to treat several apparel categories and price bands differently, which compresses the total versus a broader riding gear basket. |
| Industry Publisher B | USD 8.12 B (2024) | Relies on a tighter scope and more conservative pricing progression, and it may not fully capture premium protection add-ons and value growth from higher-spec materials across regions. |
Across the three numbers, the main pattern is that scope and pricing logic drive most of the gap, followed by base year selection. A model that separates protective riding-intended products from adjacent apparel, and applies region-specific mix and channel effects, tends to produce a steadier total that can be re-checked as assumptions change.


Key Questions Answered in the Report
What is the projected growth rate for the riding gear market through 2031?
It is forecasted to progress at a 5.08% CAGR from 2026 to 2031.
Which product category dominates market revenue in 2025?
Helmets lead, holding 25.01% share in 2025.
Which product segment is growing the fastest?
Airbag jackets and vests record the quickest 5.44% CAGR through 2031.
Why are carbon-fiber composites gaining ground?
They deliver lighter shells without sacrificing impact resistance, reducing rider fatigue.
Which region shows the steepest future growth?
The Middle East and Africa post the highest projected CAGR at 5.59% through 2031.
Page last updated on:


