Residential Washing Machine Market Size and Share
Market Overview
| Study Period | 2020 - 2031 |
|---|---|
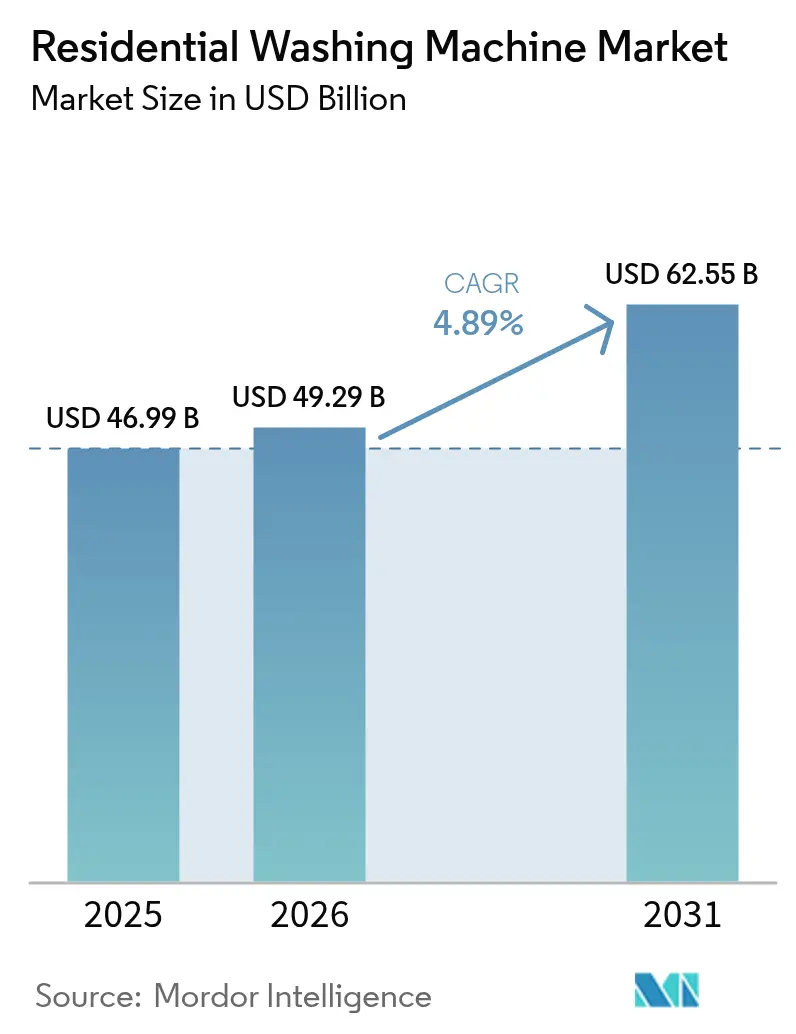
| Market Size (2026) | USD 49.29 Billion |
| Market Size (2031) | USD 62.55 Billion |
| Growth Rate (2026 - 2031) | 4.89% CAGR |
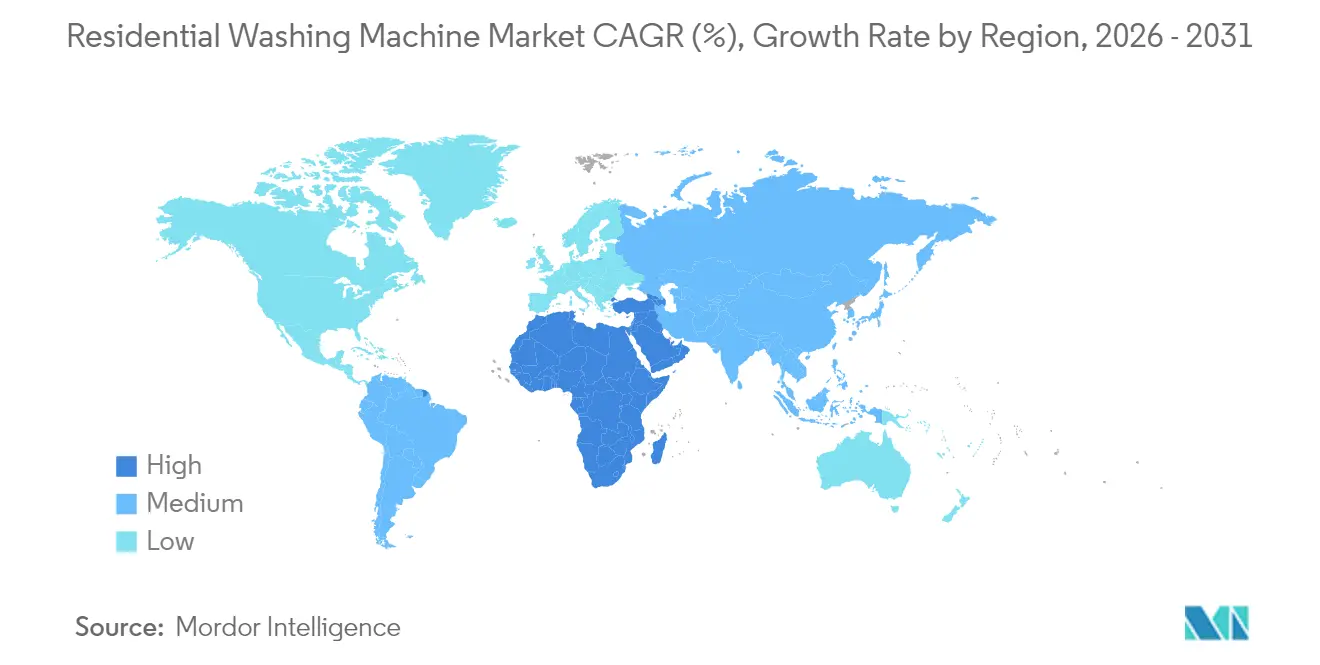
| Fastest Growing Market | Middle East and Africa |
| Largest Market | Asia Pacific |
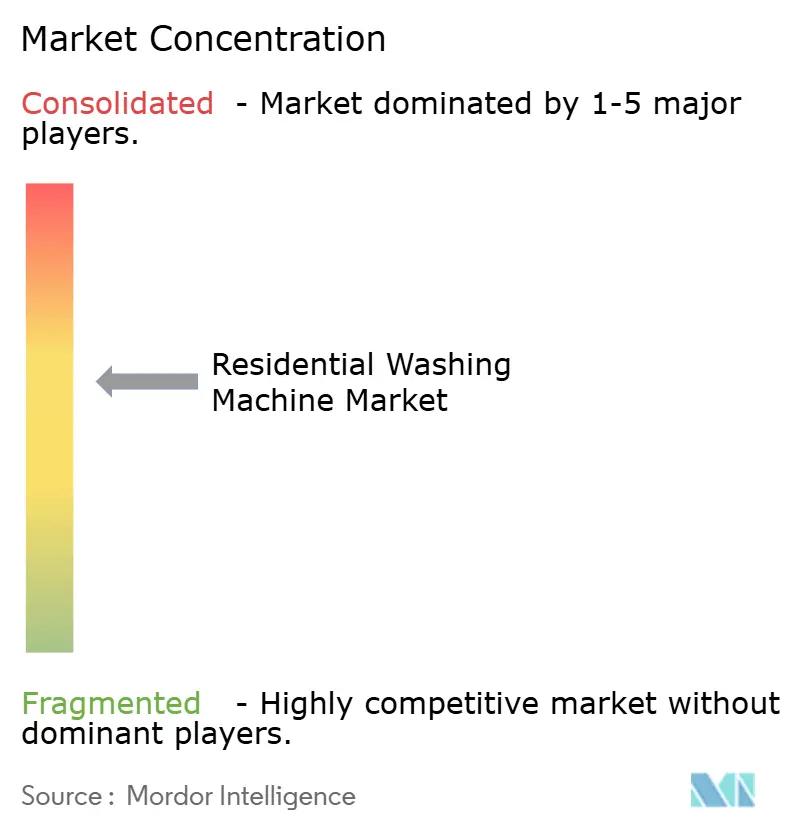
| Market Concentration | Medium |
Major Players *Disclaimer: Major Players sorted in no particular order Image © Mordor Intelligence. Reuse requires attribution under CC BY 4.0. | |
Residential Washing Machine Market Analysis by Mordor Intelligence
residential washing machine market size in 2026 is estimated at USD 49.29 billion, growing from 2025 value of USD 46.99 billion with 2031 projections showing USD 62.55 billion, growing at 4.89% CAGR over 2026-2031. Expansion rests on rapid urbanization, stricter energy-efficiency rules, and rising smart-home adoption. Consumers now rank artificial intelligence, IoT connectivity, and predictive maintenance ahead of basic drum size or spin speed. In response, manufacturers shorten replacement cycles with software-driven upgrades that enrich functionality well before depreciation ends. Success, therefore, hinges on blending hardware scale with software ecosystems that keep users engaged—an evolution already reshaping competitive strategy across the residential washing machine market[1]U.S. Department of Energy, “DOE Finalizes New Efficiency Standards for Residential Clothes Washers,” energy.gov.
Key Report Takeaways
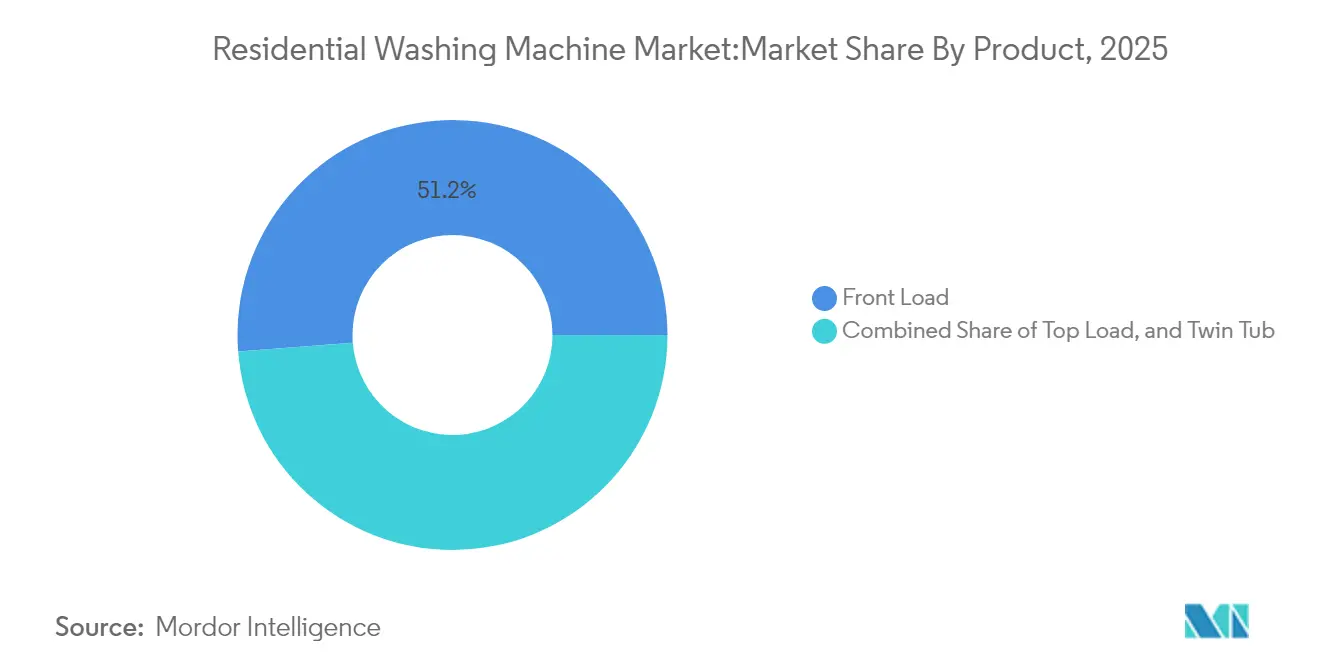
- By product type, front-load machines led with 51.23% revenue share of the residential washing machine market in 2025 and are advancing at a 5.72% CAGR through 2031.
- By technology, fully automatic units captured 72.30% of the residential washing machine market share in 2025, while smart-connected models posted the fastest 8.45% CAGR to 2031.
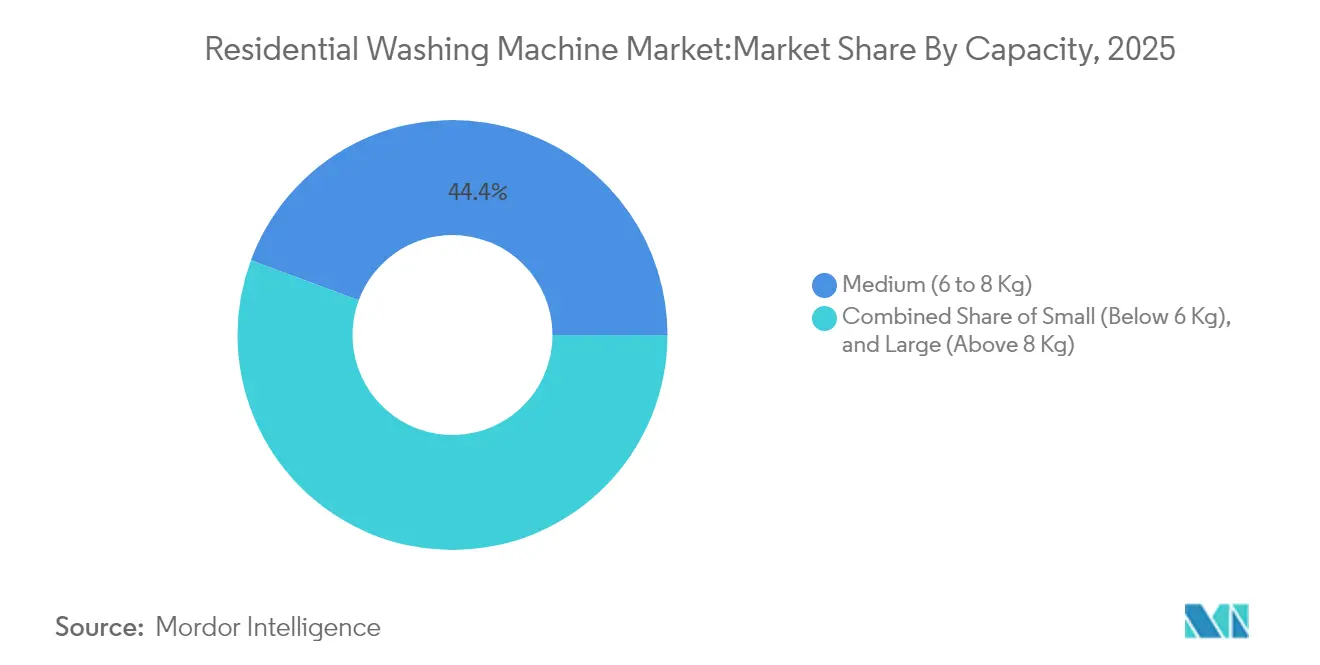
- By capacity, medium models (6–8 kg) accounted for 44.35% share of the residential washing machine market size in 2025; large-capacity units (above 8 kg) are growing fastest at a 6.18% CAGR.
- By connectivity, conventional machines still hold 77.20% share of the residential washing machine market, but smart units are expanding most rapidly.
- By region, Asia-Pacific dominated with 45.60% share of the residential washing machine market in 2025, whereas the Middle East & Africa records the strongest 6.44% CAGR to 2031.
Note: Market size and forecast figures in this report are generated using Mordor Intelligence’s proprietary estimation framework, updated with the latest available data and insights as of 2026.
Global Residential Washing Machine Market Trends and Insights
Drivers Impact Analysis*
| Driver | % Impact on CAGR Forecast | Geographic Relevance | Impact Timeline |
|---|---|---|---|
| Urbanization-driven demand surge | +1.2% | APAC core, spill-over to MEA | Medium term (2-4 years) |
| Rising disposable income & convenience focus | +0.9% | Global, concentrated in emerging markets | Long term (≥ 4 years) |
| Energy-efficient & smart appliance preference | +1.1% | North America & EU, expanding to APAC | Short term (≤ 2 years) |
| Compact all-in-one washer–dryer adoption | +0.7% | Urban centers globally | Medium term (2-4 years) |
| Government energy-rebate replacement programs | +0.6% | North America, EU, select APAC | Short term (≤ 2 years) |
| Source: Mordor Intelligence | |||
Urbanization-Driven Demand Surge
Rapid city growth concentrates new households in high-rise apartments, where shared laundry rooms cannot scale. Chinese factories produced 79.9 million units in 2024, 16.4% higher year-over-year, while domestic sales reached 40.1 million units as first-time urban buyers entered the market [2]China Household Electrical Appliances Association, “2024 Production and Sales Data,” cheaa.org. Apartment residents pay premiums for low-noise motors, slim depths, and stackability, accelerating premiumization across the residential washing machine market. Front-load designs thrive because they fit tight spaces and enable vertical stacking with heat-pump dryers. Local governments that restrict balcony drying further boost demand for high-spin machines that shorten indoor drying time. As a result, compact but feature-rich models capture rising wallet share among new city dwellers.
Rising Disposable Income & Convenience Focus
Middle-class expansion shifts preferences from basic spin-dryers to feature-rich models with AI cycles, Wi-Fi alerts, and fabric-care analytics. Larger drums that handle weekly loads reduce time spent on chores, meeting the lifestyle expectations of dual-income households. Manufacturers, therefore, introduce tiered line-ups to capture broader consumer surplus and drive margin growth inside the residential washing machine market. World Bank data confirm sustained disposable-income growth in emerging economies, lifting demand for premium appliances that were formerly considered luxuries [3]World Bank, “MENA Economic Update 2025,” worldbank.org. Brand prestige also matters more, with consumers equating smart dashboards and brushed-steel finishes with social status. Manufacturers capture surplus through tiered line-ups that migrate successful flagship features down to mid-price ranges while keeping margins intact.
Energy-Efficient & Smart Appliance Preference
The U.S. Department of Energy’s March 2028 standard removes low-efficiency models from stores, forcing all suppliers to meet tougher performance baselines. Consumers already sensitive to utility bills now scan Eco-labels in-store or online before purchasing. Samsung’s Bespoke AI Laundry line adjusts water, spin, and detergent dosing in real time and sends energy dashboards to phones, turning efficiency into a daily engagement hook. European utilities layer time-of-use tariffs onto bills, incentivizing smart washers that auto-schedule overnight cycles for lower rates. These dynamics elevate connected models from niche gadgets to mainstream expectations inside the residential washing machine market.
Compact All-In-One Washer–Dryer Adoption
Rising real-estate prices mean less floor area per household, making single-cabinet washer-dryer combos appealing. Samsung’s 25 kg wash/13 kg dry Bespoke unit and LG’s WashCombo illustrate how heat-pump drying closes the performance gap with separate machines. Rental landlords like the plug-and-play nature of one water inlet and one 230 V socket, cutting installation costs. Users appreciate load-to-dry convenience, especially where balcony drying is banned. Advances in humidity sensors and drum insulation lower cycle times, addressing historic concerns about combo efficiency. The segment, therefore, attracts both first-time buyers and downsizers who replace two older units with a single premium appliance.
Restraints Impact Analysis*
| Restraint | % Impact on CAGR Forecast | Geographic Relevance | Impact Timeline |
|---|---|---|---|
| Supply-chain & geopolitical disruptions | -0.8% | Global, concentrated in Asia-Pacific manufacturing | Short term (≤ 2 years) |
| High energy-consumption sustainability backlash | -0.4% | EU & North America, expanding globally | Medium term (2-4 years) |
| On-demand laundry service cannibalisation | -0.3% | Urban centers in developed markets | Long term (≥ 4 years) |
| Source: Mordor Intelligence | |||
Supply-Chain & Geopolitical Disruptions
A 2024 quartz-mine shutdown in North Carolina squeezed semiconductor output, delaying smart-board deliveries that premium washers rely on [4]CNBC, “Quartz Shortage Threatens Chip Supply,” cnbc.com. Red Sea freight rerouting added two weeks to Asia-Europe transits and raised container rates, eroding appliance margins. Political tensions in the South China Sea amplify risk, as roughly one-third of machine components sail through contested waters. Manufacturers respond with multi-sourcing and buffer inventory, but the extra working capital burdens balance sheets. Persistent logistics volatility may also deter aggressive promotional campaigns if companies fear stock-outs during peak seasons.
High Energy-Consumption Sustainability Backlash
Studies show laundry still ranks among the top household energy uses even after efficiency gains. European shoppers increasingly question XXL drums and expect true cold-wash performance without detergent residue. MDPI research shows a willingness to pay premiums for recycled plastics and plant-based surfactants, yet zero tolerance for poorer stain removal. Brands must therefore balance eco-claims with transparent performance data or risk accusations of greenwashing. Negative press around high-energy dryers can spill over onto washer-dryer combos, slowing adoption in sustainability-conscious segments.
*Our forecasts treat driver/restraint impacts as directional, not additive. The impact forecasts reflect baseline growth, mix effects, and variable interactions.
Segment Analysis
By Product: Front-Load Dominance Accelerates
Front-load washers held 51.23% share of the residential washing machine market in 2025 and advanced at a 5.72% CAGR. Their gentler wash action, water savings, and stackability appeal to dense-housing residents. Samsung’s AI-enabled front loaders illustrate how premium software offsets higher prices.
Top-load designs remain popular in rural settings where lower upfront cost and quick-open lids matter, but their unit share gradually declines. Consequently, the residential washing machine market size tied to front-load units remains the largest contributor to global revenue through 2031.


By Technology: Automation Premium Persists
Fully automatic machines captured 72.30% of the residential washing machine market in 2025 and grew at a 5.12% CAGR. LG’s AI Wash adapts drum motion without user input. Remote alerts, auto-dose canisters, and voice control reinforce value perception.
Semi-automatic designs still appeal where the electricity supply is intermittent or budgets are tight. However, narrowing price gaps and growing consumer awareness of fabric protection keep funneling volume toward automatic platforms. Consequently, the residential washing machine market size linked to fully automatic units should widen its revenue gap over semi-automatic alternatives during the forecast horizon.
By Capacity: Large-Format Growth Accelerates
Medium drums (6–8 kg) delivered 44.35% of 2025 revenue, but large units (above 8 kg) record the highest 6.18% CAGR as multigenerational households seek single-load convenience.
Bigger drums accommodate comforters and bulk linens, reducing weekly cycles and energy per kilogram. Manufacturers reinforce durability with reinforced bearings and targeted stain-removal programs. This innovation keeps the residential washing machine market share for high-capacity products on an upward trajectory despite higher price points.
By Connectivity: Smart Integration Drives Premium Growth
Conventional units still represent 77.20% of shipments, though smart models expand at 8.45% CAGR. GE Appliances’ SmartHQ app adds predictive maintenance and detergent alerts, extending interaction beyond purchase.
Smart ecosystems lock customers into cloud services and parts subscriptions, lifting lifetime value. As broadband penetration climbs, connectivity will underpin more SKUs, signifying that the residential washing machine market size linked to connected models will become an outsized contributor to profit pools even if unit share remains lower than legacy products in the medium term.
By Distribution Channel: Digital Transformation Accelerates
Multi-brand stores retained a 49.30% share because shoppers prefer on-site demos for big-ticket items. Yet online sales advance at 7.32% CAGR, helped by immersive AR visuals and white-glove last-mile delivery. Exclusive brand outlets support curated experiences and warranty tie-ins.
Omnichannel strategies, therefore, shape the residential washing machine market as brands mix physical showrooms with direct-to-consumer platforms to capture incremental margin, gather usage data, and upsell accessories.

Geography Analysis
Asia-Pacific owns 45.60% of the residential washing machine market and remains the global production hub. Chinese output reached 79.958 million units in 2024 as exports rebounded to Belt and Road Initiative partners. Manufacturing density offers cost leadership but exposes producers to shipping-route volatility.
The Middle East & Africa posts the highest 6.44% CAGR thanks to urbanization, infrastructure upgrades, and disposable-income growth, with regional GDP expected to rise 3.3% in 2025. Early movers that invest in localized after-sales networks lock in loyalty before competition intensifies.
North America and Europe remain mature but profitable, guided by tight efficiency rules that reward R&D-heavy incumbents. Consumers in these markets prioritize smart features, hygienic steam cycles, and eco-certifications, sustaining premium average selling prices.

Competitive Landscape
The residential washing machine market is moderately concentrated. A group of globally recognised manufacturers—Samsung, LG, Whirlpool, Electrolux, Haier, and BSH—controls more than half of worldwide shipments, yet dozens of regional and value-tier brands remain active. Scale advantages in sourcing, automation, and marketing underpin incumbents, while software ecosystems create new moats.
Samsung’s partnership with Procter & Gamble on Tide POD Cold cycles embeds detergent intelligence that rises above hardware parity. Electrolux, LG, and Whirlpool operate regional design hubs to reflect local laundry habits while sharing global platforms. Semiconductor constraints hastened partial vertical integration; Haier invests in in-house control-board production to secure supply. Cloud alliances such as LG-Microsoft supply generative-AI capabilities for service layers. Competitive focus thus shifts from price to ownership experience, fitting a moderate-concentration structure rather than a tightly monopolised one.
White-space targets include compact urban models, garment-refresh cabinets, and subscription laundry bundles. Entry barriers are rising under new energy rules, reinforcing the advantage of established players without eliminating room for niche challengers.
Residential Washing Machine Industry Leaders
LG Electronics Inc.
Whirlpool Corporation
Haier Group (incl. GE)
Samsung Electronics Co. Ltd.
BSH Home Appliances Group
- *Disclaimer: Major Players sorted in no particular order

Recent Industry Developments
- April 2025: Henkel introduced Smartwash chemistry linked to cloud sensors.
- April 2025: Samsung unveiled AI-equipped top-load washers with upgraded efficiency.
- March 2025: Samsung released Bespoke AI Laundry Vented Combo, finishing loads in 68 minutes.
- July 2024: Electrolux launched a smart laundry range to cut resource use and prolong textile life.


Research Methodology Framework and Report Scope
Market Definitions and Key Coverage
Mordor Intelligence defines the residential washing machine market as the annual revenue generated from new, factory-built laundry washers installed in dwellings such as houses, apartments, and dormitories. Units destined for laundromats, hotels, hospitals, or purely commercial contracts sit outside this boundary.
Scope exclusion: industrial washers, washer-dryer combos sold without a wash function, and replacement parts are not counted.
Segmentation Overview
- By Product
- Front Load
- With Dryers
- Without Dryers
- Top Load
- With Dryers
- Without Dryers
- Twin Tub
- Front Load
- By Technology
- Fully Automatic
- Semi-Automatic
- By Capacity
- Small (Below 6 Kg)
- Medium (6 to 8 Kg)
- Large (Above 8 Kg)
- By Connectivity
- Smart Connected
- Conventional
- By Distribution Channel
- Multi-brand Stores
- Exclusive Brand Outlets
- Online
- Other Distribution Channels
- By Geography
- North America
- Canada
- United States
- Mexico
- South America
- Brazil
- Peru
- Chile
- Argentina
- Rest of South America
- Asia Pacific
- India
- China
- Japan
- Australia
- South Korea
- South East Asia (Singapore, Malaysia, Thailand, Indonesia, Vietnam, and Philippines)
- Rest of Asia Pacific
- Europe
- United Kingdom
- Germany
- France
- Spain
- Italy
- BENELUX (Belgium, Netherlands, and Luxembourg)
- NORDICS (Denmark, Finland, Iceland, Norway, and Sweden)
- Rest of Europe
- Middle East And Africa
- United Arab of Emirates
- Saudi Arabia
- South Africa
- Nigeria
- Rest of Middle East And Africa
- North America
Detailed Research Methodology and Data Validation
Primary Research
We conducted structured interviews with appliance distributors, retail buyers, component suppliers, and energy-label certifiers across Asia-Pacific, North America, and Europe. Feedback on retail sell-through, smart-feature adoption, and price promotions helped us validate secondary trends, refine ASP curves, and stress-test forecast assumptions.
Desk Research
Our analysts first mapped production, trade, and household ownership patterns using open datasets such as UN Comtrade import codes, Eurostat appliance output, the US Energy Information Administration's appliance stock tables, and China's National Bureau of Statistics. Company filings, consumer-electronics associations, national energy-efficiency registries, and reputable press releases supplied penetration rates, average selling prices, and efficiency-driven replacement cycles. Access to D&B Hoovers and Dow Jones Factiva gave us recent financials and shipment comments that grounded baseline estimates. These sources, though illustrative, are not exhaustive; many additional public records aided data triangulation.
Market-Sizing & Forecasting
A combined top-down (household stock multiplied by washer penetration and mean price) and bottom-up cross-check (sampled manufacturer shipments and channel checks) drives the baseline value. Key model variables include new household formation, urbanization rates, disposable income per capita, regulatory efficiency standards, and smart-connected unit premiums. Forecasts apply multivariate regression blended with scenario analysis; coefficients were agreed with expert respondents and stress-tested for currency swings and raw-material cost shocks. Data gaps in shipment rolls were bridged using three-year moving averages anchored to verified customs flows.
Data Validation & Update Cycle
Before release, outputs pass variance checks against independent series such as electricity-saving certificate issuances or national retail surveys. An internal senior-junior peer review signs off the file. We refresh every twelve months and trigger interim revisions after material events like tariff changes or major product recalls, ensuring clients see the latest view.
Why Our Residential Washing Machine Baseline Earns Trust
Published estimates often diverge because each firm chooses different product scopes, pricing ladders, and refresh cadences.
Key gap drivers include scope creep into commercial laundries, unvetted ASP inflation, and one-off promotional spikes that some publishers embed directly into their totals, while Mordor's disciplined exclusions and annual recalibration avoid such distortions.
Benchmark comparison
| Market Size | Anonymized source | Primary gap driver |
|---|---|---|
| USD 46.99 Bn (2025) | Mordor Intelligence | - |
| USD 45.0 Bn (2024) | Global Consultancy A | Older base year and limited primary validation of channel sell-through |
| USD 62.88 Bn (2024) | Industry Research Publisher B | Blends residential with commercial washers, inflating total addressable value |
| USD 76.8 Bn (2024) | Trade Journal C | Wider product breadth and higher average selling price assumptions |
In sum, because Mordor's scope is tightly residential, its variables transparent, and its update rhythm disciplined, decision-makers receive a balanced, reproducible baseline they can confidently plug into strategy models.


Key Questions Answered in the Report
What is the current size of the residential washing machine market?
The residential washing machine market stands at USD 49.29 billion in 2026 and is expected to hit USD 62.55 billion by 2031.
Which product segment leads global sales?
Front-load washers lead with 51.23% revenue share in 2025 and carry the highest 5.72% CAGR through 2031.
How fast is the smart-connected washer segment growing?
Smart-connected machines grow at an 8.45% CAGR, the quickest among all connectivity categories.
Which region shows the strongest growth outlook?
The Middle East & Africa posts the fastest 6.44% CAGR thanks to urbanization and rising disposable income.
What regulatory change will most affect future demand?
The U.S. Department of Energy’s 2028 efficiency standard will phase out low-performing models and favor brands with strong R&D.
How are manufacturers using AI to differentiate products?
Leading brands embed AI algorithms that tailor cycles, provide energy dashboards, and offer predictive maintenance via connected apps, reinforcing customer loyalty and enabling premium pricing.
Page last updated on:


