
Refrigerated Container Shipping Market Size and Share
Market Overview
| Study Period | 2020 - 2031 |
|---|---|
| Forecast Data Period | 2026 - 2031 |
| Historical Data Period | 2020 - 2024 |
| Market Size (2026) | USD 10.48 Billion |
| Market Size (2031) | USD 12.64 Billion |
| Growth Rate (2026 - 2031) | 3.81 % |
| Market Concentration | Medium |
Major Players *Disclaimer: Major Players sorted in no particular order Image © Mordor Intelligence. Reuse requires attribution under CC BY 4.0. | |
Refrigerated Container Shipping Market Analysis by Mordor Intelligence
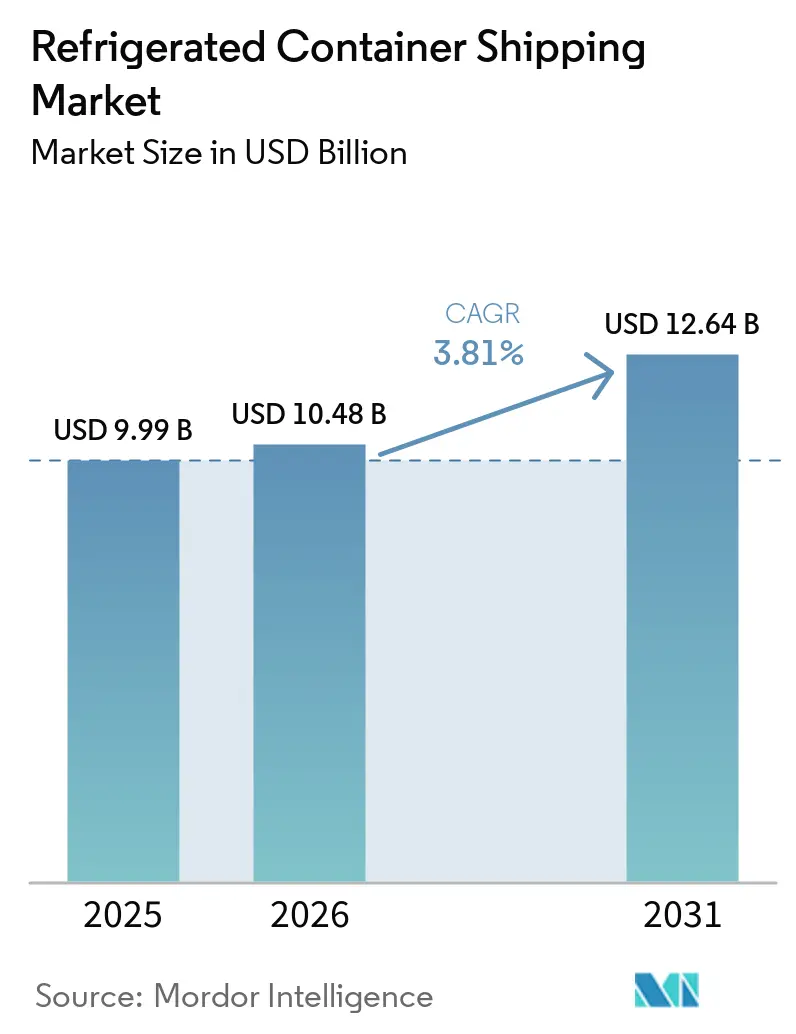
The refrigerated container shipping market is projected to expand from USD 9.99 billion in 2025 to USD 10.48 billion in 2026 and reach USD 12.64 billion by 2031, registering a 3.81% CAGR between 2026 and 2031.
Growth is anchored in Asia-Pacific’s expanding protein trade and in regulatory tailwinds that favor low-GWP refrigeration technology, yet recent rerouting around the Suez Canal has tightened effective capacity and pushed spot rates higher, exposing shippers to cost volatility. Investments in IoT-enabled reefers are accelerating as biologics, cell-and-gene therapies, and premium fresh produce demand real-time telemetry, ±0.25 °C accuracy, and blockchain-based custody tracking. Consolidation among lessors and liners, exemplified by Textainer-Seaco and the Hapag-Lloyd-ZIM tie-ups, redirects pricing power up the value chain, while policy-driven fleet renewal in China and the European Union’s F-gas phase-down compel operators to retire inefficient equipment. As alternative rail-sea intermodal corridors shorten door-to-door transit and bypass chokepoints, the refrigerated container shipping market is diversifying beyond its maritime core, forcing carriers to orchestrate multimodal cold-chain hand-offs with seamless visibility.
Key Report Takeaways
- By transportation mode, seaways led with 81.69% market share in 2025; other modes are forecast to expand at a 4.55% CAGR through 2031.
- By container size, high-cube units commanded 47.79% of the refrigerated container shipping market share in 2025 and are set to widen their lead at a 4.01% CAGR through 2031.
- By temperature range, chilled cargo accounted for 60.90% of the refrigerated container shipping market size in 2025, whereas frozen cargo is advancing at a 3.86% CAGR to 2031.
- By application, meat, fish, and poultry held 37.65% share of the market in 2025; pharmaceuticals and life sciences are moving fastest with a 5.21% CAGR expected through 2031.
- By geography, Asia-Pacific captured 41.02% of the revenue share in 2025 and is projected to grow at a 4.10% CAGR through 2031.
Note: Market size and forecast figures in this report are generated using Mordor Intelligence’s proprietary estimation framework, updated with the latest available data and insights as of January 2026.
Market Trends and Insights
Drivers Impact Analysis of Refrigerated Container Shipping Market*
| Driver | (~) % Impact on CAGR Forecast | Geographic Relevance | Impact Timeline |
|---|---|---|---|
| Growing trade relations | +0.6% | Global, with emphasis on RCEP Asia-Pacific and Latin America-Asia corridors | Medium term (2-4 years) |
| Increased demand for perishable goods | +0.8% | Asia-Pacific, Latin America, North America | Short term (≤ 2 years) |
| Rising demand for temperature-sensitive pharmaceuticals | +0.9% | Global, with concentration in North America, Europe, Asia-Pacific | Long term (≥ 4 years) |
| Booming cross-border e-grocery and meal-kit subscriptions | +0.4% | Europe, North America, urban Asia-Pacific | Short term (≤ 2 years) |
| Shift toward protein-rich diets in emerging Asia | +0.7% | Asia-Pacific (China, India, Southeast Asia) | Medium term (2-4 years) |
| Climate-change-driven fisheries relocation | +0.3% | Global, with acute impact on Southeast Asia, South America, Africa | Long term (≥ 4 years) |
| Source: Mordor Intelligence | |||
Growing Trade Relations
Preferential tariff frameworks such as RCEP allow Chinese exporters to ship 92% of fruits and vegetables under reduced duties, prompting an 18.7% year-on-year rise in fresh-produce exports during early 2026. Express reefer loops linking Guangxi to Ho Chi Minh City cut transit by up to two days and deliver 60-70% cost savings versus air, steering reefer demand from long-haul point-to-point models toward nimble intra-Asia feeders. Mexico’s USD 10 billion produce trade leverages USMCA customs streamlining, reinforcing north–south reefer corridors into North America[1]“Temperature Control in Vaccine Cold Chain,” World Health Organization, who.int . The gravitational pull of tariff optimization and compressed lead times is realigning fleets, with carriers redeploying boxes toward regional hub-and-spoke networks and away from congested mainline passages.
Increased Demand for Perishable Goods
China’s cold-chain logistics volume rose to 381.4 million tons in 2025, a 4.5% gain driven by online grocery platforms that promise same-day delivery. Infrastructure build-outs in lower-tier cities now enable Chilean cherries to traverse 20-day routes under controlled atmospheres without jeopardizing shelf life. Fresh chilled fish imports rocketed by 97% in volume as buyers sourced lower-cost Southeast Asian supplies, illustrating a barbell market where commodity flows chase efficiency while premium cargo pays for guaranteed plug points. This bifurcation forces the refrigerated container shipping market to tailor capacity, pricing, and service levels to two distinct value pools.
Rising Demand for Temperature-Sensitive Pharmaceuticals
Temperature excursions waste up to 50% of global vaccines each year, a USD 35 billion drag the industry is unwilling to tolerate. The Drug Supply Chain Security Act in the United States and EU GDP guidelines oblige end-to-end temperature logging, catalyzing investment in smart reefers with ±0.25 °C precision and blockchain custody. While air freight still moves 41% of pharma cold-chain volumes, maritime options gain credibility for bulk APIs and predictable regional routes where lower cost outweighs speed[2]“Drug Supply Chain Security Act,” U.S. Food and Drug Administration, fda.gov. Demand for integrity-assured boxes gives incumbents equipped with validated processes a compliance-driven moat.
Shift Toward Protein-Rich Diets in Emerging Asia
OECD-FAO projections see sustained rises in meat and seafood intake through 2034, with Brazil exporting 2.9 million tons of beef and Chile shipping more than 700,000 tons of salmon in 2025 to meet Asian appetite. Frozen reefers operating at –18 °C to –25 °C underpin these flows, while chilled reefers serve premium fresh cuts moving on shorter cycles. The dietary pivot boosts both volume and diversity of reefer cargo, compelling liners to balance cube-out efficiency with stricter hygiene and traceability expectations.
Restraints Impact Analysis of Refrigerated Container Shipping Market*
| Restraint | (~) % Impact on CAGR Forecast | Geographic Relevance | Impact Timeline |
|---|---|---|---|
| High cost of maintaining reefers | -0.5% | Global, with acute pressure in emerging markets with limited cold-chain infrastructure | Short term (≤ 2 years) |
| Volatile reefer freight rates linked to fuel surcharges | -0.6% | Global, with highest volatility on Asia-Europe and transpacific lanes | Short term (≤ 2 years) |
| Port congestion-induced spoilage risk | -0.4% | Asia-Pacific, Middle East, North America gateway ports | Short term (≤ 2 years) |
| Rising cyber-attacks on reefer telemetry | -0.2% | Global, with concentration in digitally connected fleets | Medium term (2-4 years) |
| Source: Mordor Intelligence | |||
High Cost of Maintaining Reefers
Variable-speed fans and advanced compressors can trim energy use by up to 20%, yet overhaul and calibration still absorb 10-20% of annual unit revenue. EU F-gas and the United States AIM Act mandates accelerate the switch to natural refrigerants such as R744, pushing capital requirements higher and straining small operators[3]“China’s Cold-Chain Policy Drives Capacity Gains,” International Institute of Refrigeration, iifiir.org. China’s December 2025 directive promoting low-carbon cold chains likewise retires legacy trucks, compressing payback windows but promising longer-term efficiency dividends.
Volatile Reefer Freight Rates Linked to Fuel Surcharges
Spot rates on Shanghai–Los Angeles oscillated between USD 1,200 and USD 3,400 per FEU in Q1 2026, a 183% swing compounded by bunker surcharges when Brent tops USD 100 bbl. After five alliances halted Suez Canal transits on 1 March 2026, Cape-route detours added 10-15 days and lifted Asia–Europe spot quotes 12% week-on-week, squeezing freshness windows. Best practice now blends 60-70% contracted reefer slots with 30-40% spot tonnage and sets aside contingency budgets equal to one-tenth of annual freight spend to avoid emergency air conversions.
*Our forecasts treat driver/restraint impacts as directional, not additive. The impact forecasts reflect baseline growth, mix effects, and variable interactions.
Refrigerated Container Shipping Market Segment Analysis
By Transportation Mode:
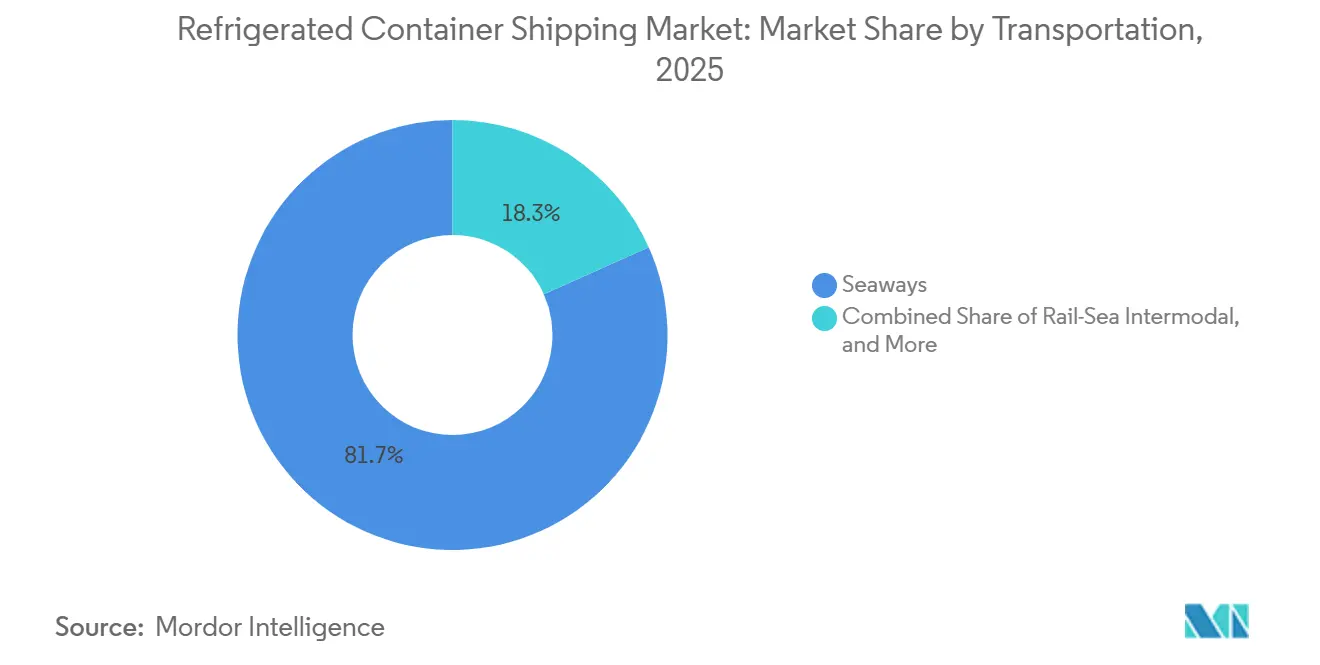
Maritime Scale Meets Multimodal ExperimentationSeaways commanded 81.69% market share in 2025, retaining primacy for intercontinental lanes where the refrigerated container shipping market benefits from cost-per-kilogram efficiency. Rail–sea intermodal, however, is forecast to grow at a 4.55% CAGR as China-ASEAN express loops shave up to two days off door-to-door schedules. The refrigerated container shipping market size for non-maritime modes remains modest. Still, it attracts investment in plug-point rail ramps and electric urban trucks, signaling a pivot toward agile, blended networks. Equipment harmonization and real-time orchestration become critical because cold-chain integrity can falter during mode transfers[4]“CIMC H1 2025 Results,” China International Marine Containers Group, cimc.com.
The modal shift accelerates when geopolitical tensions disrupt the oceans. Cape detours on Asia–Europe strings push shippers toward Central Asian rail corridors despite higher tariffs, and electric truck penetration surpassing 35% in China by mid-2025 unlocks zero-emission last-mile loops in polluted megacities. Yet constraints persist: limited chassis pools, urban delivery curfews, and scarce genset fuel infrastructure in secondary ports risk service gaps unless carriers coordinate across stakeholders.



By Container Size:
High Cube Payload Economics Drive AdoptionHigh cube units held 47.79% market share in 2025 and are expanding at 4.01% CAGR. Their 13% extra volume lowers per-kilogram freight on dense trade lanes, explaining why newbuild orders favor the format even at a 5-15% premium. The refrigerated container shipping market for standard 40-ft boxes endures where bridge clearances, inland rail tunnels, or yard-handling gear restrict 9 ft 6 inches of height. Small boxes retain relevance for e-grocery and pharmaceutical sample flows that prize flexibility over scale.
CIMC sold 92,000 TEU of reefers in H1 2025, more than doubling year-on-year, while Singamas accelerated custom builds for energy storage and multi-temperature designs. These investments underscore how size segmentation has evolved beyond dimensional categories into a spectrum of insulation grades, door configurations, and IoT packages that tailor total-cost-of-ownership to cargo needs.
By Temperature Range:
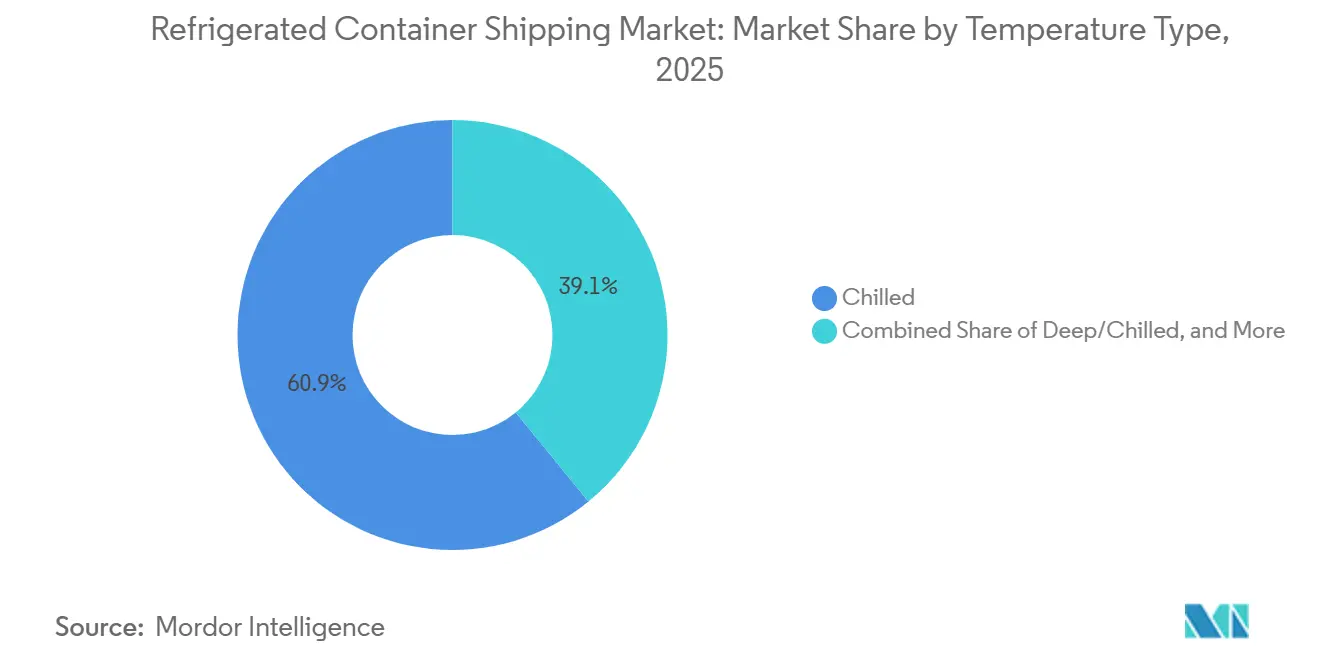
Chilled Cargo Commands Volume, Frozen ExpandsChilled freight captured 60.90% of the 2025 market size, spanning fresh produce, dairy, and high-value biologics. Frozen cargo is rising at 3.86% CAGR on the back of protein demand and logistics resilience: -18 °C set-points tolerate longer dwell, granting shippers a cushion against congestion. The refrigerated container shipping market share for chilled boxes hinges on airflow uniformity and ethylene suppression, compelling carriers to install dual evaporators and precision fans.
Conversely, frozen reefers require robust insulation and higher compressor loads, but the margin dilution is offset by longer commodity shelf life. Multi-temperature reefers that toggle between chilled and frozen modes gain favor with 3PLs optimizing backhaul utilization, though the technology commands a premium and complicates maintenance schedules.
By Application:
Proteins Lead, Pharma OutpacesMeat, fish, and poultry held a market share of 37.65% and value contribution in 2025. Latin American beef to China and Chilean salmon to Japan dominate frozen lanes, underpinning predictable, bulk shipments. Pharmaceuticals, however, are forecast to outpace at 5.21% CAGR, elevating the requirement for validated lanes, chain-of-custody documentation, and reefer telemetry. The refrigerated container shipping industry now courts biologics shippers with service-level agreements that stipulate ≤15-minute data gaps and automated exception alarms.
Horticulture benefits from shortened intra-Asia feeders, while dairy shipments remain sensitive to minor excursions that trigger microbial spoilage. Processed foods occupy a middle ground, demanding cost efficiency and moderate control. The application mosaic, therefore, pushes carriers to fine-tune fleet composition and digital platforms that match box specifications with cargo risk profiles.
Geography Analysis
APAC and South America Refrigerated Container Shipping Market
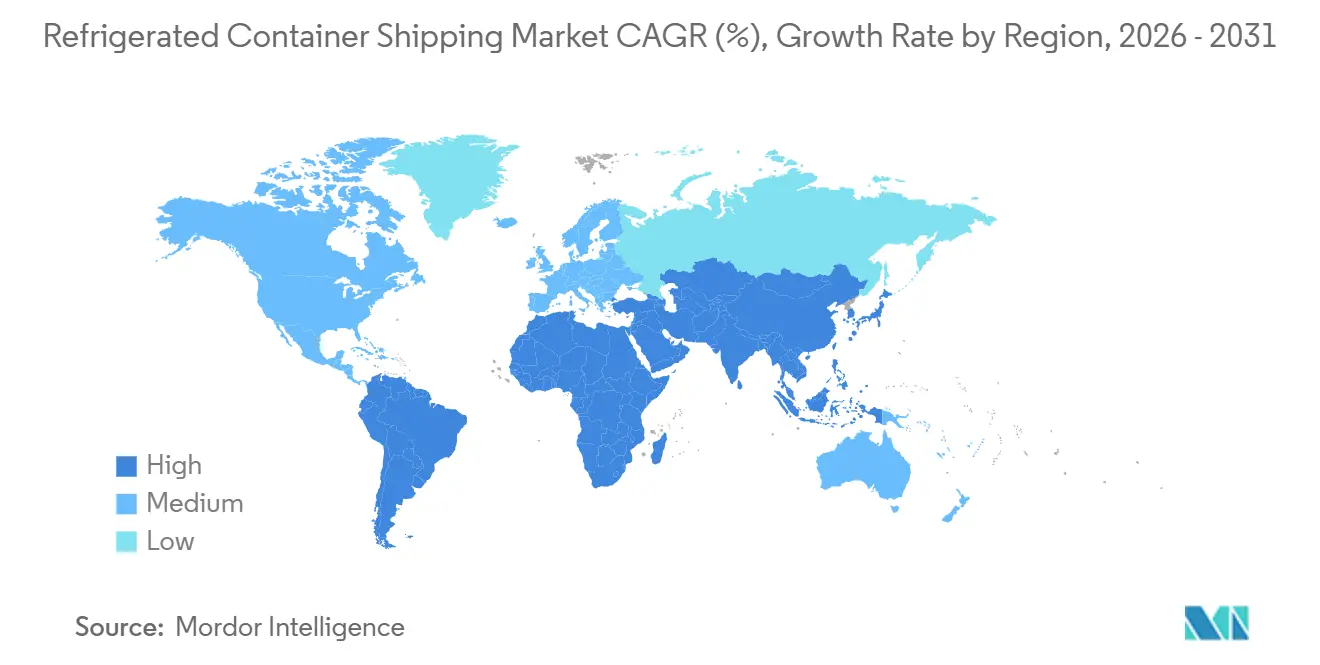
Asia–Pacific generated 41.02% of 2025 revenue and is advancing at 4.10% CAGR. China’s 277 million m³ of cold storage, up 5.53% during 2025, supports urban distribution to lower-tier cities, absorbing flows of Chilean cherries and Southeast Asian fish. Electric trucks already account for 35.8% of China’s refrigerated road fleet, reducing last-mile emissions and setting benchmarks that other emerging markets aim to emulate.
North America and Europe Refrigerated Container Shipping Market
North America wrestles with softer import demand: NRF forecasted inbound boxes in Q1 2026 at 7% below the prior year, directly trimming reefer volumes tied to produce and consumer staples. Europe, meanwhile, faces longer Cape detours, but terminal upgrades at Le Havre and Hapag-Lloyd’s new Damietta hub mitigate some capacity crunch by speeding reefer plug-point turnover.
LATAM Refrigerated Container Shipping Market
Latin America’s export model accounts for 40% of cold-chain demand. Polarport Veracruz volumes jumped 57% in early 2025, straining socket availability and genset logistics. Brazil’s beef and Chile’s salmon rely almost exclusively on maritime reefers, exposing regional economies to freight shocks yet also anchoring charter demand even when dry-cargo markets soften.
MEA Refrigerated Container Shipping Market
Middle East and Africa contribute modest volumes yet carry oversized risk. AIS spoofing incidents in the Strait of Hormuz and Suez transits suspensions in 2026 amplified war-risk premiums to USD 1,500 per TEU, forcing carriers to recalc service rotations. South African citrus bound for Europe and Asia must now budget wider buffers, while East African seafood exporters pivot to charter flights when maritime dwell exceeds shelf life.
Mordor Intelligence provides coverage of the refrigerated container shipping market across other key regional markets, including Asia, Europe, and North America, each with their regulatory frameworks and demand patterns.

Competitive Landscape
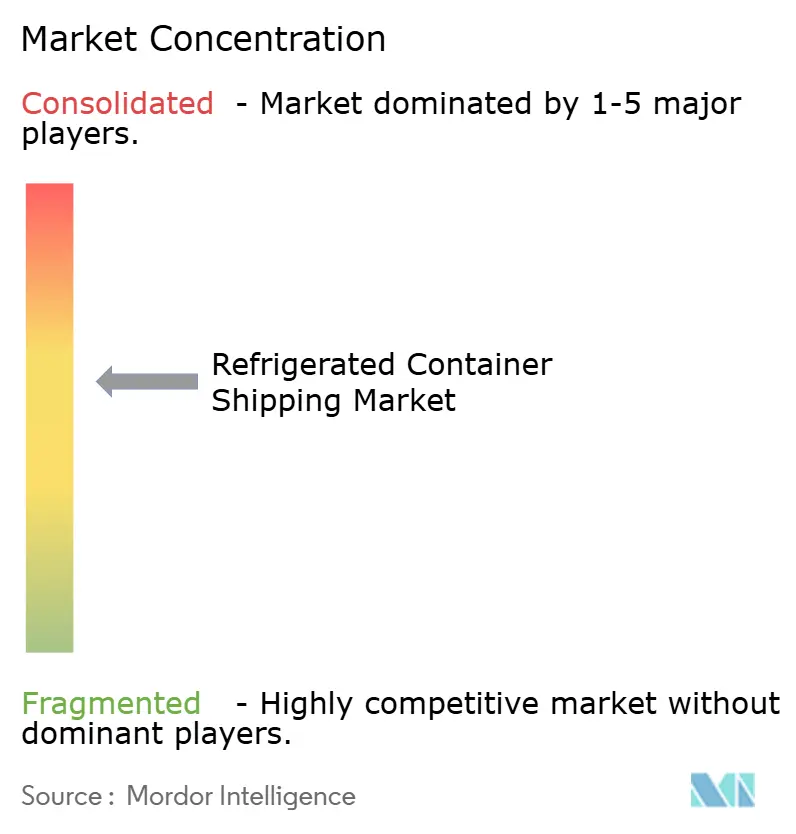
Consolidation is reshaping the refrigerated container shipping market. Textainer’s USD 5 billion Seaco buyout in April 2026 formed an 8.3 million CEU fleet, concentrating leasing capacity and elevating box lease rates. Triton’s 2025 purchase of Global Container International added 500,000 TEU, signaling that scale is a prerequisite for negotiating power with liner clients.
On the carrier side, Hapag-Lloyd’s USD 4 billion acquisition of ZIM will create the fifth-largest line by 2027, with over 3 million TEU and a reefer-heavy Latin America footprint. Maersk’s February 2026 order for eight 18,600 TEU methanol-ready ships and its 90% smart-container penetration reinforce a strategy of technology leadership. MSC’s iReefer platform, launched in 2025, provides end-to-end temperature, humidity, and battery monitoring, differentiating the carrier on data transparency.
Container builders likewise consolidate: CIMC commands more than 50% of global reefer output, enabling specification influence over refrigerant choice and IoT architecture. Equipment OEMs pivot toward sustainability: Carrier’s semi-electric Vector S 15 reduces diesel by 20%, and Thermo King’s March 2026 E-Volution unit targets zero-emission urban delivery. Overall, competition hinges less on raw capacity and more on differentiated service portfolios that blend validated cold-chain processes, digital visibility, and emissions-aligned assets.
Refrigerated Container Shipping Industry Leaders
Almar Container Group
Seaco Srl
Ocean Network Express Pte. Ltd.
SeaCube Container Leasing Ltd.
A.P. Moller - Maersk
- *Disclaimer: Major Players sorted in no particular order
Refrigerated Container Shipping Market Companies Covered in this Report
- A.P. Moller-Maersk
- MSC Mediterranean Shipping Co. S.A.
- CMA CGM Group
- China International Marine Containers (CIMC) Group
- Hapag-Lloyd AG
- Ocean Network Express Pte. Ltd.
- ZIM Integrated Shipping Services Ltd.
- Triton International Ltd.
- Seaco Srl
- SeaCube Container Leasing Ltd.
- Singamas Container Holdings Ltd.
- BSL Containers Ltd.
- Almar Container Group
- Textainer Group Holdings Ltd.
- Daikin Reefer
- Carrier Transicold Container Refrigeration
- Thermo King Marine
- Klinge Corp.
- Hyundai Translead
- Dong Fang International Container (DFIC)
- Polar Leasing Inc.
- C & C Reefer Services

Recent Industry Developments in Refrigerated Container Shipping Market
- March 2026: Thermo King launched the E-Volution electric truck refrigeration unit aimed at zero-emission city deliveries.
- February 2026: Hapag-Lloyd agreed to acquire ZIM for more than USD 4 billion, targeting completion by late 2026 subject to regulatory approval.
- January 2026: Utility Trailer and Schmitz Cargobull unveiled hybrid trailer refrigeration units combining electric and diesel power for long-haul routes.
- December 2025: Hapag-Lloyd ordered eight 4,500 TEU dual-fuel methanol ships from CIMC Raffles for USD 500 million to advance its 2030 climate targets.


Global Refrigerated Container Shipping Market Report Scope
| Seaways |
| Others |
| Small Containers |
| Large Containers |
| High Cube Containers |
| Chilled |
| Frozen |
| Horticulture (Fresh Fruits and Vegetables) |
| Dairy Products (Milk, Ice-cream, Butter, etc.) |
| Meat, Fish, and Poultry |
| Processed Food Products |
| Pharma and Lifesciences |
| Other Application |
| North America | United States |
| Canada | |
| Mexico | |
| South America | Brazil |
| Peru | |
| Chile | |
| Argentina | |
| Rest of South America | |
| Asia-Pacific | India |
| China | |
| Japan | |
| Australia | |
| South Korea | |
| South East Asia | |
| Rest of Asia-Pacific | |
| Europe | United Kingdom |
| Germany | |
| France | |
| Spain | |
| Italy | |
| BENELUX (Belgium, Netherlands, and Luxembourg) | |
| NORDICS (Denmark, Finland, Iceland, Norway, and Sweden) | |
| Rest of Europe | |
| Middle East and Africa | United Arab of Emirates |
| Saudi Arabia | |
| South Africa | |
| Egypt | |
| Rest of Middle East And Africa |
| By Transportation Mode | Seaways | |
| Others | ||
| By Container Size | Small Containers | |
| Large Containers | ||
| High Cube Containers | ||
| By Temperature Range | Chilled | |
| Frozen | ||
| By Application | Horticulture (Fresh Fruits and Vegetables) | |
| Dairy Products (Milk, Ice-cream, Butter, etc.) | ||
| Meat, Fish, and Poultry | ||
| Processed Food Products | ||
| Pharma and Lifesciences | ||
| Other Application | ||
| By Region | North America | United States |
| Canada | ||
| Mexico | ||
| South America | Brazil | |
| Peru | ||
| Chile | ||
| Argentina | ||
| Rest of South America | ||
| Asia-Pacific | India | |
| China | ||
| Japan | ||
| Australia | ||
| South Korea | ||
| South East Asia | ||
| Rest of Asia-Pacific | ||
| Europe | United Kingdom | |
| Germany | ||
| France | ||
| Spain | ||
| Italy | ||
| BENELUX (Belgium, Netherlands, and Luxembourg) | ||
| NORDICS (Denmark, Finland, Iceland, Norway, and Sweden) | ||
| Rest of Europe | ||
| Middle East and Africa | United Arab of Emirates | |
| Saudi Arabia | ||
| South Africa | ||
| Egypt | ||
| Rest of Middle East And Africa | ||


Key Questions Answered in the Report
What is the current size of the refrigerated container shipping market?
The market is valued at USD 10.48 billion in 2026 and is projected to reach USD 12.64 billion by 2031.
Which region contributes the largest share of reefer trade?
Asia–Pacific leads with 41.02% of global revenue and is expanding at a 4.10% CAGR.
How fast are high cube reefers growing?
High cube units, already at 47.79% share, are set to grow at a 4.01% CAGR through 2031.
What segment is the fastest-growing application?
Pharmaceuticals and lifesciences are expected to rise at a 5.21% CAGR owing to stricter temperature-control mandates.
How are geopolitical disruptions affecting routing?
Rerouting around the Suez Canal adds 10-15 days to Asia–Europe voyages, pushing rates up and compressing perishables’ freshness windows.
Which company steps are reshaping the competitive landscape?
Textainer–Seaco consolidation, the Hapag-Lloyd–ZIM merger, and MSC’s iReefer platform are redefining equipment availability, capacity, and digital visibility.
Page last updated on:





