Queue Management System Market Size and Share
Market Overview
| Study Period | 2020 - 2031 |
|---|---|
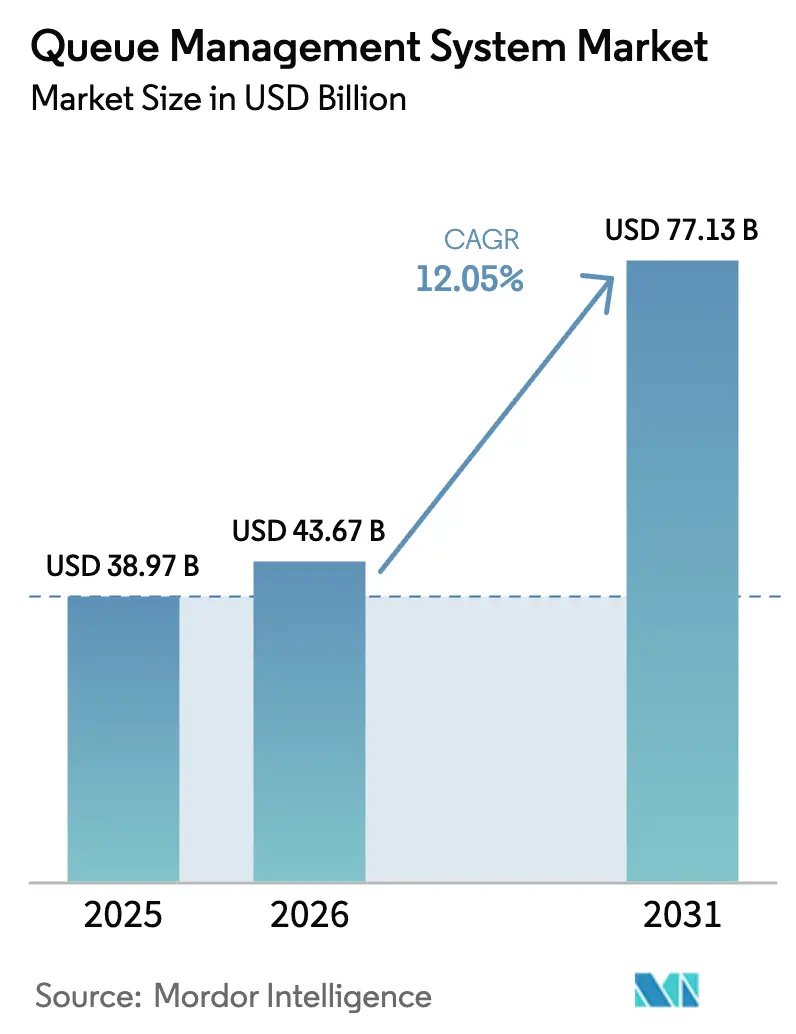
| Market Size (2026) | USD 43.67 Billion |
| Market Size (2031) | USD 77.13 Billion |
| Growth Rate (2026 - 2031) | 12.05% CAGR |
| Fastest Growing Market | Asia Pacific |
| Largest Market | North America |
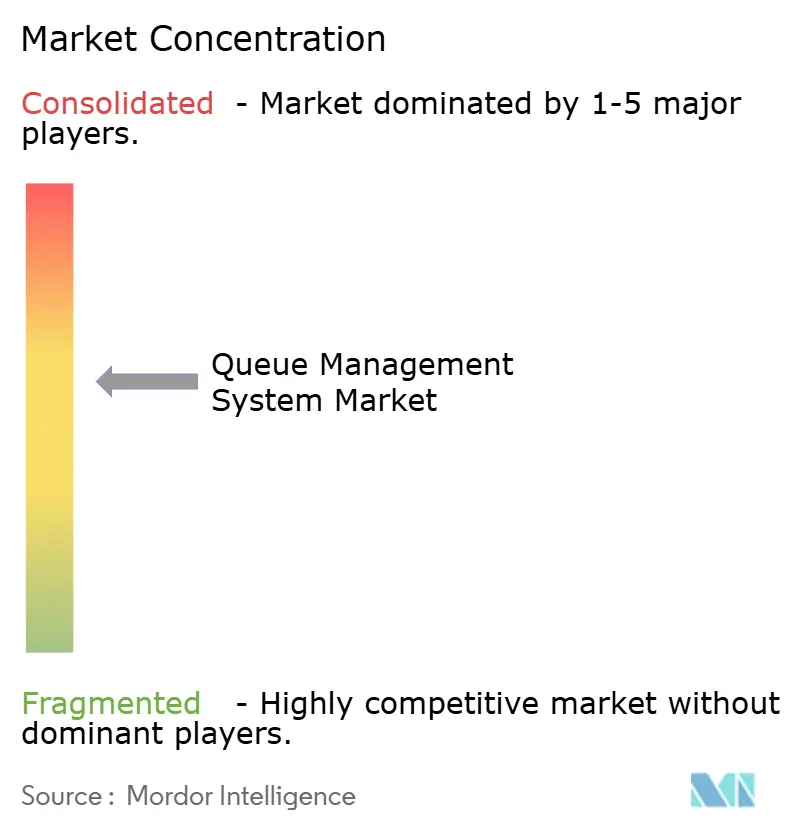
| Market Concentration | Medium |
Major Players *Disclaimer: Major Players sorted in no particular order Image © Mordor Intelligence. Reuse requires attribution under CC BY 4.0. | |
Queue Management System Market Analysis by Mordor Intelligence
The Queue Management System market size is expected to grow from USD 38.97 billion in 2025 to USD 43.67 billion in 2026 and is forecast to reach USD 77.13 billion by 2031 at 12.05% CAGR over 2026-2031. This expansion mirrors an accelerated pivot to cloud-native, AI-enabled platforms that unite customer-journey analytics, virtual queuing, and biometric authentication. Organizations are modernizing branch networks, clinics, airports, and government offices to limit congestion, comply with crowd-control rules, and surface actionable data in real time. Investments are concentrating on edge analytics for sub-second wait-time prediction, while rising foot-traffic at malls and transportation hubs revives demand for flexible, mobile-first ticketing. Across the Queue Management System market, vendors are combining hardware, software, and analytics under subscription models to cut capital outlays and shorten deployment cycles. Interoperability gaps, cybersecurity demands, and evolving data-sovereignty rules remain hurdles; however, strategic alliances among device makers, software specialists, and cloud providers are easing integration and opening new use cases in underserved verticals.
Key Report Takeaways
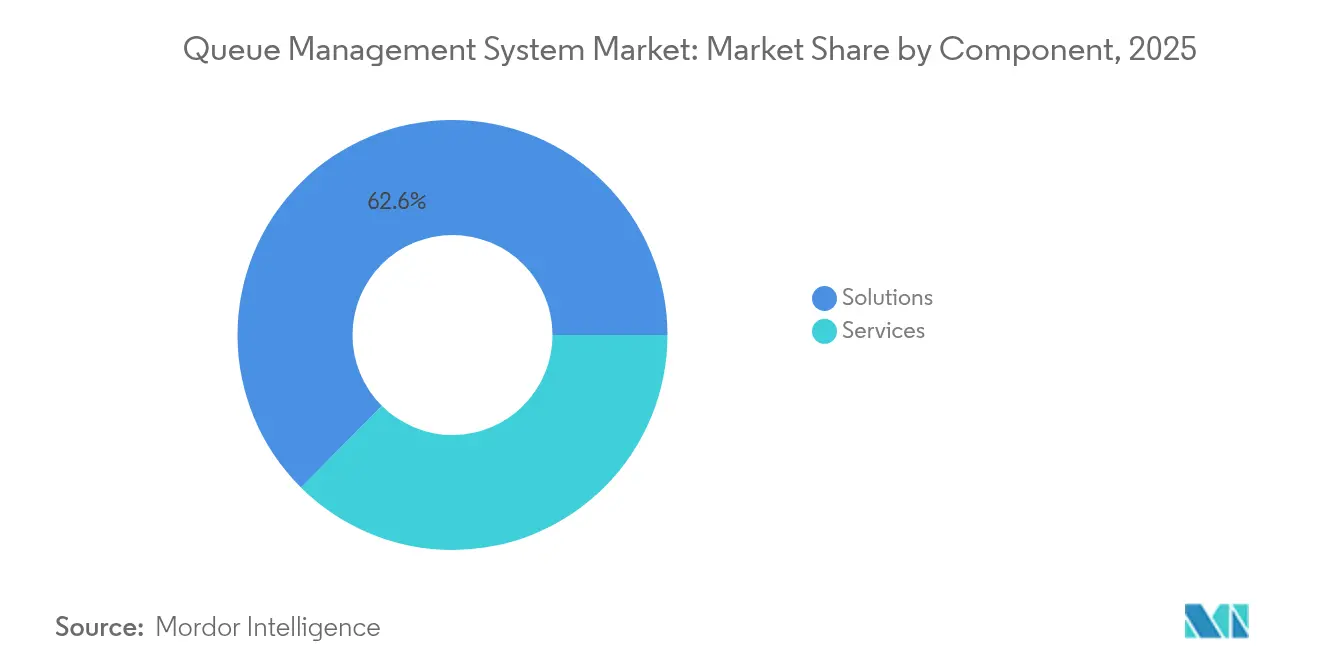
- By component, solutions led with 62.55% revenue share in 2025, while services are forecast to advance at an 8.45% CAGR through 2031.
- By deployment, on-premises systems held 54.10% of the Queue Management System market share in 2025; cloud-based platforms are expected to expand at an 11.05% CAGR to 2031.
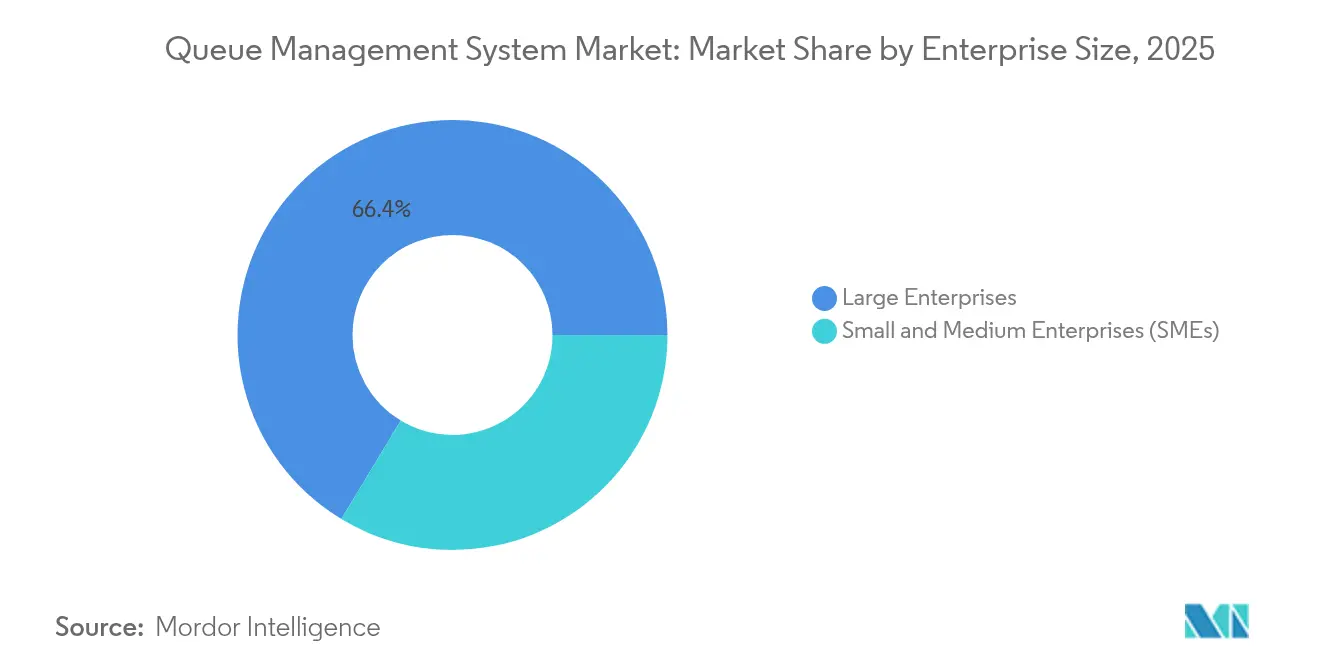
- By enterprise size, large enterprises accounted for 66.35% share of the Queue Management System market size in 2025, whereas SMEs are growing at a 9.28% CAGR.
- By end-user, BFSI commanded 23.85% of 2025 revenue, while healthcare is set to progress at a 12.31% CAGR.
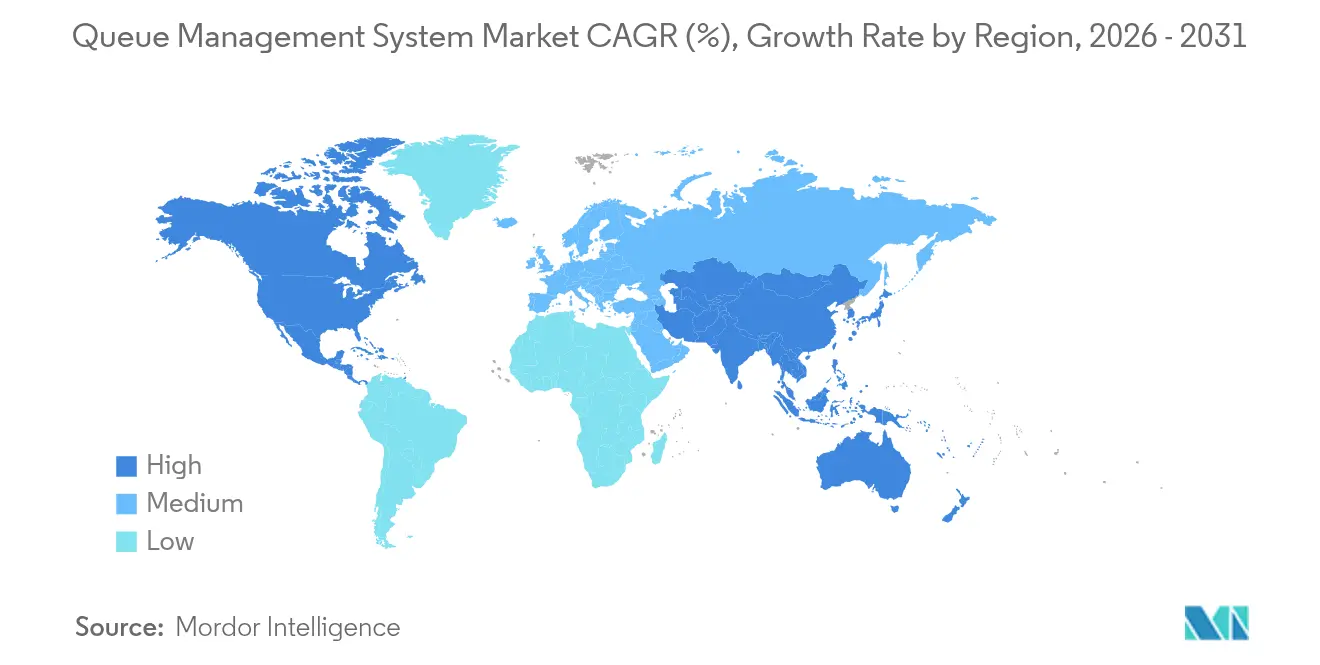
- By geography, North America held 35.95% of global revenue in 2025; Asia-Pacific is projected to post the fastest 10.1% CAGR from 2026 to 2031.
Note: Market size and forecast figures in this report are generated using Mordor Intelligence’s proprietary estimation framework, updated with the latest available data and insights as of 2026.
Global Queue Management System Market Trends and Insights
Drivers Impact Analysis*
| Driver | (~) % Impact on CAGR Forecast | Geographic Relevance | Impact Timeline |
|---|---|---|---|
| Rising foot-traffic rebound in high-density venues | +2.1% | Global, especially Asia-Pacific and NA | Short term (≤ 2 years) |
| Cloud-native and AI-driven QMS platforms | +3.5% | Global | Medium term (2-4 years) |
| Real-time customer-journey analytics adoption | +2.8% | North America, Europe, Asia-Pacific | Medium term (2-4 years) |
| Government mandates on crowd-control compliance | +1.7% | North America, Europe, Asia-Pacific | Short term (≤ 2 years) |
| Edge analytics for sub-second wait-time predictions | +1.0% | Asia-Pacific , North America | Long term (≥ 4 years) |
| Computer-vision people-counting integration | +0.7% | Europe, Asia-Pacific | Medium term (2-4 years) |
| Source: Mordor Intelligence | |||
Rising Foot-Traffic Rebound in High-Density Venues
In-person activity at malls, airports, stadiums, and public offices surged in 2025, prompting operators to refresh outdated ticketing kiosks and display boards. Upgrades favor virtual queuing, mobile notifications, and AI routing that reallocates service agents on the fly. A leading U.S. theme park cut average wait times by 28% after installing dynamic queue analytics, boosting throughput without additional staffing[1]Wavetec, “AI-Powered Queue Management Cuts Wait Times at Global Theme Park,” wavetec.com. Similar gains are reported at European airports that now redirect passengers to the shortest security lane using predictive counters. The rebound exposes legacy bottlenecks, accelerating cyclic replacement across high-traffic venues.
Cloud-Native and AI-Driven QMS Platforms
Cloud architectures underpin next-generation deployments, unifying data from kiosks, sensors, and apps while automating capacity bursts during promotional peaks. Organizations integrate AI agents that forecast queue length, allocate counters, and surface compliance alerts. A multinational retailer migrated 500 stores to a cloud QMS in less than six months, enabling self-service appointment booking and branch-wide analytics[2]joinaQ, “Retail Chain Completes 500-Store Cloud QMS Migration,” joinaq.com. Cloud delivery also supports pay-as-you-grow pricing, encouraging SMEs to adopt enterprise-grade functionality without heavy capital outlay.
Real-Time Customer-Journey Analytics Adoption
Enterprises now stream wait-time, dwell-time, and agent-productivity data into dashboards that refresh every few seconds. Banks adjust teller rosters as foot-traffic changes by the hour, and hospitals monitor patient bottlenecks from triage to discharge. A North American bank trimmed lobby waits by 35% and raised cross-sell conversions after integrating queue intelligence with its CRM platform. The Queue Management System market benefits as analytics move from historical reporting to prescriptive guidance that feeds staffing apps and digital-signage APIs.
Government Mandates on Crowd-Control Compliance
Regulators in the United States, Canada, the European Union, and parts of Asia require live occupancy monitoring in public buildings, prompting rapid QMS rollouts. New municipal ordinances stipulate clear signage, auditable wait-time records, and privacy safeguards for biometric data. Vendors embed auto-reporting modules that send anonymized metrics directly to compliance portals, easing audit workloads for hospitals and tax offices[3]ACF Technologies, “Omni-Channel Appointment Scheduling for Banking,” acftechnologies.com. Heightened scrutiny lifts baseline functionality expectations and expands addressable demand among public agencies.
Restraints Impact Analysis*
| Restraint | (~) % Impact on CAGR Forecast | Geographic Relevance | Impact Timeline |
|---|---|---|---|
| High upfront hardware and integration costs | -1.9% | Global, especially emerging Asia-Pacific | Short term (≤ 2 years) |
| Cyber-security and data-sovereignty concerns | -1.4% | North America, Europe, Asia-Pacific | Medium term (2-4 years) |
| Legacy-system interoperability gaps | -1.0% | Global | Medium term (2-4 years) |
| Emerging biometric-privacy regulations | -0.8% | North America, Europe | Long term (≥ 4 years) |
| Source: Mordor Intelligence | |||
High Upfront Hardware and Integration Costs
Advanced QMS packages combine ticketing kiosks, IoT sensors, displays, cameras, and analytics gateways. Global semiconductor shortages and shipping delays lifted component prices by double digits in 2024, pushing project payback beyond budget cycles for many hospitals and government departments. Some vendors introduced hardware-light “virtual lobby” bundles that replace kiosks with QR codes and SMS alerts, cutting initial spend by as much as 45%. Even so, capital intensity remains a hurdle in cost-sensitive emerging markets.
Cyber-Security and Data-Sovereignty Concerns
High-profile breaches in the public sector sparked demands for end-to-end encryption, multi-factor authentication, and strict data-residency controls. European customers require vendors to prove GDPR alignment and offer regional data centers; similar stipulations apply under India’s Digital Personal Data Protection Act. To mitigate risk, providers now bundle zero-trust frameworks, role-based access, and tamper-proof audit logs. These safeguards lengthen procurement cycles and add compliance overhead but are indispensable for sustained growth.
*Our forecasts treat driver/restraint impacts as directional, not additive. The impact forecasts reflect baseline growth, mix effects, and variable interactions.
Segment Analysis
By Component: Cloud Services Drive Next-Gen Adoption
Solutions captured 62.55% revenue in 2025, underscoring entrenched demand for configurable platforms that automate ticket issuance, route optimization, and performance reporting. Within the Queue Management System market, services are growing quickest at 8.45% CAGR as enterprises outsource continuous integration, analytics tuning, and staff training. Managed “QMS-as-a-Service” bundles wrap software, hardware, and updates under one fee, allowing hospitals to scale usage during vaccination drives without purchasing extra kiosks.
Innovation within solutions centers on AI-assisted routing, computer-vision occupancy detection, and hybrid physical-virtual queuing. Operators in retail amplify loyalty apps with mobile check-in links that cut abandonment. These advances enlarge the Queue Management System market by serving previously manual flows in clinics and government offices.


By Deployment: Cloud Surges on Flexibility, On-Premises Holds Niche
On-premises deployments remained prevalent in 2025, securing 54.10% share among banks, public agencies, and defense sites requiring tight data stewardship. The Queue Management System market size for on-premises platforms is expected to grow modestly as refresh cycles emphasize compatibility with biometrics and edge analytics. Conversely, cloud installations are forecast to outpace the field at 11.05% CAGR because they offer instant scaling, cross-site coordination, and evergreen upgrades.
Asia-Pacific banks migrated thousands of branches to cloud QMS that pool transaction data, enabling unified reporting and branch-level queue forecasting. Hybrid models also emerge: local servers capture biometric images, while anonymized metadata travels to cloud analytics engines, satisfying residency rules without sacrificing insight.
By Enterprise Size: SMEs Accelerate, Large Enterprises Dominate
Large enterprises commanded 66.35% of 2025 revenue and continue to leverage global scale to pilot computer-vision ticketing at airports and AI staffing bots in city-wide service centers. They negotiate bundle discounts, driving multi-year deals that anchor the Queue Management System market.
SMEs are projected to expand at a 9.28% CAGR as subscription queues remove entry barriers. Neighborhood clinics deploy mobile appointment links that integrate with calendars and payment wallets, while boutique retailers replace paper sign-up sheets with virtual lobbies. The Queue Management System market size for SMEs is small in absolute terms but widens as cloud bundles lower total cost of ownership. Affordable packages let SMEs mirror enterprise-class customer experience without large IT teams.
By End-User: BFSI Leads, Healthcare Outpaces in Growth
BFSI institutions retained the largest user base in 2025, contributing 23.85% of sales due to their need for secure, auditable, and highly available customer-flow coordination. Banks embed queue widgets in mobile apps so account holders reserve slots ahead of arrival, cutting lobby congestion and upselling cross-channel products. This segment also fuels demand for encrypted self-service kiosks that print receipts with time-stamped tokens.
Healthcare is the fastest mover, advancing at a 12.31% CAGR as patient-journey digitization improves throughput and regulatory compliance. Hospitals unify triage, lab, and pharmacy stations under one queue view, reducing handover delays by double digits. A pediatric center in Estonia deployed child-friendly signage with animated avatars that ease anxiety, pulling family satisfaction scores up by 22%. Such successes amplify adoption across outpatient clinics and vaccination hubs.
Geography Analysis
North America generated the largest regional revenue in 2025, capturing 35.95% of the Queue Management System market. Federal and state agencies mandate live wait-time displays for licensing offices, while healthcare providers roll out HIPAA-compliant virtual lobbies that mask personal information. A U.S. county DMV trimmed average visit duration from 90 minutes to 26 minutes after a cloud migration, boosting Net Promoter Score by 40 points Qless. Robust investment in AI analytics, coupled with readiness to pay for premium support, sustains the region’s leadership.
Europe holds a smaller share yet stands out for stringent data-privacy rules and rapid uptake of biometric authentication. Vendors must supply GDPR-compliant consent flows, role-based encryption, and in-region hosting. Airports adopt computer-vision counters that comply with the EU Artificial Intelligence Act, balancing innovation with passenger privacy. Public hospitals leverage queue dashboards to meet service-time benchmarks mandated by national health ministries, further enlarging adoption.
Asia-Pacific is forecast to deliver the highest 10.1% CAGR from 2026 to 2031. China, India, and ASEAN nations are expanding 5G and fiber networks, enabling real-time queue coordination across mega-branch networks. An Indian public-service center processed 40% more applications per day after deploying SMS-based ticketing in 12 languages. Japanese and Australian airports test biometrics-enabled queue lanes that read passports and boarding passes in seconds, trimming processing times without manual checks. Local suppliers differentiate with multilingual interfaces and integrations that address region-specific digital identity frameworks. Elsewhere, Latin America and the Middle East and Africa enter formative stages, piloting QMS in tax offices and mass-transit hubs. Currency constraints and uneven connectivity temper spending, yet mobile-first virtual queues demonstrate quick wins in retail chains. As regulatory landscapes mature, these regions may leapfrog directly to cloud-native architectures, avoiding legacy lock-in

Competitive Landscape
The Queue Management System market is moderately fragmented: the top five suppliers account for roughly 55% of global revenue, while dozens of regional providers focus on niche verticals. Competitive intensity rises as incumbents such as QLess, ACF Technologies, and Q-nomy embed AI copilots that recommend staffing levels and predict abandonment risk. Emerging challengers bundle low-code integration kits that link queues to CRMs and PoS terminals within days.
Technology remains the primary differentiator. Patent filings in delay-aware scheduling, multi-access edge computing, and virtual lobbies rose sharply over 2024-2025, signaling a shift to latency-sensitive architectures that forecast demand spikes in milliseconds IBM. Vendors collaborate with camera manufacturers and payment gateways to present turnkey packages that cut integration complexity. Cloud hyperscalers support go-to-market by offering discounted compute credits and marketplace visibility.
Strategic partnerships proliferate. In April 2025, Akamai welcomed Queue-it to its Qualified Compute Partner roster, combining virtual waiting rooms with CDN-backed performance safeguards. Regional integrators secure exclusive rights to deploy leading platforms in healthcare or public-sector verticals, tailoring language packs, privacy presets, and local support. Regulation remains a wild card: stricter biometric-privacy laws could raise compliance costs and reshape vendor roadmaps, perhaps favoring suppliers with in-house legal and data-protection expertise.
Queue Management System Industry Leaders
Q-Matic AB
Wavetec FZ-LLC
Advantech Co. Ltd
QLess Inc.
Aurionpro Solutions Ltd
- *Disclaimer: Major Players sorted in no particular order

Recent Industry Developments
- April 2025: Akamai Technologies and Queue-it partnered under the Akamai Qualified Compute Partner Program to deliver scalable virtual waiting rooms for high-traffic events.
- October 2024: QLess launched Service Intelligence, an add-on for its Tempo suite that deepens analytics on employee performance and operational bottlenecks.
- October 2024: Q-nomy released Virtual Lobby 3.2.0, adding pre-appointment confirmation links and QR-code-based check-ins that remove the need for physical kiosks.
- July 2024: Q-nomy upgraded Q-Flow 6.4, enhancing online booking, appointment scheduling, and queue management functions.


Research Methodology Framework and Report Scope
Market Definitions and Key Coverage
Our study defines the queue management system market as revenue generated from software platforms, supporting hardware (kiosks, ticket dispensers, digital signage, and mobile-based virtual queuing apps), plus related professional and managed services that monitor, predict, and control customer flow across banks, hospitals, airports, retail stores, government counters, and similar public-facing venues.
Scope Exclusions: Stand-alone staff-scheduling tools, generic CRM suites, and simple appointment plug-ins that never touch on-site queues lie outside this scope.
Segmentation Overview
- By Component
- Solutions
- Linear Queuing
- Virtual Queuing
- Services
- Solutions
- By Deployment
- Cloud
- On-Premises
- By Enterprise Size
- Large Enterprises
- Small and Medium Enterprises (SMEs)
- By End-user
- BFSI
- IT and Telecom
- Retail and e-Commerce
- Healthcare and Life Sciences
- Government and Public Sector
- Hospitality, Airports and Transportation
- By Geography
- North America
- United States
- Canada
- Mexico
- South America
- Brazil
- Argentina
- Rest of South America
- Europe
- United Kingdom
- Germany
- France
- Italy
- Spain
- Nordics
- Rest of Europe
- Middle East and Africa
- Middle East
- Saudi Arabia
- United Arab Emirates
- Turkey
- Rest of Middle East
- Africa
- South Africa
- Egypt
- Nigeria
- Rest of Africa
- Middle East
- Asia-Pacific
- China
- India
- Japan
- South Korea
- ASEAN
- Australia
- New Zealand
- Rest of Asia-Pacific
- North America
Detailed Research Methodology and Data Validation
Primary Research
Phone interviews and online surveys with product managers, systems integrators, retail operations heads, and hospital administrators in North America, Europe, the Gulf, and Asia supplied live penetration ratios, cloud-migration timelines, and service-fee structures. Follow-up e-mail checks resolved any outliers, so our assumptions stayed grounded.
Desk Research
We began by gathering recent series on retail footfall, outpatient visits, airline passenger traffic, and branch-level banking activity from tier-1 public sources such as the National Retail Federation, the American Hospital Association, IATA, and Eurostat. Annual reports, 10-Ks, and investor decks then revealed vendor revenue splits, while patent filings signaled emerging features. Press releases and analyst notes inside Dow Jones Factiva flagged pricing moves and contract awards, and D&B Hoovers gave concise financials for smaller suppliers. This set is illustrative; many other open and licensed sources informed the evidence base.
A second pass focused on regulatory notices and tender portals that list queue-system procurements, which helped our team benchmark average selling prices and refresh cycles before moving to primary validation.
Market-Sizing & Forecasting
We apply a top-down demand-pool build: service locations and daily visit volumes convert into 'points of service,' which are multiplied by verified penetration, license counts, and replacement cycles. Supplier roll-ups and sampled ASP x unit checks act as a bottom-up sense test before totals are finely adjusted. Key variables include active bank branches, outpatient check-in stations, airport counters, kiosk lifespan, and the cloud-to-on-prem seat ratio. A multivariate regression that blends GDP-per-capita, retail floor expansion, and digital-transformation spend underpins the five-year outlook, with scenario analysis where pandemic recovery or new mandates shift traffic patterns.
Data Validation & Update Cycle
Each model passes three variance screens, peer review, and senior-analyst sign-off. We refresh the dataset once a year, with mid-cycle updates triggered by major mergers, national regulation, or landmark contracts. A final pass just before publication ensures clients see the latest view.
Why Mordor's Queue Management System Baseline Earns Credibility
Published estimates often diverge because firms choose different inclusions, base years, and price-compression levers, and only when those hidden choices surface can values be compared fairly.
Key gap drivers here are whether field hardware and services are counted, if mobile apps are lumped into wider CRM suites, the aggressiveness of cloud discount curves, and how often models are recalibrated to fresh vendor disclosures.
Benchmark comparison
| Market Size | Anonymized source | Primary gap driver |
|---|---|---|
| USD 38.97 billion (2025) | Mordor Intelligence | - |
| USD 0.84 billion (2024) | Global Consultancy A | Excludes kiosks and services; constant ASPs; 24-month refresh |
| USD 0.75 billion (2023) | Trade Journal B | Software only; single-region sample scaled globally |
| USD 0.70 billion (2023) | Industry Association C | Counts installations, not revenue; omits virtual-queuing licenses |
These comparisons show that by pairing clear scope boundaries with dual-path modeling and timely vendor inputs, Mordor Intelligence delivers a balanced, transparent baseline that decision-makers can retrace and replicate with confidence.


Key Questions Answered in the Report
What is the global value of the Queue Management System market in 2026?
The Queue Management System market is valued at USD 43.67 billion in 2026.
How fast will the market grow through 2031?
Revenue is projected to rise to USD 77.13 billion by 2031 at a 12.05% CAGR.
Which component segment is expanding the quickest?
Services are growing fastest at an 8.45% CAGR as firms seek managed integration and analytics support.
Why are cloud deployments gaining ground?
Cloud QMS platforms deliver rapid scaling, real-time analytics, and multi-site control, resulting in an 11.05% CAGR that outpaces on-premises systems.
Which region offers the highest growth opportunity?
Asia-Pacific is forecast to post the strongest regional CAGR of 10.1% from 2026 to 2031, driven by digital-infrastructure investments and mobile-first engagement.
How are vendors addressing data-privacy concerns?
Providers embed zero-trust security, regional data centers, and GDPR-compliant consent flows to satisfy rising data-sovereignty demands and secure long-term adoption.
Page last updated on:


